Abstract
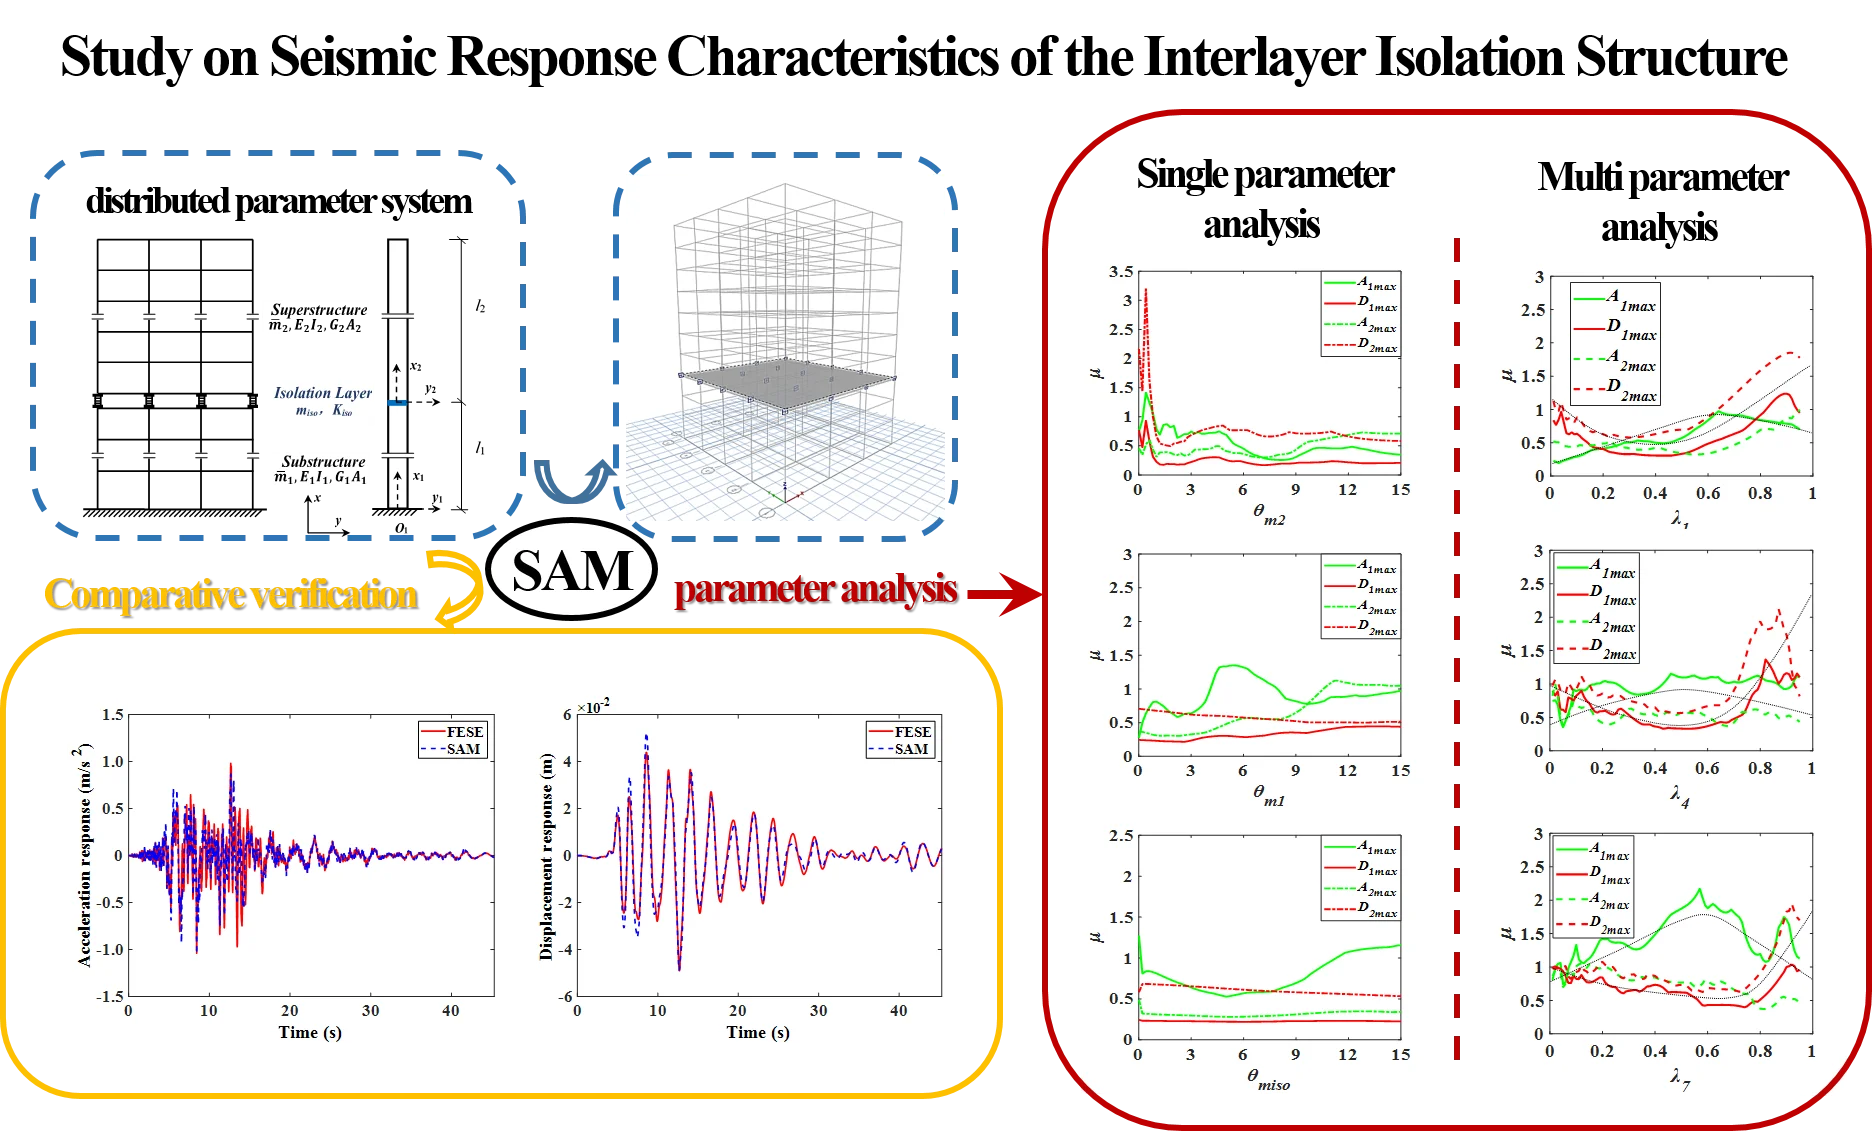
Based on Timoshenko beam theory and considering the layer bending deformation and shear deformation of the structure, a semi analytical solution method (SAM) is proposed for the interlayer isolation structure system. The equivalent mechanical model of cantilever beam is established by using the distributed parameter system, on which the dynamic partial differential equation is derived; the boundary condition and continuity condition are used to solve the equation to obtain the natural vibration characteristics; the orthogonal conditions are deduced by Betti’s law and the seismic response of the structure can be solved by the mode superposition method. A 10 story isolated structure is designed as well as analysed by the semi analytical method (SAM) and the ETABS finite element simulation (FESE) separately. The results show that: the existence of the isolation layer may reduce the response of the superstructure and amplify the response of the substructure, and the amplification can be solved by increasing the mass, bending stiffness of the superstructure and shear stiffness of the isolation layer. In regular interlayer isolation structure, the optimal frequency ratio of the superstructure and substructure increases with the rising of isolation layer position. The results also prove the correctness and accuracy of the SAM, which enriches the analysis theory of interlayer isolation structure and provides reference for the accurate analysis of structural response in engineering.
Highlights
- Using the distributed parameter system, a semi analytical solution method (SAM) is proposed for the interlayer isolation structure.
- Through the comparison with the solution results of finite element method for the interlayer isolation structure, the SAM is proved to be correct and effective.
- The existence of the isolation layer may reduce the response of the superstructure and amplify the response of the substructure, and the amplification can be solved by increasing the mass, bending stiffness of the superstructure and shear stiffness of the isolation layer.
1. Introduction
In recent years, researchers continue to improve the theoretical system of interlayer isolation structure on the basis of engineering practice [1-14]. At present, the particle system model is mainly used in the dynamic analysis of interlayer isolation structure. Zhou Fulin et al. [15] used two particle simplified model to study the mechanical characteristics of interlayer isolation structure, and obtained the change of isolation mechanism when the location of isolation layer is different; Cao Jialiang [16], He Dongdong [17] also used two particle model to study the model parameter sensitivity and model parameter optimization of interlayer isolation structure. Based on the multi-particle layer shear model, using the random vibration analysis method, Qi Ai [18] obtains the relationship between the isolation effect of the interlayer isolation structure and the damping of the isolation layer and the frequency ratio of each substructure. However, the actual interlayer isolation structure is a continuum. Its mass, stiffness and damping are continuously distributed in space, which makes the structure have infinite degrees of freedom. Therefore, for the equivalence of the continuous structure, the distributed parameter system model is closer to the reality than the particle system model. When using the theory of parameter distribution system to simplify the interlayer isolation structure to beam model for dynamic analysis, according to different assumptions, Euler Bernoulli beam theory or Timoshenko beam theory can be used [19]. Compared with Euler Bernoulli beam theory, Timoshenko beam theory takes shear action into account, and has higher accuracy and wider application range of slenderness ratio [20]. When the position of the isolation layer rises gradually, the deformation of the substructure and superstructure of the interlayer isolation structure changes from the bending type to the bending shear type, and the influence of the shear deformation on the higher-order mode is a source of the modal error that cannot be ignored [21]. Therefore, it is more accurate and practical to adopt Timoshenko beam theory to establish the distributed parameter system model of interlayer isolation structure.
For the distributed parameter system, there are few researches on the interlayer isolation structure, but it has been mature in other scientific fields. Li Yuanchun [22, 23] calculated the kinetic energy, potential energy and virtual work of the whole system for the flexible loading system of manipulator, and gave the distributed parameter dynamic model reflecting the essence of the system by using Hamiltonian principle. Based on the distributed parameter system, Chen Yangyang et al. [24, 25] analyzed the single pier particle system of the high pier beam bridge, and obtained the analytical formula with higher accuracy and wider application range for studying the factors affecting the mode mass participation coefficient of the system; Also based on the vibration theory of distributed parameter beam, Du Yongfeng [26, 27] deduced and verified the semi analytical method of seismic response of the isolation system of series and parallel electrical equipment support, which provided the thinking and reference for the study of parameter model analysis of building structure such as interlayer isolation; Song Xiao et al. [28] established the distributed parameter model of the interlayer isolation structure, and used the virtual excitation method to solve the seismic response. It was found that the participation of the isolation layer adjusted the quality participation coefficient of each vibration mode of the structure, and then affected the isolation effect.
In this paper, the Timoshenko beam theory is used to establish the equivalent mechanical model of structural distribution parameters. Then the dynamic equation is deduced, the natural frequency and mode are calculated, and the mode decomposition method is used to solve the response of the interlayer isolation structure. Finally, for a 10 story isolated structure, the correctness of the model and the structure solution method is verified by the finite element method (FEM) and the ETABS finite element software simulation (FESE). In addition, the influence of the parameters of substructures on the isolation effect is also studied. There are many symbols in this paper. In order to make it more convenient to read, the important symbols and meanings are listed in Table 1. If there is special case, it will be explained in the text.
Table 1Symbols and the corresponding meanings
Symbol | Meaning | Symbol | Meaning |
Mass of the beam | Natural frequency of the structure | ||
Bending stiffness of the beam | Mode function of the structure | ||
Shear stiffness of the beam | Acceleration of ground motion | ||
stiffness | The damping coefficients of horizontal velocity | ||
Moment of inertia of the beam | The damping coefficients of strain velocity | ||
Length of the beam | The damping coefficients of rotational velocity | ||
Damping ratio | |||
Subscript | Meaning | superscript | Meaning |
1 | Substructure | Per unit length | |
2 | superstructure | ||
iso | Isolation layer |
2. Establishment of dynamic analysis model
2.1. Basic assumptions
Based on the theory of distributed parameter system, the mass, stiffness and damping of the substructure, the isolation layer and the superstructure of interlayer isolation structure are regarded as the uniformly distributed parameters,
It is also assumed that:
(1) The rigidity of the floor is infinite in the plane;
(2) The axial deformation of each component is ignored;
(3) The torsional deformation of the structure is ignored.
2.2. Establishment of analysis model
Based on Timoshenko beam theory and considering its shear deformation and bending deformation, the interlayer isolation structure is simplified as a cantilever beam, and the mass, stiffness and damping of each substructure are uniformly distributed along the axis. Its equivalent mechanical model is shown in Fig. 1. Among them, , , , , , are the equivalent line mass, equivalent bending stiffness and equivalent shear stiffness of the superstructure and substructure respectively; , are the equivalent mass and equivalent shear stiffness of the isolation layer respectively. When the interlayer isolation structure is determined, all the above parameters can be determined.
Fig. 1Simplified equivalent mechanical model of interlayer isolation structure
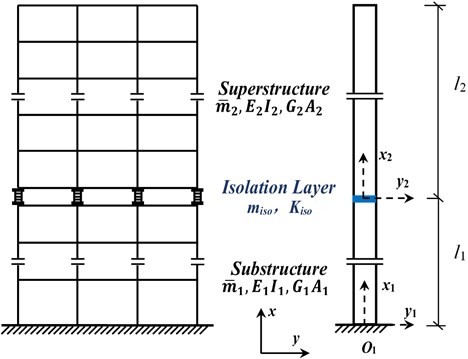
Fig. 2Stress analysis of micro element of the beam
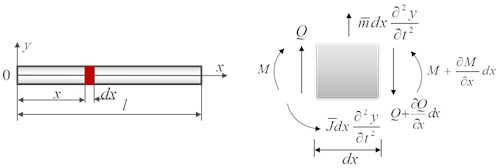
In the case of linear elasticity, for the equivalent mechanical model of interlayer isolation structure as shown in Fig. 1, take the micro segment for stress analysis, as shown in Fig. 2, and the free vibration equation of the structure can be obtained as Eq. (1), which has the same form as Timoshenko Equation [19] of the beam with constant cross section:
where, is the cross-sectional area of the beam, is the length of the beam, and are the bending stiffness and shear stiffness of the beam respectively, are the line mass of the beam, and is the moment of inertia of the beam to the neutral axis per unit length, is the length of the beam and is the vibration displacement of the beam. Neglect the influence of the moment of inertia of the section according to the existing research [29], which is means 0. Then Eq. (1) can be simplified and written as follows:
where is the displacement function;is the first partial derivative of displacement to time and is the first partial derivative of displacement to coordinate .
3. Solution of structural natural vibration characteristics
The local coordinate system (1, 2) and the overall coordinate system of the superstructure and substructure are established respectively, as shown in Fig. 1. The solution of Eq. (2) is expressed in the form of separation of variables:
where, is the natural frequency of the structure and is the mode function of the structure.
Substituting Eq. (3) into Eq. (2), we can get:
The parameter and are introduced, so that:
The general solution of Eq. (5) is:
where, , , , are coefficients that determine the vibration amplitude of the structure and , .
In the local coordinate system, combined with Eq. (6) the boundary and continuity conditions of each substructure of the interlayer isolation structure are given respectively.
At the bottom of the structure, where 0, the displacement and the angle are both zero. The specific boundary conditions can be expressed as follows:
At the top of the structure, where , the shear force and the bending moment are both zero. The specific boundary conditions can be expressed as follows:
At the isolation layer, where and 0, the displacement , the angle , the shear force and the bending moment are continuous. The specific boundary conditions can be expressed as follows:
In Eq. (12-14), and are the modal functions of the substructure and superstructure respectively, and the solutions are as follows:
where:
By substituting Eq. (15-16) into Eq. (7-14) respectively, eight equations about coefficient ( 1, 2; 1, 2, 3, 4) are obtained. The above 8 equations s are combined into a system of equations and can be written in matrix form:
where, , [] is determined coefficient matrix of equations about unknown []. In order to make Eq. (17) have solutions, it is required that 0, and the natural frequency of the structure can be obtained by solving it; if the frequency is substituted into Eq. (17), the coefficient ( 1, 2; 1, 2, 3, 4) can be obtained, that is, the mode function corresponding to can be obtained, thus the mode of the structure can be obtained.
4. Seismic response solution
Betti’s law is applied to the above distributed parameter system model, that is, the work done by the inertial force of the -th mode on the -th mode displacement is equal to the work done by the inertial force of the -th mode on the -th mode displacement. It is easy to obtain the first orthogonal condition of interlayer isolation structure:
The response of the -th order modes of the superstructure and substructure are respectively (the -th order modes are similar):
Eq. (19-20) are substituted into the equations of motion of the superstructure and substructure and Eq. (11-14), respectively:
Operate Eq. (20-23) as follows: Eq. (20)× is integrated on [0, ]; Eq. (21)× is integrated on [0, ]; Eq. (22)×; Eq. (23)×. The above four equations are added into one, and the first orthogonal condition is substituted into it, then the second orthogonal condition of interlayer isolation structure is obtained:
Under the action of earthquake, the equations of motion of the damping system of the superstructure and substructure and the isolation layer are as follows:
where, is the acceleration of ground motion, and are the damping coefficients of horizontal velocity and strain velocity respectively. If the superstructure and substructure have the same damping characteristics, then , . and are damping coefficients of horizontal velocity and rotational velocity of isolation layer respectively. Assuming that the structural damping is expressed as Rayleigh damping [29], that is to say, the damping effect is directly proportional to the structural mass and stiffness, then: , , ,
Use the following formula to change the geometric coordinates into regular coordinates:
Eq. (30) is substituted into Eq. (26-29), Because the amplitude satisfies the motion equations of the superstructure and substructure and the isolation layer with damping effect at the same time, the four formulas can be added. Using the first and second orthogonal conditions, the sum formula after treatment is simplified:
where:
By introducing the damping ratio of the -th mode , we can get:
The above formula can be solved by selecting appropriate seismic excitation. Then, the solution results are substituted into Eq. (29), and the dynamic response of the superstructure and substructure of the interlayer isolation structure can be obtained by the mode superposition method. The dynamic response of the whole system is obtained by simply assembling the results of the superstructure and substructure.
5. Structural calculation example and model establishment
In order to verify the correctness of the distributed parameter system model and the corresponding solution method based on Timoshenko beam theory, a 10-story interlayer isolation structure is designed and taken as an example, as shown in Fig. 3. The semi analytical method (SAM), and the ETABS finite element software simulation (FESE) are separately used to solve the seismic response of the example. In the structural design of this paper, the seismic fortification intensity is 8 degrees, the site category is three, and the design earthquake group is the second group.
Fig. 3Model design of the interlayer isolation structure
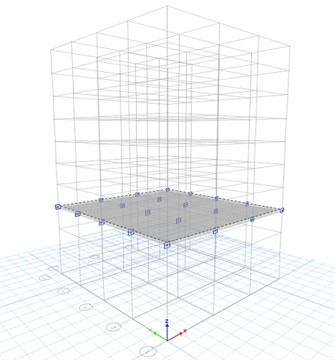
a) Three dimensional diagram of the model
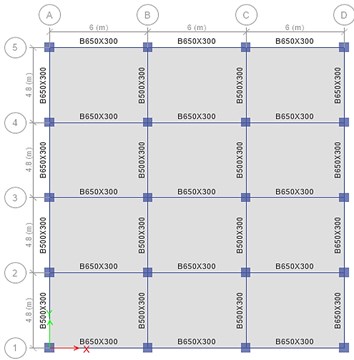
b) Component distribution of the model
The non-isolation floor of the structure is designed to have 10 floors in total, the bottom floor is 3.6 m high and the rest each floor is 3.0 m high; the floor slab is 120 mm thick, the column section is 600 mm×600 mm, the beam section is 650 mm×300 mm and 550 mm×300 mm respectively; the concrete strength grade of each component is C30. The isolation layer is located between the 3-4 floors of the structure, and the floor of the isolation layer is 180 mm thick. According to the relevant provisions of code for seismic design of buildings (GB50011-2010) [30], 20 LRB600 and LRB500 lead-rubber bearings are selected. The finite element model is shown in Fig. 3.
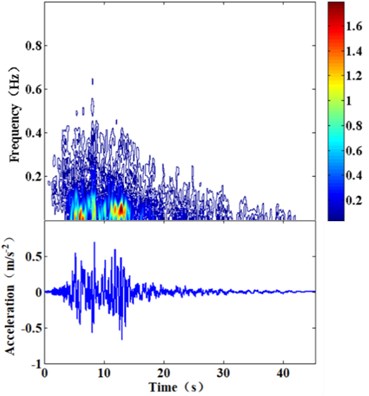
When the story isolation structure with 10 stories and one isolation story is designed in ETABS software, the floor mass, stiffness, damping ratio and other data of the structure can be derived through the software, and the corresponding linear mass and stiffness can be obtained by dividing the concentrated mass stiffness by the floor height. The distribution mass of the superstructure and substructure is 7.54×10⁴ kg/m, the equivalent bending stiffness is 1.05×10¹¹ N·m2, and the equivalent shear stiffness is 9.0×10¹⁰ N. The total mass of the isolation layer is 2.15×10⁵ kg, the total shear stiffness is 2.37×10⁷ N/m, and the equivalent moment of inertia of isolation layer is 12196 kg·m2. The damping ratio of the superstructure and substructure is 0.05 and the isolation layer’s is 0.15. The seismic excitation is recorded by Hector Mine (1999) seismic station (referred to as Hector Mine wave). The peak amplitude of acceleration of seismic wave is adjusted to 0.7 m/s2, as shown in Fig. 4.
Fig. 4The seismic wave of Hector Mine
6. Results and discussion
6.1. Structural natural vibration characteristics and response analysis
6.1.1. Mode analysis
Fig. 5 shows the structural vibration mode. It can be observed that there is a sudden change in the isolation layer in the vibration mode of each stage, and vibration modes of the rest part of the structure change evenly. That is to say, the deformation of the structure is mainly concentrated in the isolation layer, which conforms to the vibration law of the interlayer isolation structure. The main period of the isolated structure is 2.529 s, which is 2.31 times of the main period of the corresponding non-isolated structure of 1.097 s, indicating that the design of interlayer isolation effectively extends the period of the structure and has a good isolation effect.
6.1.2. Periodic comparative analysis
The semi-analytical method was used to calculate the structural natural vibration period, and the results were compared with the ETABS finite element simulation results.
Fig. 5First three mode shapes
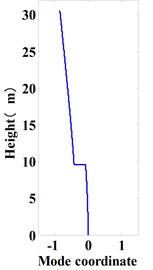
a) 1st mode shape
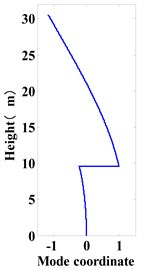
b) 2nd mode shape
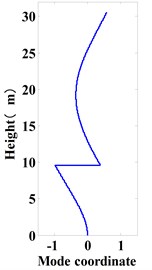
c) 3rd mode shape
Table 2Period comparison of interlayer isolation structure
Mode (s) | (s) | |
FESE | SAM | |
1 | 2.529 | 2.5284 |
2 | 0.526 | 0.6826 |
It is proved that the method of considering the shear deformation and using the distributed parameter theory to establish the equivalent model of the interlayer isolation structure, and using the semi-analytical method in this paper to solve the structural natural vibration characteristics is correct and effective. The comparison of the first two natural vibration periods of the structure is shown in Table 2.
It is found that the second-order periodic error obtained by semi-analytical method is large. The main reason is that the structure is equivalent to a cantilever beam at the beginning of model establishment and the stiffness of the beam model is estimated by the stiffness of the combined columns, which results in the smaller equivalent bending stiffness and shear stiffness of the structure and makes the whole period of each order larger. In addition, the smaller damping equivalence of the model for the isolation layer will also make the periodic calculation result larger.
6.1.3. Comparison of top layer’s responses
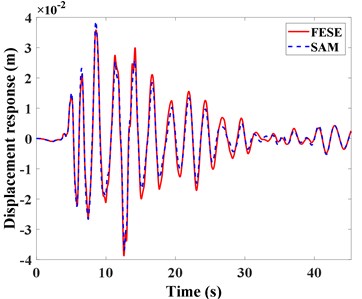
The acceleration and displacement response of the top layer of the structure by SAM and FESE. Results are compared and analyzed, as shown in Fig. 6. It can be found that the change trends of acceleration and displacement time history curve are the same, and the curves are in good agreement as well. Through simple analysis, the absolute error of top acceleration peak value is 16.26 %, and the absolute error of displacement peak value is 8.49 %. The results further prove that the model and solution method are effective and have good accuracy.
The response of the top layer of the structure calculated by SAM is slightly enlarged in 5-8 s, and the displacement response is advanced after 18 s. The reason is that when SAM is used to solve the structural period, the second-order period has more errors than the first-order period, which is larger than the finite element simulation results, making the top layer response of the structure enlarged. When using the FESE method to calculate the structural response, more modes are considered in order to be closer to the actual situation, but the SAM does not consider higher-order modes due to the calculation efficiency. Thus the three times history curves are slightly different. But on the whole, the acceleration and displacement responses of the top layer obtained by this model are in good agreement with the finite element results.
Fig. 6Response comparison of the top layer
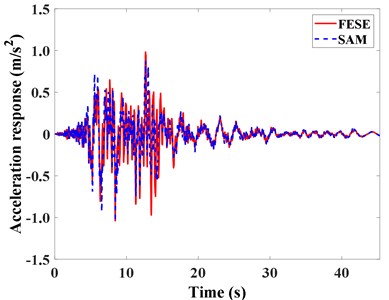
a) Acceleration response comparison
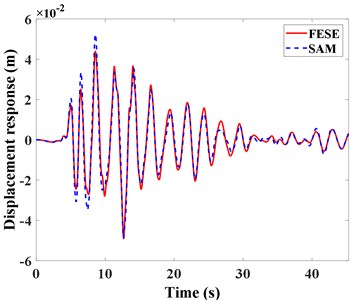
b) Displacement response comparison
6.1.4. Comparison of isolation layer’s responses
The acceleration and displacement response of the isolation layer of the structure by SAM and FESE are compared and analyzed as shown in Fig. 7. It can be found that the change trend of acceleration and displacement time history curve of the isolation layer is consistent, which is in good agreement.
After 12.5 s, the acceleration and displacement response of the isolation layer by SAM are amplified. In order to explain this, the frequency spectrum of the Hector Mine seismic wave is analyzed in Fig. 4. At 12.5 s, the seismic acceleration reaches the peak, and the components of the seismic wave with a period of 0.5 s account for a large proportion. The second-order period of the finite element simulation structure is 0.526 s, the period is close, the structure resonance occurs, the response increases, and the acceleration response increase is greater than the speed response increase. The second-order period calculated by the semi analytical method is 0.6826 s. Because of the error, the resonance phenomenon is not obvious. Compared with the response of the top layer of the structure, there is no response amplification phenomenon, which is considered to be due to the filtering effect of the isolation layer. The large deformation of the isolation layer results in the absorption of seismic energy, which leads to the reduction of the low frequency wave components and the reduction of the structural response. Therefore, the structure can have the function of isolation. Of course, the filtering effect of the isolation layer needs further verification.
Fig. 7Response comparison of the isolation layer
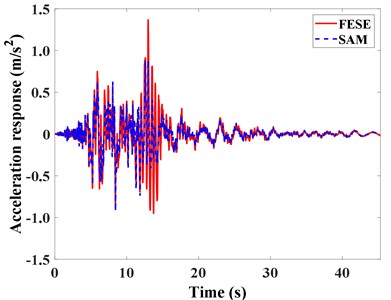
a) Acceleration response comparison
b) Displacement response comparison
Based on the above, it can be concluded that the distributed parameter system model of the interlayer isolation structure considering both shear deformation and bending deformation is effective, which can accurately reflect the natural vibration characteristics of the interlayer isolation structure, and can obtain more accurate structural time history response. By using the distributed parameter system and the algorithm in this paper, the response at any position of the structure can be obtained, which provides a more detailed reference for the engineering analysis of the structure, and enriches the theoretical system of the interlayer isolation structure.
6.2. Parameter analysis
6.2.1. Single parameter analysis
For the convenience of expression, order:
where, is the parameter before adjustment, and the value can be , , , , , , , ; is the corresponding adjusted parameter; is the adjusted proportion. is the response of the interlayer isolation structure corresponding to , and the values include the peak acceleration response of the superstructure , the peak displacement response of the superstructure , the peak acceleration response of the substructure , the peak displacement response of the substructure , and the deformation of the isolation layer ; is the response of the corresponding non-isolated structure; is the corresponding response ratio of isolated structure and non-isolated structure.
(1) Parameters of the superstructure.
The distributed mass, stiffness and damping ratio of superstructure are adjusted respectively to study the response of the superstructure and substructure and the deformation of the isolation layer. The results are shown in Fig. 8.
Fig. 8Influence curves of the superstructure parameters on structure response
a) Distributed mass
b) Bending stiffness
c) Damping ratio
In Fig. 8(a), the adjustment ratio of the superstructure mass is 0.1-15. It is found that when the mass of the superstructure of the interlayer isolation structure is smaller, the ratio is greater than 1, which means the structure has obvious response amplification phenomenon. And with the increase of the superstructure mass, the response ratio decreases and the isolation effect is enhanced. In Fig. 8(b), with the increase of the bending stiffness of the superstructure, the acceleration response peak ratios of the superstructure and the substructure increases and decreases, and the amplification phenomenon of the substructure response disappears. In Fig. 8(c), increasing the damping of the superstructure increases the displacement response peak and the acceleration response peak of the substructure, which may cause the response amplification of the superstructure and substructure at the same time. In a word, the displacement response of the superstructure is most sensitive to the change of the mass of the superstructure, and the amplification of the response of the substructure can be eliminated by adjusting the bending stiffness of the superstructure.
In addition, the deformation of the isolation layer can be reduced by increasing the damping ratio of the superstructure. In practical engineering application, the isolation layer is the weak layer of the interlayer isolation structure, and reducing its deformation will reduce the overturning moment of the superstructure, reduce the overall - effect of the structure, and make the structure safer. Thus the deformation of the isolation layer should be controlled.
(2) Parameters of the substructure.
Fig. 9Influence curves of the substructure parameters on structure response
a) Distributed mass
b) Bending stiffness
c) Damping ratio
The distributed mass, stiffness and damping ratio of the substructure are adjusted respectively and the results are shown in Fig. 9. It can be concluded that the acceleration response of the substructure is more sensitive to the change of the mass of the substructure. If the value is too large, the acceleration response of the substructure will be amplified. With the increase of the bending stiffness of the substructure, the acceleration response of the superstructure increases continuously. Increasing the damping ratio of the substructure will significantly reduce the acceleration response of the substructure, but increase the response of the superstructure. Therefore, increasing the damping ratio of the substructure is one of the effective methods to avoid the acceleration amplification of the substructure, and there is an optimal to make the best isolation effect.
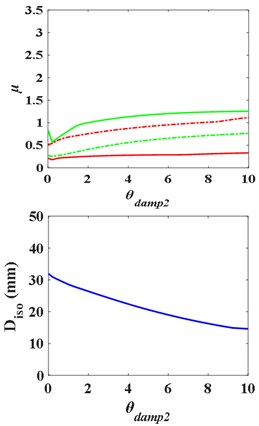
(3) Parameters of the isolation layer.
The mass, stiffness and damping ratio of the isolation layer are adjusted respectively to study the response of the superstructure and substructure and the deformation of the isolation layer. The results are shown in Fig. 10. The conclusions are as follows: too large mass of isolation layer will enlarge the acceleration response of substructure, but has little effect on the deformation of isolation layer. The larger the shear stiffness of the isolation layer is, the smaller the deformation of the isolation layer is. However, the larger the stiffness of the isolation layer is, the larger the response of the substructure will be. In Fig. 10, increasing the damping ratio of the isolation layer can effectively reduce the response of the structure, enhance the isolation effect, and effectively reduce the deformation of the isolation layer as well, which make the structure safer. It explains that in the practical application of interlayer isolation structure, damping devices are often added to the isolation layer to increase the damping ratio of the isolation layer, so as to ensure the safety of the structure and optimize the isolation effect.
Fig. 10Influence curves of the isolation layer parameters on structure response
a) Distributed mass
b) Bending stiffness
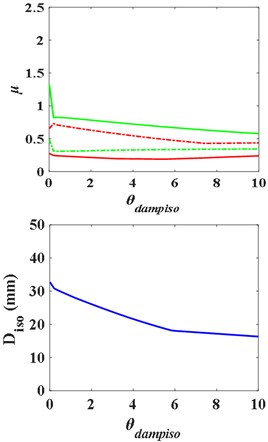
c) Damping ratio
6.2.2. Multi parameter analysis
According to the previous analysis, the response of interlayer isolation structure is more sensitive to the change of mass and bending stiffness of substructures. The mass and stiffness of substructure are not isolated for a building whose shape or function is determined. For reinforced concrete frame structure, is linear with when the shape is determined. Therefore, this section will study the seismic response of the structure with the mass and stiffness changing at the same time. Make:
where is the total mass of the structure, is the mass of the substructure after adjustment, is the adjustment proportion, is the corresponding response ratio of the isolated structure and non-isolated structure. The isolation layer is located between -th and ()-th layers of the structure.
With the parameter varies from 0 to 1, the distributed parameter system model based on the FEM is used to calculate the structure responses when the isolation layer is located in different positions, and the corresponding comparison with the corresponding non-isolation structure is made to draw the response peak ratio curve and the isolation layer deformation curve.
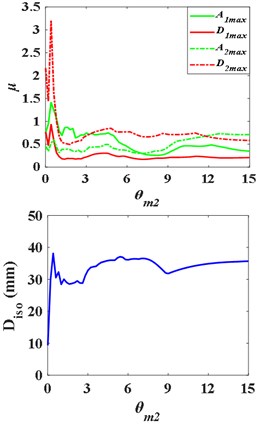
(1) Lower isolation layer ( 1, 2, 3).
Fig. 11Influence curves of the superstructure and the substructure mass on structural response with lower isolation layer
a) Distributed mass
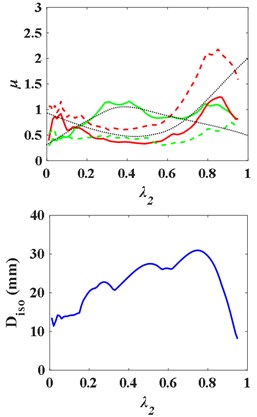
b) Bending stiffness
c) Damping ratio
When 1, the - curves and the - are as Fig. 11, and the natural frequency ratio of the superstructure and substructure is 0.0178. With the increase of the ratio of substructure mass to total structure mass , The -, -, and - curves first rise and then fall, presenting “^” shape, while the - curve first falls and then rises, presenting “v” shape. And the deformation curve of the isolation layer fluctuating rises and then falls. Therefore, there is a value of to make the isolation effect optimal and ensure the safety of the structure. When 2, 3, the curves change similarly.
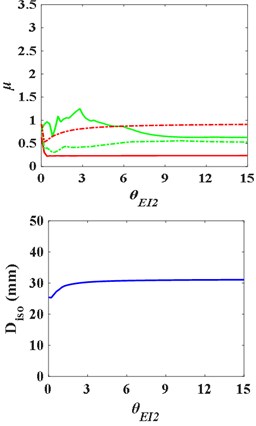
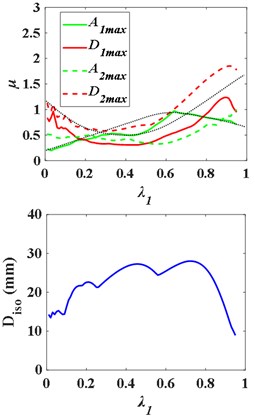
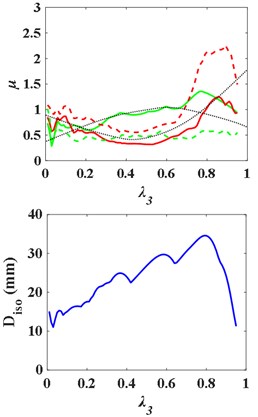
(2) Middle isolation layer ( 4, 5, 6).
Fig. 12Influence curves of the superstructure and the substructure mass on structural response with middle isolation layer
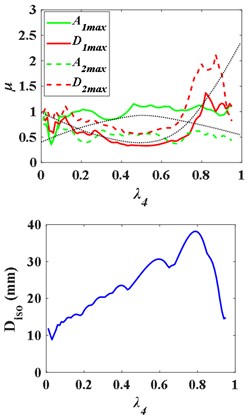
a) Distributed mass
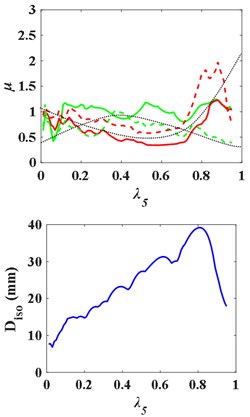
b) Bending stiffness
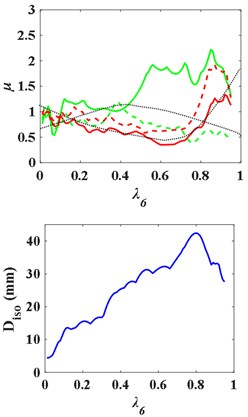
c) Damping ratio
When 4, the - curves and the - are as Fig. 12, and the natural frequency ratio of the superstructure and substructure is 0.4900. With the increase of , the - and - curves first rise and then fall, presenting “^” shape. But there is no obvious regular pattern of curve - and -. The - curve still presents “^” shape broadly. Similarly, there is an optimal and , as well.
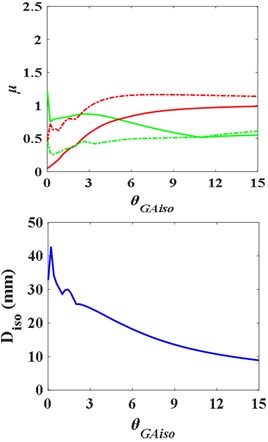
(3) Upper isolation layer ( 7, 8, 9).
Fig. 13Influence curves of the superstructure and the substructure mass on structural response with upper isolation layer

a) Distributed mass
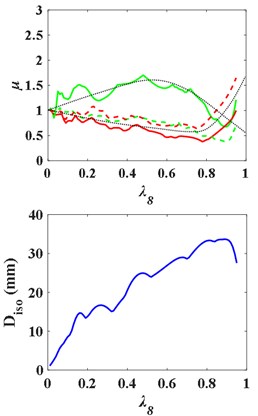
b) Bending stiffness
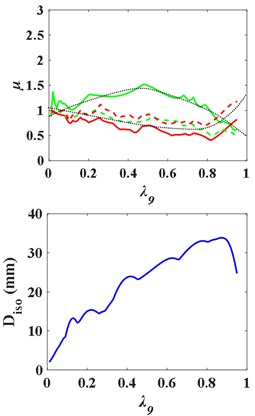
c) Damping ratio
When the isolation layer is respectively placed on the 7th, 8th and 9th floor, the - curves and the - are as Fig. 13. With the increase of the ratio of substructure mass to total structure mass , the - curve first rises and then falls, presenting “^” shape, while the -, - and -, curves first fall and then rise, presenting “v” shape. In the upper isolated structures, by changing the mass of the substructure and the superstructure, the acceleration response of the substructure is always enlarged compared with that of the non-isolated structure, so that the substructure is in a more dangerous state. The - curves still present “^” shape broadly.
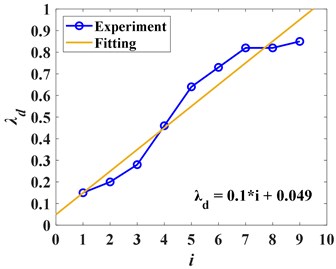
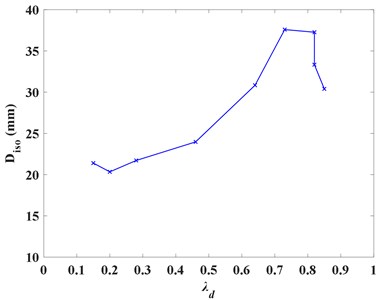
It can be found that when the isolation layer is located in different positions of the structure, the response of the superstructure and substructure varies with the change of mass ratio , and there will be an optimal to make the isolation effect the best, as shown in Table 3. And the – curve is as Fig. 14.
Table 3Comparison of optimal isolation effect when the isolation located differently
Isolation layer’s location | (mm) | |||||||
Lower isolation layer | 1 | 0.0178 | 0.15 | 0.6742 | 0.4606 | 0.4606 | 0.3807 | 21.40 |
2 | 0.0756 | 0.20 | 0.7635 | 0.4475 | 0.5467 | 0.7635 | 20.34 | |
3 | 0.2090 | 0.28 | 0.6984 | 0.3995 | 0.4452 | 0.6984 | 21.72 | |
Middle isolation layer | 4 | 0.4900 | 0.46 | 0.5734 | 0.5734 | 0.3397 | 1.152 | 23.97 |
5 | 1.0816 | 0.64 | 0.6457 | 0.6457 | 0.3575 | 0.9758 | 30.84 | |
6 | 2.4025 | 0.73 | 0.7099 | 0.4840 | 0.4840 | 1.902 | 37.59 | |
Upper isolation layer | 7 | 5.7600 | 0.82 | 1.0770 | 0.3713 | 0.5814 | 1.0770 | 37.27 |
8 | 16.8100 | 0.82 | 0.8642 | 0.4783 | 0.4573 | 0.8642 | 33.33 | |
9 | 84.6400 | 0.85 | 0.8629 | 0.5535 | 0.4880 | 0.8629 | 30.40 | |
The curve can be fitted as 0.1+0.049. The fitting residual norm is 0.19442, which shows that there is a linear relationship between the optimal mass ratio and the location of isolation layer in regular isolated structure. This means that in the design of irregular structure, such as large chassis tower structure, we can refer to the optimal mass ratio of the corresponding regular structure to adjust the structural mass and story height, so as to make the isolation effect of the isolation structure better.
Fig. 14Curve of optimal mass ratio with changing of the position of isolation layer
When is equal to in different , the corresponding peak response ratio of the superstructure and substructure and the deformation of the isolation layer can be obtained, and draw them into curves as Fig. 15. In the form of lower isolation, the response ratio is less than 1, and the deformation of isolation layer is small, so the isolation effect is the best; in the form of middle isolation, the acceleration response of the substructure is amplified, and the deformation of isolation layer is increased; in the form of upper isolation, the response ratio close to 1 and the deformation of isolation layer is more than 30 mm. Therefore, for the isolation effect, the lower isolation is better than the upper isolation, and the middle isolation should be avoided as far as possible, and the upper isolation should be designed to avoid excessive deformation of the isolation layer.
Fig. 15Structural responses at different optimal mass ratio
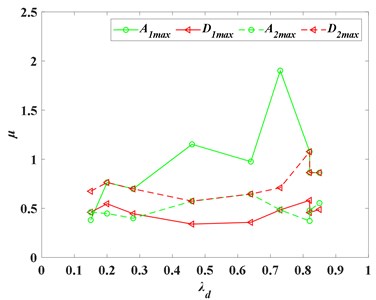
a) The responses of the substructures
b) The deformation of the isolation layer
7. Conclusions
1) In this paper, based on certain assumptions, a distributed parameter system model considering both bending deformation and shear deformation is established, and its dynamic equation is derived. And the orthogonal conditions of mode shape are derived by Betti’s law, which is used to obtain the equivalent vibration equation in single mode. Finally, the calculation method of the response of the interlayer isolation structure is obtained by the mode superposition method.
2) Comparing the results of SAM and FESE, the error of the peak value of acceleration and displacement response of the natural vibration period and the top layer and isolation layer of the structure is less than 10 %, which can prove the correctness of the model and calculation method.
3) The existence of the isolation layer can effectively reduce the response of the superstructure, and the isolation effect is good; but the response of the substructure is amplified. With the increase of the mass and stiffness of the superstructure, the mass of the substructure and the damping of the isolation layer can effectively reduce the amplification. In regular interlayer isolation structure, the lower isolation form can get better isolation effect and the optimal frequency ratio of the superstructure and substructure increases with the rising of isolation layer position.
4) In order to further reduce the error, the future research will be based on this paper to optimize the parameters, simplify the calculation process, and use this method to study the impact of the isolation layer of the interlayer isolation structure on the superstructure and substructure, so that the method can be more effectively applied to research and practical engineering.
References
-
Yadao Qiuyan et al., “Precautions for construction of interlayer isolation structure,” (in Japanese), Construction, Vol. 390, pp. 72–77, 1998.
-
Murakami K., Ozaki H., and Teramoto T., “Design and analysis of a building with the middle-story isolation structural system,” in Proceedings of 12th WCEE, 2000.
-
Toshiyuki Sueoka, Shingo Torii, and Yasuhiro Tsuneki, “The application of response control design using middle-story isolation system to high-rise building,” in Proeeedings of 13th WCEE Vallcouver, Vol. 3457, Jan. 2004.
-
R. Villaverde, “Roof isolation system to reduce the seismic response of buildings: a preliminary assessment,” Earthquake Spectra, Vol. 14, No. 3, pp. 521–532, Aug. 1998, https://doi.org/10.1193/1.1586013
-
R. Villaverde, “Aseismic roof isolation system: feasibility study with 13-story building,” Journal of Structural Engineering, Vol. 128, No. 2, pp. 188–196, Feb. 2002, https://doi.org/10.1061/(asce)0733-9445(2002)128:2(188)
-
Roberto Villaverde and Gilberto Mosqueda, “Aseismic roof isolation system: analytic and shake table studies,” Earthquake Engineering and Structural Dynamics, Vol. 28, No. 3, pp. 217–234, Feb. 1999, https://doi.org/10.1002/(sici)1096-9845(199903)28:3
-
Xu Zhonggen, Zhou Fulin, and Qiu Xiangquan, “Structural dynamic analysis of Shantou Museum,” (in Chinese), World Earthquake Engineering, Vol. 12, No. 2, pp. 33–36, 1996.
-
Jiang Chunqin, “Study on seismic behavior of isolated buildings with intermediate floors,” (in Chinese), National Taiwan University, Taiwan, 2007.
-
Fu-Lin Z. et al., “Research and application of seismic isolation system for building structures,” Journal of Architecture and Civil Engineering, Vol. 2, pp. 1–8, 2006.
-
K. Tian, W. Liu, D. Feng, and Q. Yang, “Dynamic characteristic analysis and shaking table test for a curved surface isolated structure,” Engineering Structures, Vol. 203, p. 109847, Jan. 2020, https://doi.org/10.1016/j.engstruct.2019.109847
-
A. Di Matteo, C. Masnata, and A. Pirrotta, “Simplified analytical solution for the optimal design of tuned mass damper inerter for base isolated structures,” Mechanical Systems and Signal Processing, Vol. 134, p. 106337, Dec. 2019, https://doi.org/10.1016/j.ymssp.2019.106337
-
Yin Chuanyin et al., “Design comparison of the seismic design of base-isolated RC frames using two Chinese codes,” (in Chinese), Engineering Mechanics, Vol. 36, No. 9, pp. 197–204, 2019.
-
D. Fang, Y. Du, C. Liu, and Y. Deng, “Analysis for displacement response characteristics of complex multi-layer base-isolated structure under near-field ground motion,” (in Chinese), Journal of Southwest Jiaotong University, Vol. 55, No. 1, Feb. 2020, https://doi.org/10.3969/j.issn.0258-2724.20181038
-
Dang Yu and Tian Hongtu., “Analysis of calculation accuracy and improvement of real mode superposition response spectrum method of isolated structures,” (in Chinese), Building Structure, Vol. 49, No. 16, pp. 120–126, 2019.
-
Zhou Fulin, Zhang Ying, and Tan Ping, “Theoretical study on story isolation system,” (in Chinese), Journal of Civil Engineering, Vol. 42, No. 8, pp. 1–8, 2009.
-
Cao Jialiang, Shi Weixing, and Liu Wenguang, “Sensitivity of dynamic response and characteristics of isolated structure to calculation model parameters,” (in Chinese), Engineering Mechanics, Vol. 28, No. 8, pp. 168–176, 2011.
-
He Dongdong, Miao Qisong, and Li Wenfeng, “Parameter optimization design of high position story isolated structure subjected to earthquake,” (in Chinese), Journal of Vibration Engineering, Vol. 26, No. 6, pp. 895–900, 2013.
-
Qi Ai, Lin Yunteng, and Zheng Guochen, “Research on working mechanism of interlayer isolation structure,” (in Chinese), Earthquake Engineering and Engineering Vibration, Vol. 2006, No. 4, pp. 239–243, 2006.
-
Wang Guangyuan, Vibration of Building Structure. (in Chinese), Beijing: Science Press, 1978.
-
Li Luxian et al., “Study on physical essence of the Timoshenko beam theory and its relation with the Euler beam theory,” (in Chinese), Chinese Science: Technology Science, Vol. 48, No. 4, pp. 360–368, 2018.
-
Liu Liangkun et al., “The seismic response analysis of frame-shear wall structures based on Laplace transformation,” (in Chinese), Journal of Vibration Engineering, Vol. 30, No. 5, pp. 790–797, 2017.
-
Y.-C. Li, S.-Y. Liu, and Z.-G. Tang, “Two-time scale control of two manipulators handling flexible payload based on distributed parameter,” (in Chinese), Kongzhi yu Juece/Control and Decision, Vol. 27, No. 5, pp. 686–690+696, May 2012.
-
X. Cao and Y. Li, “Variable structure force control of flexible manipulator based on distributed parameter model,” (in Chinese), Control and Decision, Vol. 2008, No. 9, pp. 1035–1039, 2008.
-
Chen Yangyang et al., “A theoretical study on the horizontal dominant vibration mode of a girder bridge with tall piers,” (in Chinese), Vibration and Impact, Vol. 35, No. 12, pp. 13–21, 2016.
-
Chen Yangyang et al., “Semi-analytical method for time-history responses of single column and mass systems used to seismic isolated regular bridges,” (in Chinese), Earthquake Engineering and Engineering Vibration, Vol. 33, No. 3, pp. 183–191, 2013.
-
Du Yongfeng, Liu Yanhui, and Li Hui, “Semi-analytical solution of seismic response of serially isolated equipment and supporter,” (in Chinese), Journal of Mechanics, Vol. 41, No. 3, pp. 440–448, 2009.
-
Du Yongfeng, Liu Yanhui, and Li Hui, “Response of serial system of equipment and supporter under earthquake based on semi-analytical method,” (in Chinese), Journal of Computational Mechanics, Vol. 27, No. 2, pp. 225–231, 2010.
-
Song Xiao et al., “Analysis of parameters and aseismic properties of inter-story isolation system,” (in Chinese), Earthquake Engineering and Engineering Vibration, Vol. 38, No. 5, pp. 41–49, 2018.
-
R. Kraft and J. Peng Jin, Structural dynamics: Translated by Wang Guangyuan. (in Chinese), Beijing: Higher Education Press, 2006.
-
“Code for seismic design of buildings: GB50011-2010,” (in Chinese), China Architecture and Building Press, Beijing, 2010.
Cited by
About this article

The research is funded by the Project of Outstanding Youth Program of Natural Science Foundation of Ningxia [Grant No. 2021AAC05003] and Young Scholars in the West [Grant No. XAB2017AW09] and Natural Science Foundation of Ningxia [Grant No. 2019AAC03041] and The National Natural Science Foundation of China [Grant No. 51608283].
