Abstract
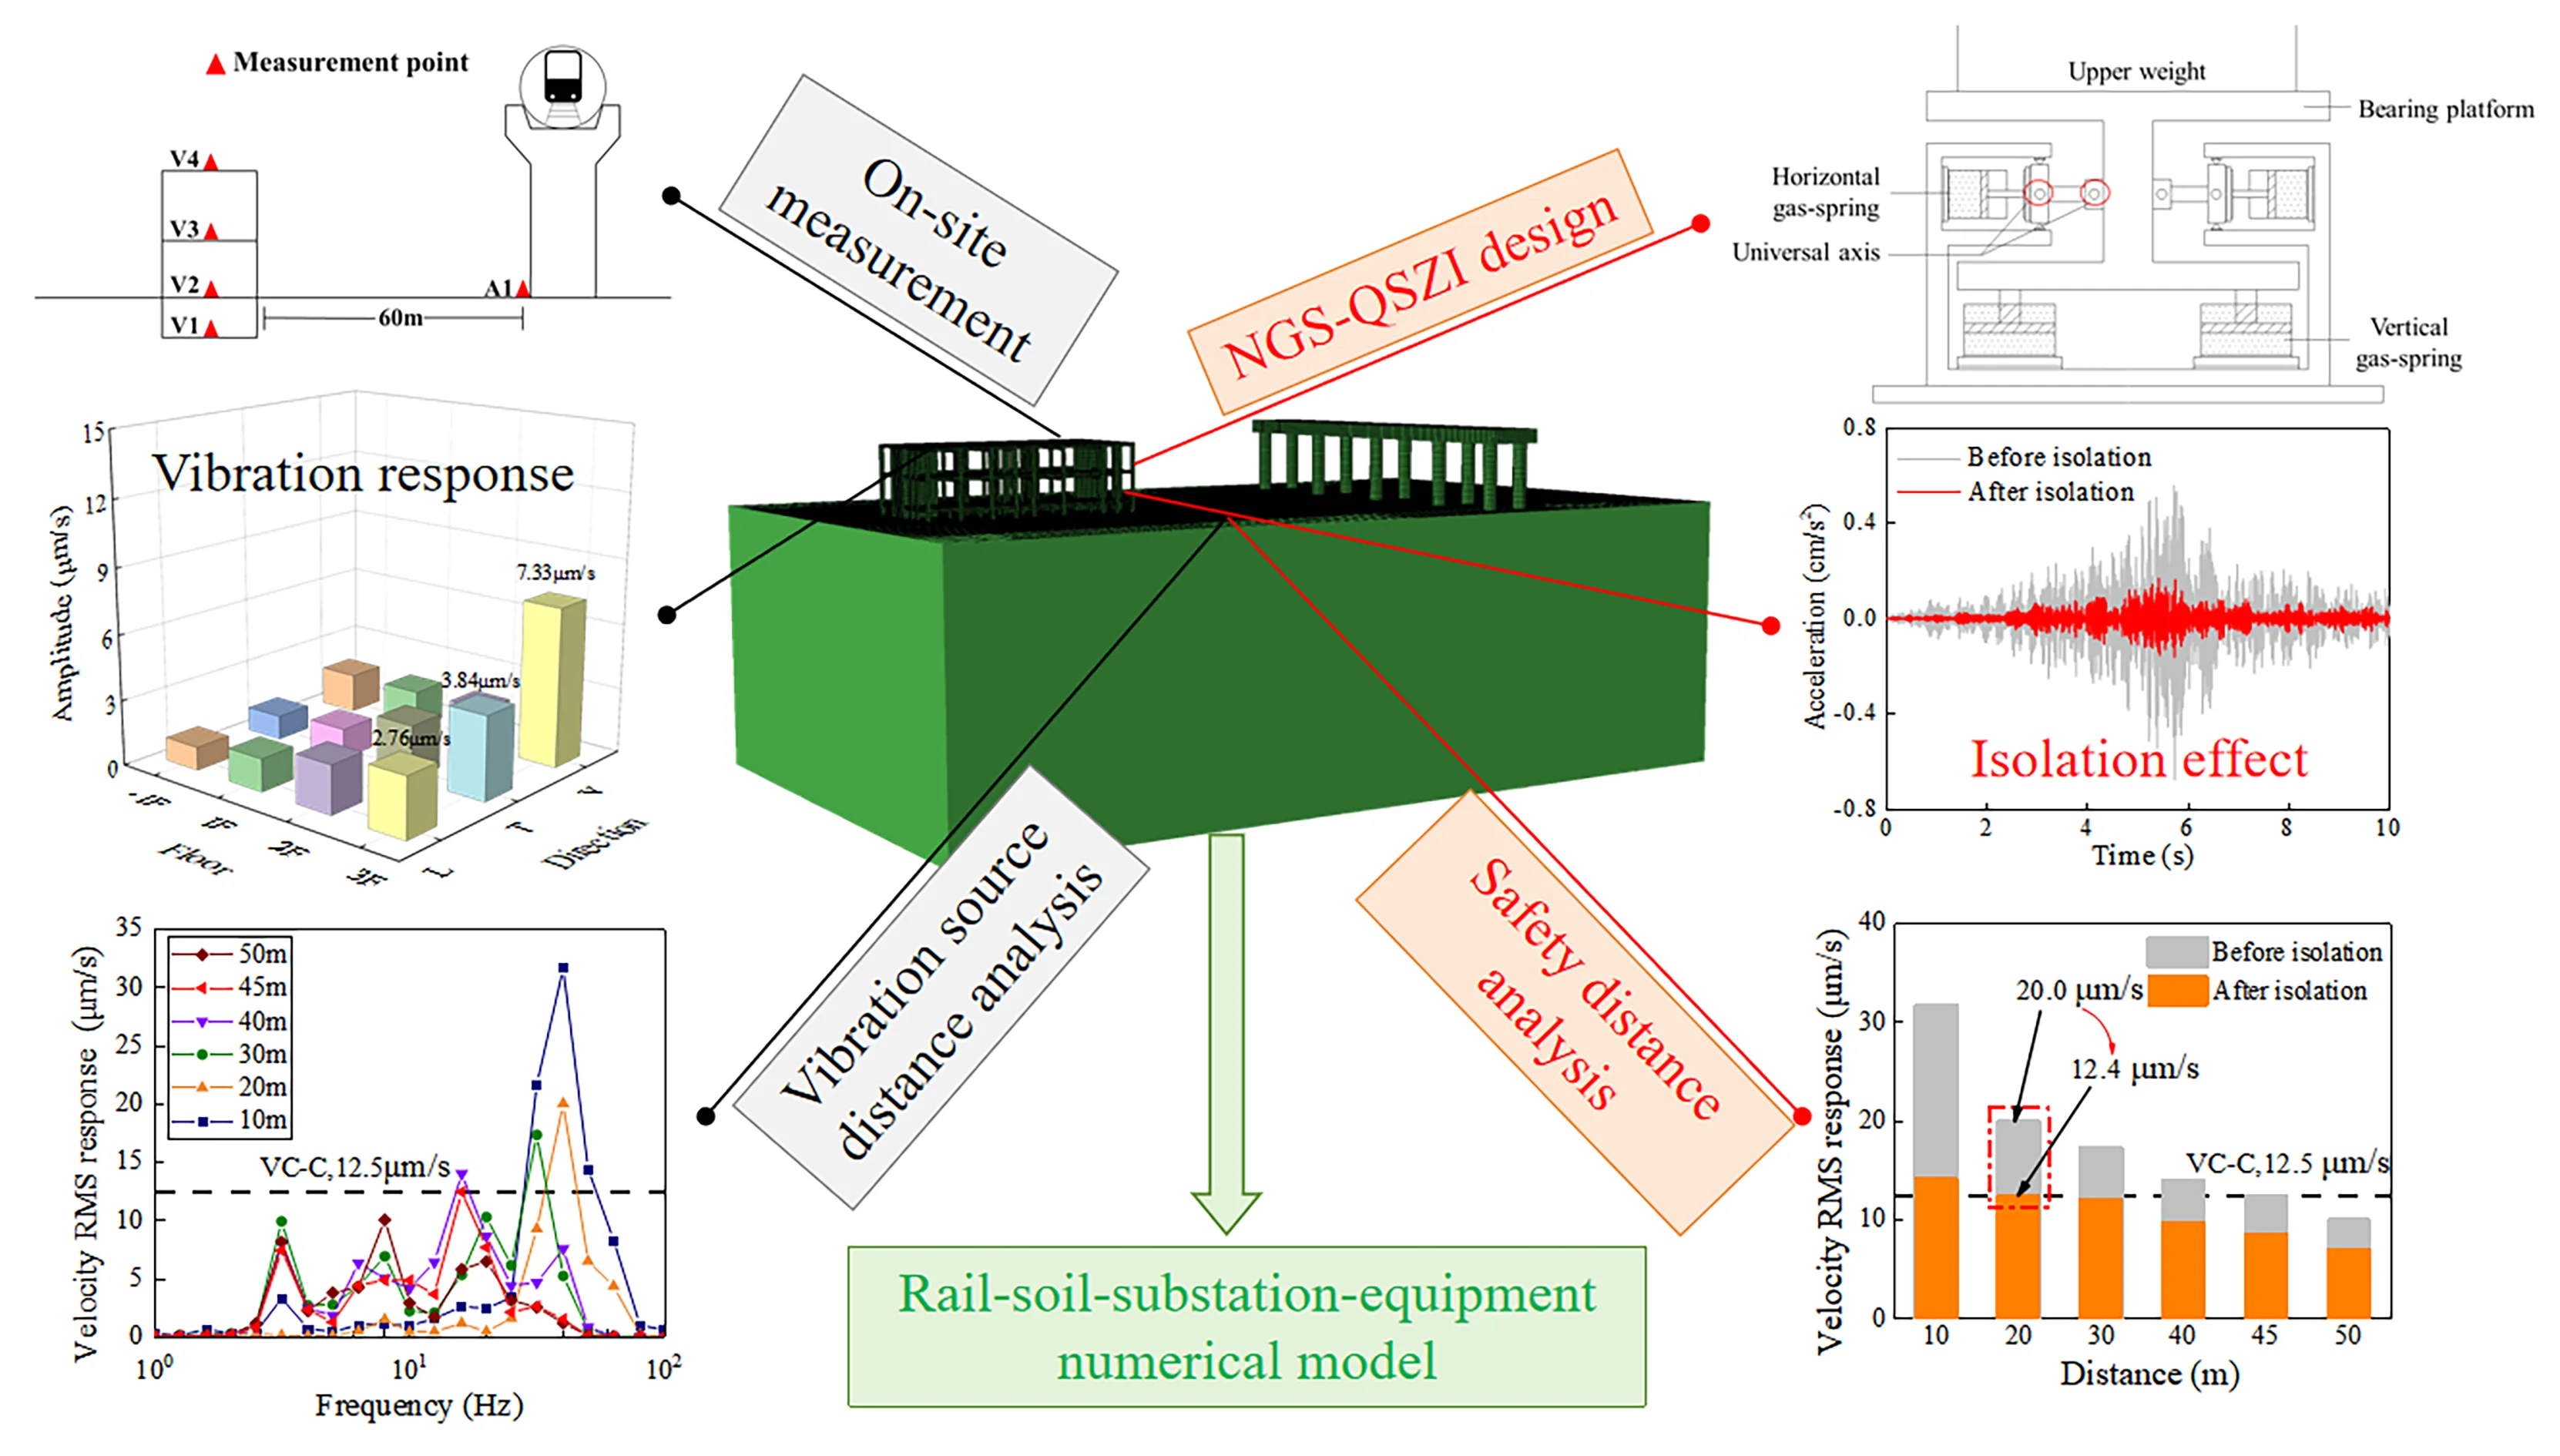
This study takes the indoor substation adjacent to the elevated bridge subway line as the engineering background, investigates the structural vibration response law of the substation induced by the operation of the subway line through on-site vibration measurement, and proposes a novel nonlinear gas-spring quasi-zero stiffness isolator (NGS-QZSI) is proposed to reduce the structural vertical vibration and further reduce the safety distance. The software ABAQUS is used to establish a structure-equipment coupling numerical analysis model considering soil-structure interaction, and its effectiveness and accuracy are validated based on the measured results. The structural vibration response analysis is carried out under different vibration source distances, and a nonlinear gas-spring quasi-zero stiffness isolator is proposed to be employed for substation structural vibration isolation. The research results show that the substation structure under subway load excitation is dominated by vertical vibration, and its vibration response increases gradually with the increase of floor level. When the substation structure is less than 45 m from the subway line, the structural response exceeds the safety limit (12.5 μm/s) of the VC-C standard. With the vibration isolator attached, the structural vibration response is significantly reduced, with the peak and root mean square response controlled by more than 70 %. Particularly, the safe distance of the substation from the subway line is reduced from 45 m to 20 m. Moreover, the frequency domain result analysis indicates that the proposed nonlinear vibration isolator can effectively control the low-frequency vibration of the structure.
Highlights
- Soil-structure-equipment model can capture the substation’s dynamic properties.
- A novel nonlinear gas-spring QSZI isolator is proposed.
- NGS-QSZI can effectively control the low-frequency vibration.
1. Introduction
With the development of economies around the world increasing, urbanization levels are increasing. This rapid growth in urban population has put immense pressure on urban transportation systems. In response, metros are gradually becoming the primary mode of transportation for residents [1]. As the construction of subway lines becomes denser, the vibrations generated by their operation inevitably affect adjacent buildings [2]. Urban indoor substations are usually constructed near subway lines, and the long-term subway vibrations pose a threat to the structural safety of substations and the normal operation of precision instruments indoors, resulting in a series of vibration problems.
Recently, numerous studies have been conducted by scholars both domestically and internationally to investigate the environmental impact of subway operations through field measurements and numerical simulations [3-5]. Breccolotti et al. [6] proposed a prediction method for railway vibration levels by combining field testing and numerical simulation. They successfully applied this method to assess the vibration of a railway line in Italy, and implemented vibration control measures to address excessive vibrations. Sanayei et al. [7] conducted on-site testing in building foundations and nearby open areas, effectively evaluating the safety of indoor precision equipment based on the analysis of the measured results and in conjunction with usability standards. Vogiatzis et al. [8] conducted a study on the vibration response of the environment caused by the Athens Metro, utilizing an optimized rail vibration prediction model. Through a three-dimensional finite element model, they examined the effectiveness of vibration mitigation measures, and validated them against vibration standards.
To mitigate the impact of subway vibrations on building structures, the use of vibration isolation technology can effectively reduce the transmission of vibration energy to the building structures [9]. Depending on the type of vibration isolation elements, vibration isolation devices can be categorized into linear and nonlinear types. Traditional linear vibration isolation devices can only function when the natural frequency of the isolation system is less than√2/2 times the excitation frequency. In order to broaden the isolation frequency band and enhance the isolation effectiveness against low-frequency vibrations, it is generally necessary to reduce the inherent frequency of the system by decreasing its stiffness. However, reducing the system’s stiffness will decrease the load-bearing capacity of the isolation system, which is detrimental to the stability of the isolation device. In response to this issue, researchers have conducted a series of studies on nonlinear isolation devices [10-12]. Among them, the quasi-zero stiffness isolation device, as a type of nonlinear isolation device, has a higher static stiffness and lower dynamic stiffness. It offers a wider isolation frequency band compared to traditional linear isolation devices, resulting in better isolation effectiveness against low-frequency vibrations. Currently, the traditional quasi-zero stiffness isolator has a low load-bearing capacity due to its positive stiffness structure. Once the device is manufactured, its load-bearing capacity cannot be adjusted according to the changes in the upper load, leading to the deviation of the isolation system from the static equilibrium position and significantly reducing the isolation effect.
As non-metallic elastic element, gas-springs exhibit nonlinear mechanical characteristics [13], possess high bearing capacity and relatively small deformation. Additionally, they can also adjust their own bearing capacity and stiffness by controlling the pressure inside the spring chamber, and are widely used in vibration reduction and isolation engineering in various fields such as construction, machinery, and transportation. This study introduces nonlinear gas-springs into vibration isolation systems, replacing traditional linear steel springs, and proposes a nonlinear gas-spring quasi-zero stiffness isolator (NGS-QZSI). Compared with the traditional quasi-zero stiffness vibration isolation device, the proposed nonlinear isolator has a higher bearing capacity and a wider vibration isolation band, which can effectively isolate the low-frequency vibration; moreover, the stiffness characteristics of the gas-spring isolator can be adjusted according to the quality of the superstructure by controlling the size of the gas pressure, which solves the problem of design parameter inconsistency of the vibration isolator in the practical engineering.
In this study, the vibration response of an indoor substation structure caused by subway operation is measured in on-site and its vibration response law is analyzed. A three-dimensional finite element model of track-soil-structure-equipment is established to conduct vibration response analysis at different source distances. A nonlinear gas-spring quasi-zero stiffness isolator is proposed, its mechanical properties are theoretically analyzed, and the isolator’s control effect is evaluated by comparing the vibration response with and without isolator. The corresponding research results can provide technical support and reference for the structural isolation of subsequent practical substation projects.
2. Structural vibration response measurement under subway excitation
2.1. Project overview
The indoor substation features a reinforced concrete frame structure, comprising one underground level (3.3 m high) and two above-ground levels (both 5.3 m high), the total height of building is 11.4 m. The specific layout is as follows: the underground level accommodates the cable area, the first above-ground level houses the high-voltage distribution equipment area where the main electrical equipment is stored, and the second above-ground level contains the secondary equipment room and the duty room. The substation foundation utilizes a raft foundation, with a base elevation of –4.34 m. The material parameters used for various components of the building are detailed in Table 1. The main structure of the substation has a plan dimension of 41.8 m×24 m. Approximately 60 m to the east of the substation is a section of elevated subway line, with each span of the viaduct measuring 8 meters, a bridge deck width of 12.6 m, a pier diameter of 0.8 m, and a height of 8 m.
Table 1Detailed information on the components and materials of the structure
Component | Concrete grade | Thickness of protective layer (mm) | Main reinforcement |
Column | C40 | 45 | HRB400 |
Beam | C40 | 45 | HRB400 |
Slab | C40 | 40/20 | HRB400 |
2.2. Design of measurement scheme
2.2.1. Vibration testing instruments and evaluation standards
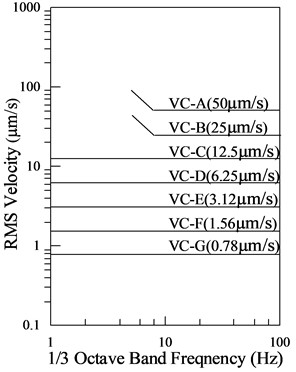
The current study employs the 2D001 magnetic-electric transducer and the DH5922D dynamic signal testing and analysis system. Prior to testing, each instrument is calibrated and parameterized with a sampling frequency of 500 Hz. The main technical specifications of the transducer are as follows: sensitivity of 18.4V/m·s-2 and a maximum range of 0.125 m/s. Due to the presence of precision equipment in indoor substation, this study adheres the control criteria for micro-vibration of precision instruments and equipment in Class C experimental buildings as specified in the internationally widely used VC standard for vibration of precision equipment (VC-C: 12.5 μm/s) [14]. This experiment collects the vibration velocity data of the structure as an evaluation index, as shown in Fig. 1.
Fig. 1International general vibration VC standard
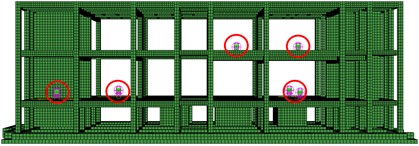
2.2.2. Layout of measurement points and arrangements
Two measurement groups are established to conduct vibration response tests at the subway vibration source and indoor floor. Measurement points will be set up at the elevated bridge piers of the subway to measure vibration acceleration, which is used to determine the accuracy of the subsequent finite element model loading. Four measurement points are placed indoors, at the basement, first, second, and top floors, to measure the vibration velocity at the midspan of each floor. The layout of the relevant measurement points is illustrated in Fig. 2, and the corresponding test conditions are presented in Table 2.
Fig. 2Layout of measuring points
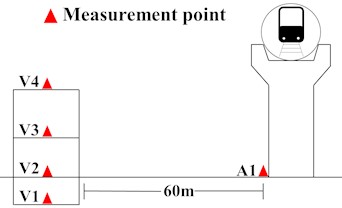
Table 2Vibration measurement arrangement
Measurement sequence | Measurement content |
Ⅰ | A1 measurement of three-dimensional acceleration |
Ⅱ | The vertical velocities V2, V3, and V4 are measured, while V1 measures the three-dimensional velocity. |
Ⅲ | The vertical velocities V1, V3, and V4 are measured, while V2 measures the three-dimensional velocity. |
Ⅳ | The vertical velocities V1, V2, and V4 are measured, while V3 measures the three-dimensional velocity. |
Ⅴ | The vertical velocities V1, V2, and V3 are measured, while V4 measures the three-dimensional velocity. |
2.3. Measurement results
Based on the vibration data measured in the indoor substation, the vibration velocity amplitude distribution of each floor under subway load in different directions is shown in Fig. 3. The results indicate that the vibration propagation law in the longitudinal track, vertical track, and vertical direction is the same, i.e., the vibration velocity slightly increases with the increase of the floor. The vertical vibration velocity response is the largest, and the maximum vibration response occurs at the top floor of the structure, reaching 7.33 μm/s. The VC-C level vibration velocity allowable limit is 12.5 μm/s. Currently, the vibration levels in the indoor substation are within the permissible range set by the VC-C standard, ensuring the safety of precision instruments indoors. The time history curve of vertical vibration velocity at the mid-span of the first and second floor slabs of the substation structure is shown in Fig. 4 (L: Longitudinal; T: Transverse; V: Vertical).
Fig. 3Velocity amplitude in three directions on each floor
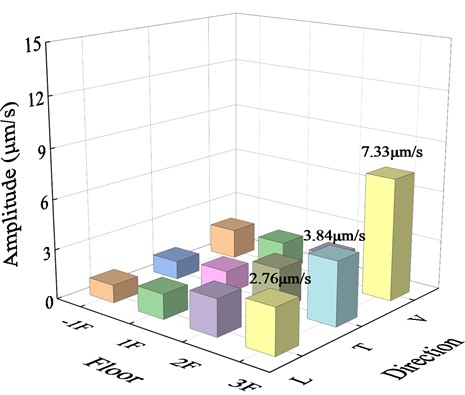
Fig. 4Typical vertical vibration velocity time history curve of floor
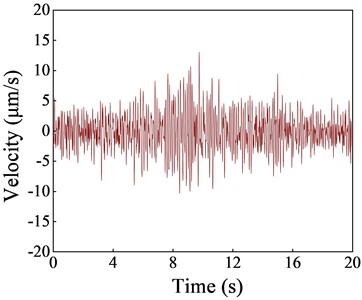
a) First floor
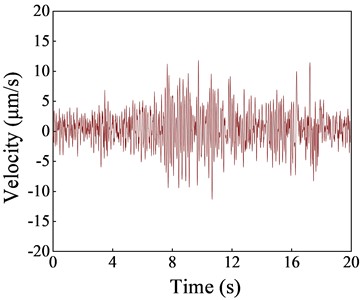
b) Second floor
3. Vibration response analysis of substation under subway load
3.1. Finite element model of rail-soil-substation-equipment
Based on the collected geological data, the soil at the site of the indoor substation and the subway viaduct is simplified into four layers according to the soil properties [15]. Each layer represents a major shear wave velocity range, and the main physical parameters of the soil layers are shown in Table 3.
Table 3Main physical parameters of soil layer
Soil layer | Thickness / m | Density / (kg·m-3) | Young’s modulus / MPa | Poisson’s ratio | Shear wave velocity / (m·s-1) |
Miscellaneous fill | 3.3 | 1980 | 191 | 0.36 | 203 |
Loess | 5.0 | 1800 | 50 | 0.3 | 250 |
Medium-fine sand | 2.5 | 1960 | 280 | 0.25 | 240 |
Silty clay | Infinity | 1990 | 268 | 0.35 | 216 |
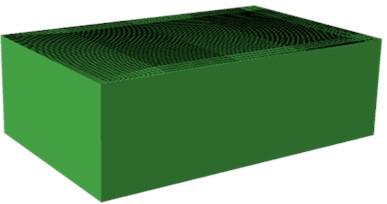
In the ABAQUS finite element model, the dimensions of the soil mass are set to 160 m × 100 m × 50 m. The soil model utilizes C3D8R solid elements for the calculation units, with a mesh size ranging from 0.3 to 1.0 m. Near the vibration source, the element size is set to 0.3 m, gradually increasing away from the source area. Infinite elements (CIN3D8) are used for the outermost elements of the model to simulate infinite boundary conditions. The soil model with the infinite element boundary set is depicted in Fig. 5.
Fig. 5Soil finite element model
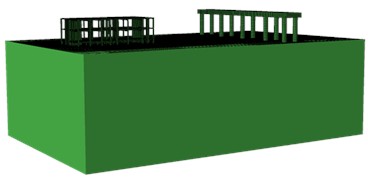
The three-dimensional finite element model is developed according to the specifications outlined in Section 1.1, and the primary materials and their corresponding parameters are detailed in Table 4. Solid element (C3D8R) is employed for beams, slabs, and columns, while reinforcement is modeled as wire element (B31). The contact behavior between the substation and the track structure with the soil is Embed, effectively capturing the interaction between the structure and the soil. The finite element analysis model, based on the relevant parameters, is depicted in Fig. 6.
Table 4Material parameters of substation and rail model
Component | Material | Young’s modulus / MPa | Density / (kg·m-3) | Poisson’s ratio |
Column | C40 | 3.3E4 | 2440 | 0.2 |
Beam | C40 | 3.3E4 | 2440 | 0.2 |
Slab | C40 | 3.3E4 | 2440 | 0.2 |
Track board | C40 | 3.15E4 | 2400 | 0.2 |
Steel rail | – | 2.06E5 | 7800 | 0.3 |
Reinforcement | HRB400 | 2.0E5 | 7850 | 0.3 |
Fig. 6Three-dimensional finite element model of rail-soil-substation
Based on the measured vibration data of the equipment, this study develops a finite element model to investigate the interaction between the substation and the equipment (as shown in Fig. 7). The equipment is simplified as a single-degree-of-freedom (SDOF) system, its mass concentrates at the top and represents by point mass elements (MASS). The vibration frequency of the equipment is simulated using SPRING elements.
Fig. 7Substation-equipment interaction model
3.2. Numerical model accuracy verification
The validation work mainly involves three aspects: 1) the measured acceleration of the vibration source in the field is used as the model's loading input, and the response at the mid-span position of the structure's second floor slab is collected as the comparison data; 2) numerical simulation analyses are carried out to extract the response data at the model’s corresponding position; 3) the accuracy is evaluated by calculating the error between the measured results and the simulated results. The vibration measurements are utilized as the loading input in this study, as depicted in Fig. 8. Multiple-point input is employed to simulate the traveling effect of subway load. A comparison of the spectral curves of the vibration response at the mid-span position of the second-floor slab is shown in Fig. 9. The comparison results show that the spectral curves of the measured and simulated results are in good agreement. The frequency corresponding to the main peak of the simulated vibration velocity matches well with the measured data. Table 5 quantifies the average measured velocity response and simulated data for each floor, indicating that the error between the two is less than 8 %. This indicates that the numerical model effectively captures the dynamic characteristics of the actual structure and can be utilized for subsequent vibration isolation analysis.
Fig. 8Subway loading input
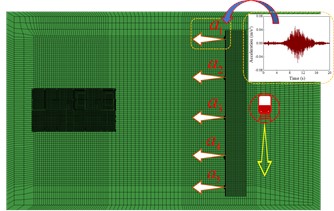
Fig. 9The comparison of the spectral curves of vibration response
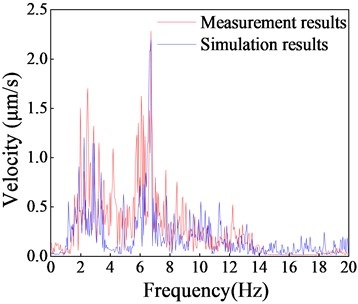
Table 5Measurement and simulation results of each floor
Item | Velocity peak (m/s) | |||
Basement | First floor | Second floor | Top floor | |
Avg. value of measurement | 7.88 | 9.99 | 15.51 | 23.99 |
Simulation result | 7.96 | 9.81 | 16.77 | 23.81 |
Error (%) | 1.02 | 1.83 | 7.51 | 0.76 |
3.3. Structural vibration response analysis at different source distances
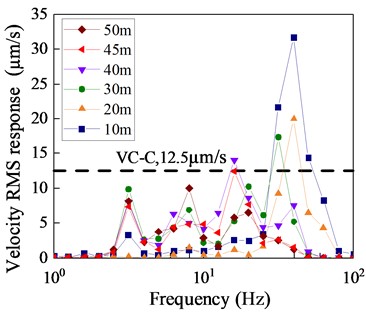
The study investigates the safety distance of the substation under subway vibration [16], based on the calculated results of the model and in combination with the vibration evaluation criteria (VC-C standard). Six working conditions, with distances of 10 m, 20 m, 30 m, 40 m, 45 m, and 50 m, have been selected. The analysis indicator is the velocity response at the mid-span position of each floor slab. Fig. 10 displays the 1/3 octave frequency spectrum curves of the substation vibration velocity at different distances. The root-mean-square (RMS) velocity response of the substation structure decreases significantly with an increase in distance. When the distance between the substation and the subway line is 45 m or greater, the vibration velocity response of the structure is less than 12.5 μm/s, meeting the VC-C standard of the code. However, when the distance is less than 45 m, the numerical value of the structural vibration response exceeds the standard, failing to meet the safety distance requirements. Based on these findings, it is recommended that the distance for the construction of substations should be greater than 45 m when planning subway lines. Alternatively, when regional limitations necessitate a construction distance of less than 45 m, effective isolation measures should be implemented to reduce the impact of subway vibration on the structure and equipment.
Fig. 10Maximum vibration response of substations at different distances
4. Nonlinear gas-spring quasi-zero stiffness isolator
4.1. Working principle
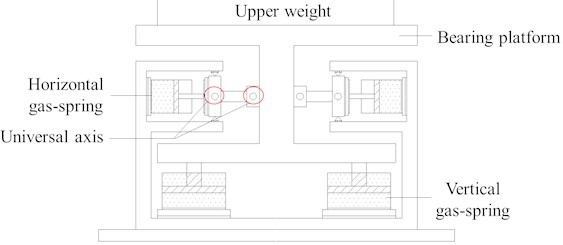
The effects of low-frequency vibration on structures equipped with precision instruments cannot be ignored. This study proposes a nonlinear gas-spring quasi-zero stiffness isolator (NGS-QZSI) that incorporates gas-spring components, as depicted in Fig. 11. The isolator comprises four dual-chamber gas-springs arranged vertically and four single-chamber gas-springs arranged horizontally in parallel. The vertical gas-springs function as positive stiffness elements to uphold the upper structure’s weight, while the horizontal gas-springs contribute negative stiffness. The stiffness of the gas-springs within the isolator can be adjusted by altering the gas pressure to accommodate variations in the supported structure’s mass, thereby ensuring the isolator's quasi-zero stiffness characteristics.
Fig. 11Sectional diagram of NGS-QZSI
4.2. Theoretical analysis
The initial state of the NGS-QZSI is characterized by the isolation system being at a state of static equilibrium, as shown in Fig. 12. At this point, both the vertical and horizontal gas-springs are in a compressed state. The upper mass is fully supported by the vertical gas-spring, while the horizontal gas-spring experiences zero force in the vertical direction. Assuming the upper mass is denoted as , the relationship can be expressed as follows:
The relationship between the pressure and volume of the gas-spring can be obtained from the ideal gas equation as follows:
where, 1.38 is the gas polytropic index [17].
Fig. 12Schematic diagram of the initial state of NGS-QZSI
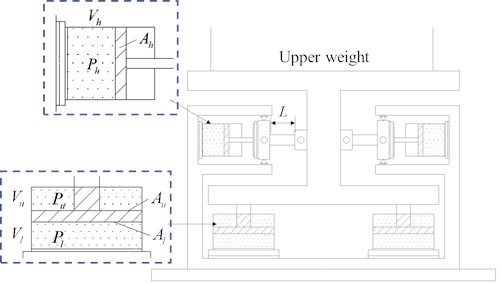
Fig. 13Schematic diagram of NGS-QZSI under external force disturbance
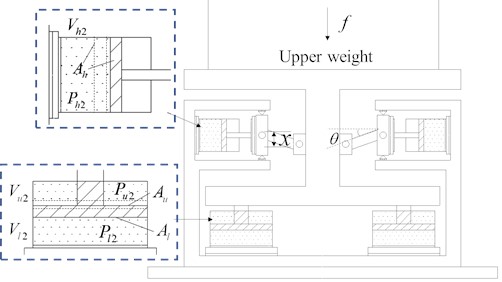
When the isolator is disturbed by static force , the bearing platform of the isolator produces a vertical downward displacement , as shown in Fig. 13. As a result, the lower chamber of the vertical gas-spring is compressed, leading to a decrease in volume from to and an increase in pressure from to . Conversely, the upper chamber experiences tension, causing the volume to increase from to and the pressure to decrease from to . Similarly, the horizontal gas-spring chamber undergoes tension, resulting in an increase in volume from to and a decrease in pressure from to . By utilizing geometric relationships and Eq. (2), the changes in pressure and volume for the vertical and horizontal gas-springs is calculated. At this stage, the force on the quasi-zero stiffness isolator of the gas-spring can be expressed as:
Simplifying Eq. (3), the dimensionless force of the system is obtained as:
where, , , , , , , , , , .
By taking the partial derivative of in Eq. (4), the dimensionless stiffness of the system is obtained as:
According to the quasi-zero stiffness characteristic, the isolation system satisfies and at the static equilibrium position. In practical engineering applications, it is also necessary to ensure that the isolator does not exhibit negative stiffness. Therefore, at the static equilibrium position, the system stiffness should be at its minimum, i.e., . Substituting into the equation and simplifying:
By substituting Eq. (6) and Eq. (7) into Eq. (4), the dimensionless force-displacement relationship expression for the NGS-QZSI is obtained as:
4.3. Numerical simulation
In this study, the connector element in the interaction module of ABAQUS is used for simulation. The section type of the connector is chosen as “axial + torsional”. The isolator is placed between the column and the foundation, and the connector element is used to simulate the force-displacement characteristics of the NGS-QZSI by inputting the performance curve based on the structural isolation design of the isolator. The corresponding connector element is shown in Fig. 14.
5. Isolation effect analysis of substation based on NGS-QZSI
5.1. Isolator parameter design
Based on the actual structural parameters and isolation requirements of the substation, the size parameters of the vibration isolator have been preliminarily determined. The length is set at 100 mm, with = 1.8, = 1.0, and = 1.0, to determine the chamber lengths , and for the vertical and horizontal gas-springs. The piston areas , , and of each gas-spring chamber are calculated based on the isolator's working space in practical applications. Subsequently, the pressures , and of each gas-spring chamber are determined according to the upper weight , using the equations and .
In the case of the F/1 column of the substation, the isolator supports a weight of 263182 N. The NGS-QZSI parameters are detailed in Table 6. As the bearing weight () varies, the dimensional parameters in the table remain constant, with adjustments made only to the cylinder gas pressures (, and ) to accommodate the changes in the upper weight.
Fig. 14Connector element
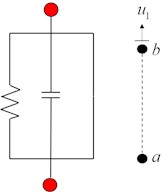
Table 6The value of NGS-QZSI parameters
Parameter | |||||||||
Unit | mm | mm | mm | m2 | m2 | m2 | MPa | MPa | MPa |
Value | 180 | 80 | 100 | 0.071 | 0.066 | 0.071 | 1.16 | 0.2 | 1.2 |
5.2. Isolation scheme
A vibration isolator is installed under each independent column, totaling 46 isolators, as depicted in Fig. 15. The static analysis is utilized to compute the weight supported by the isolator at the base of the column, as detailed in Table 7. The variation in pressure at the base of each column poses a challenge for traditional isolators. This necessitates the production of isolating elements with different parameter configurations, thereby increasing the complexity of isolation construction to some extent. In contrast, the quasi-zero stiffness gas-spring isolator proposed in this study can achieve varying isolation performance simply by adjusting the gas pressure, rendering its implementation straightforward.
Table 7Column bottom pressure in the substation
Axis | Column bottom pressure (N) | ||||||||
1 | 2 | 3 | 4 | 5 | 6 | 7 | 8 | 9 | |
A | 231838 | 586998 | 535819 | 247929 | 281604 | 649977 | 547892 | 200785 | 169232 |
B | 257294 | 194536 | 166930 | 267682 | 315253 | 234163 | 197278 | 228189 | 134469 |
C | 216695 | – | – | 238177 | 217033 | – | – | 189583 | 124135 |
D | 214856 | 215646 | 242516 | 232929 | 261047 | 215648 | 287948 | 204562 | 154552 |
E | 205646 | 200618 | 210549 | – | 251779 | 215448 | 254406 | – | 145445 |
F | 263182 | 428372 | 303923 | – | 243614 | 242031 | 254754 | – | 228433 |
5.3. Isolation effect analysis
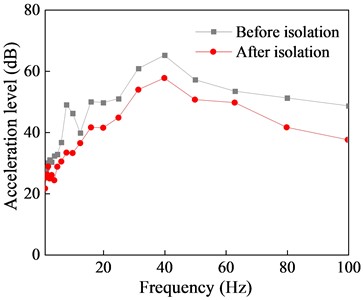
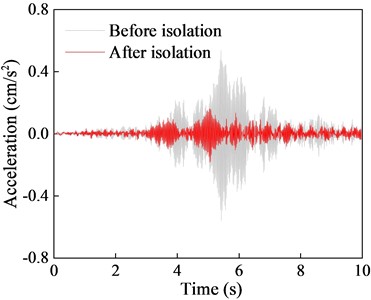
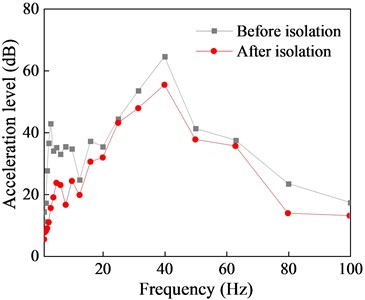
The isolation performance of NGS-QZSI is evaluated by comparing the vibration acceleration responses of each floor before and after isolation in this section. The acceleration time history curves and 1/3 octave frequency bands at the mid-span of each floor slab are shown in Fig. 16 to 18, and the corresponding quantified data of peak acceleration and root mean square isolation effect are presented in Tables 8 and 9.
Comparison of the acceleration time history curves with and without the isolation system indicates a significant reduction in vibration response of the isolated structure, with isolation effects of 74.98 % for peak response and 71.9 % for RMS response. Although there are some differences in isolation effects among different floors, the overall isolation effect remains within the range of 55 % to 75 %. Furthermore, the comparison of the 1/3 octave reveals that NGS-QZSI exhibits good control effects on subway vibrations across the entire frequency range, fully leveraging the advantages of quasi-zero stiffness low-frequency isolation.
Fig. 15NGS-QZSI arrangement scheme
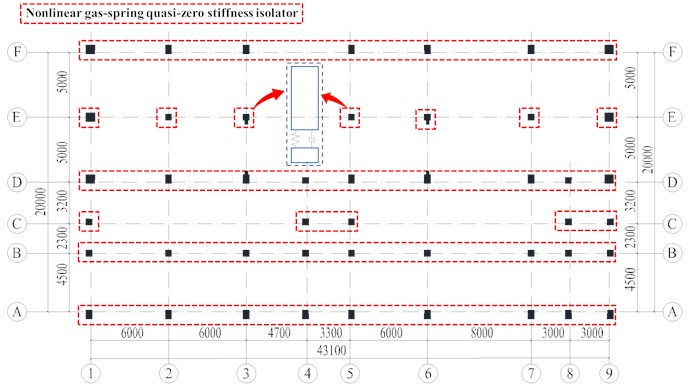
Fig. 16Comparison of first floor vibration response before and after isolation

a) Acceleration time history
b) One-third octave band frequency
Fig. 17Comparison of second floor vibration response before and after isolation
a) Acceleration time history
b) One-third octave band frequency
Fig. 18Comparison of top floor vibration response before and after isolation
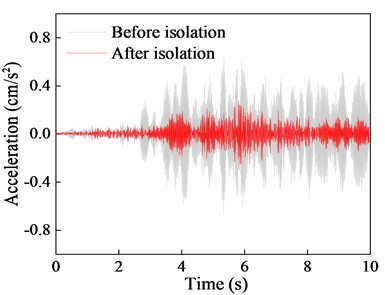
a) Acceleration time history
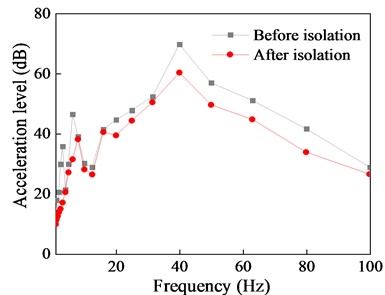
b) One-third octave band frequency
Table 8Peak acceleration isolation effect of each floor (cm·s-2)
Floor | Before isolation | After isolation | Vibration isolation effect (%) |
First floor | 0.676 | 0.169 | 74.98 |
Second floor | 0.562 | 0.187 | 66.73 |
Top floor | 0.671 | 0.300 | 55.29 |
Table 9RMS acceleration isolation effect of each floor (cm·s-2)
Floor | Before isolation | After isolation | Vibration isolation effect (%) |
First floor | 0.119 | 0.033 | 71.90 |
Second floor | 0.103 | 0.035 | 66.20 |
Top floor | 0.196 | 0.065 | 66.84 |
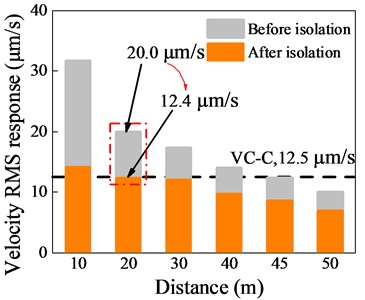
In addition, the vibration velocity response of the substation structure isolated with NGS-QZSI at different distances from the vibration source is analyzed, as shown in Fig. 19. The comparison results demonstrate that the substation structure isolated with nonlinear gas-spring quasi-zero stiffness isolation exhibits a reduction in the RMS velocity response from 20.0 μm/s to 12.4 μm/s at a distance of 20 m from the subway line, which is less than 12.5 μm/s, meeting the VC-C standard. Compared with the non-isolated structure, the safety distance is reduced from 40 m to 20 m, which greatly improves the regional adaptability of the subway line.
Fig. 19Structural velocity response under different vibration source distances
6. Conclusions
This study investigates the propagation of vibration in substation structures caused by the operation of elevated subway lines based on on-site measured data, and its vibration response is evaluated based on standards. A finite element model of substation-equipment considering soil-structure interaction is established, the vibration response analysis of the substation at varying distances from the vibration source is conducted, and a nonlinear gas-spring quasi-zero stiffness isolator is proposed for reducing structural vibration and improving safety distances. Based on the numerical simulation and measured studies, the following conclusions are mainly obtained:
1) The substation primarily experiences vertical vibration under the subway load, and the structural peak velocity response slightly increases with increasing floor levels. At the current vibration source distance, the maximum vibration response is 7.33 μm/s, which is below the VC-C limit of 12.5 μm/s, indicating that the substation meets the safety distance requirements.
2) The substation-equipment numerical model considering soil-structure interaction is established, and its accuracy is verified based on measured results. The structural vibration response exceeds the safety limit when the vibration source distance is less than 45 m. It is recommended to adopt effective isolation measures to further reduce the safety distance of the substation to address the geographical limitations of subway line construction.
3) A nonlinear gas-spring quasi-zero stiffness isolator is proposed, and its mechanical performance expression is theoretically derived. The proposed isolator can effectively reduce the subway-induced structural vibration response, with a control effect of over 70 % for peak and RMS responses. Frequency domain analysis results demonstrate that it can also effectively isolate within the low-frequency range. Particularly, the safety distance of the substation structure controlled by NGS-QSZI is reduced from 45 m to 20 m.
References
-
N. K. Kedia and A. Kumar, “A review on vibration generation due to subway train and mitigation techniques,” Lecture Notes in Civil Engineering, Vol. 1, pp. 295–308, May 2019, https://doi.org/10.1007/978-981-13-6701-4_18
-
A. Gesualdo and F. Penta, “A model for the mechanical behaviour of the railway track in the lateral plane,” International Journal of Mechanical Sciences, Vol. 146-147, pp. 303–318, Oct. 2018, https://doi.org/10.1016/j.ijmecsci.2018.06.041
-
P. Lopes, J. F. Ruiz, P. Alves Costa, L. Medina Rodríguez, and A. S. Cardoso, “Vibrations inside buildings due to subway railway traffic. Experimental validation of a comprehensive prediction model,” Science of The Total Environment, Vol. 568, pp. 1333–1343, Oct. 2016, https://doi.org/10.1016/j.scitotenv.2015.11.016
-
J. Sadeghi, M. H. Esmaeili, and M. Akbari, “Reliability of FTA general vibration assessment model in prediction of subway induced ground borne vibrations,” Soil Dynamics and Earthquake Engineering, Vol. 117, pp. 300–311, Feb. 2019, https://doi.org/10.1016/j.soildyn.2018.11.002
-
D. P. Dos Santos, G. M. S. Gidrão, and R. Carrazedo, “A simplified numerical model for the assessment of vibration in subway lines with experimental validation,” International Journal of Structural Stability and Dynamics, Vol. 21, No. 11, p. 21501, Jul. 2021, https://doi.org/10.1142/s021945542150156x
-
M. Breccolotti et al., “Vibrations induced by the new underground railway line in Palermo, Italy Experimental measurements and FE modeling,” in Proceedings of the 8th International Conference on Structural Dynamics, 2011.
-
M. Sanayei, P. Maurya, and J. A. Moore, “Measurement of building foundation and ground-borne vibrations due to surface trains and subways,” Engineering Structures, Vol. 53, No. 8, pp. 102–111, Aug. 2013, https://doi.org/10.1016/j.engstruct.2013.03.038
-
K. E. Vogiatzis and G. Kouroussis, “Prediction and efficient control of vibration mitigation using floating slabs: practical application at Athens metro lines 2 and 3,” International Journal of Rail Transportation, Vol. 3, No. 4, pp. 215–232, Oct. 2015, https://doi.org/10.1080/23248378.2015.1076622
-
C. Zhang, N. Zhang, J. Wang, and J. Yao, “Vibration reduction and isolation performance of a platform foundation and column base of an ancient wooden structure based on the energy transfer analysis,” Journal of Low Frequency Noise, Vibration and Active Control, Vol. 41, No. 3, pp. 1178–1191, Mar. 2022, https://doi.org/10.1177/14613484221082635
-
A. Valeev, A. Zotov, and S. Kharisov, “Designing of compact low frequency vibration isolator with quasi-zero-stiffness,” Journal of Low Frequency Noise, Vibration and Active Control, Vol. 34, No. 4, pp. 459–473, Dec. 2015, https://doi.org/10.1260/0263-0923.34.4.459
-
K. Rong, Z. Lu, J. Zhang, M. Zhou, and W. Huang, “Nonlinear gas-spring DVA for seismic response control: Experiment and numerical simulation,” Engineering Structures, Vol. 283, p. 115940, May 2023, https://doi.org/10.1016/j.engstruct.2023.115940
-
C. Cheng, S. Li, and Y. Wang, “Modeling and analysis of a high-static-low-dynamic stiffness vibration isolator with experimental investigation,” Journal of Vibroengineering, Vol. 20, No. 4, pp. 1566–1578, Jun. 2018, https://doi.org/10.21595/jve.2017.18643
-
Kunjie Rong, Zheng Lu, Kunjie Rong, and Zheng Lu, “A novel nonlinear gas-spring TMD for the seismic vibration control of a MDOF structure,” Structural Engineering and Mechanics, Vol. 83, No. 1, p. 031, 2022.
-
H. Amick et al., Evolving criteria for research facilities: vibration. San Diego, 2005.
-
R. Nodeh Farahani, G. Abdollahzadeh, and A. Mirza Goltabar Roshan, “The modified energy-based method for seismic evaluation of structural systems with different hardening ratios and deterioration hysteresis models,” Periodica Polytechnica Civil Engineering, Aug. 2023, https://doi.org/10.3311/ppci.21359
-
P. Amirchoupani, R. Nodeh Farahani, and G. Abdollahzadeh, “The constant damage inelastic displacement ratio for performance design of self-centering systems under far-field earthquake ground motions,” Structures, Vol. 57, p. 105254, Nov. 2023, https://doi.org/10.1016/j.istruc.2023.105254
-
K. Rong, X. Li, Z. Lu, and S. Wu, “Studies on control mechanism and performance of a novel pneumatic-driven active dynamic vibration absorber,” Structural Engineering and Mechanics, Vol. 87, No. 2, pp. 117–127, Jul. 2023, https://doi.org/10.12989/sem.2023.87.2.117
About this article

The authors have not disclosed any funding.
The datasets generated during and/or analyzed during the current study are available from the corresponding author on reasonable request.
Yong Liu and Tiantian Li: investigation, supervision, writing - original draft. Lin Li and Zhengquan Cheng: software, data curation, writing-review and editing. Kunjie Rong: conceptualization, supervision, writing-review and editing. Li Tian: resources, writing - review and editing.
The authors declare that they have no conflict of interest.
