Abstract
The article is devoted to detection of an abnormal and pre-emergency state of pumping equipment using clustering and anomaly search algorithms. A background for research is the need to search for and apply methods for assessing the technical condition and identifying emerging defects in an automated mode for a wide range of equipment that give results at an earlier stage than existing ones. To achieve this goal, we consider the use of machine learning methods to analyze the parameters of equipment operation over a certain time period in order to create an algorithm for detecting anomalies in data, which in this case will be signs of abnormal operation. This article discusses the application of clustering based on the k-means method. So, in this research three normal operating modes of pumping equipment were recognized in the synthesized data. Based on the analysis of the distribution of each measurement to the corresponding nearest cluster centroid, the maximum distance from each measurement point to it was determined, which further served as a criterion for classifying a certain measurement as data outliers. As a result of the analysis, five measurements were identified that correspond to the abnormal operation of oil pumping equipment. Also, the ranges of normal operation of the equipment were compiled for each of the measured parameters of its operation, which forms the threshold values for classifying the state of the equipment as an abnormal or emergency state. The proposed approach has such advantages as the possibility of full automation, adaptation to various operating modes of the equipment, no need to share data outside the pumping station, early detection of emerging defects and the onset of an emergency.
1. Introduction
Integrity and safety are the critical of parts of oil pumping equipment operations. One of the tools to solve this problem is the application of technical diagnostics, the results of which determine the current technical condition, the presence of developing defects, assessing the remaining life [1]. Nowadays, almost all industries, including oil and gas, use the principle of setting threshold values for any parameter, less often for two parameters, to determine the technical condition [2]. This approach is quite simple, easy to implement, but, with rare exceptions, does not use the specifics of a particular equipment or its modes of operation.
For instance, PJSC “Transneft” currently uses guidelines from RD 08.00-60.30.00-KTN-016-1-05 [3], that determines assessment of vibration conditions according to RMS-velocity threshold values [4], applied uniformly to a large class of pumps [5].
With such an approach it is difficult to detect the nucleation of a defect and to recognize irregularities in the performance of the pumping equipment in advance. For example, a pump in low-load operation may show reduced defect signatures, but undergo intensive degradation and soon reach failure.
It is also worth noting that for a more complete assessment of the technical condition of the equipment, as many operating parameters as possible should be used. In general, in addition to information about the RMS value of vibration velocity, vibration values at given points, instantaneous flow values, pressure drop (head), efficiency values, bearing temperatures can all be used.
Also, it could be very useful to apply information from other methods of condition monitoring, such as acoustic noise signal analysis [6], infrared thermography [7], lubricant analysis [8], analysis of electric drive parameters [9], shock pulse method [10], etc.
However, in that case it is much more difficult to develop a deterministic algorithm: many of these parameters are pump specific or mode dependent. In this case it is necessary to use algorithms that can be implemented without human intervention and work in automated mode.
This paper analyses how machine learning algorithms can be used to detect equipment malfunctions or signs of developing defects.
It is worth noting that machine learning distinguishes between several tasks, which in particular are divided into supervised learning and unsupervised learning, which respectively reflect whether or not it is possible to develop a learning algorithm knowing the required results. Supervised learning algorithms are undoubtedly more accurate and preferable under equal conditions, and essentially boil down to a binary classification problem. But in the context of determining technical condition, it is necessary to have different input data for analysis, including examples of equipment operation in abnormal or emergency condition. In other words, it is difficult to prepare input data that will reflect all possible variants of the state of the equipment. Accordingly, in this case it is necessary to consider algorithms of “unsupervised learning”.
Oil pumping units operate in different modes, which obviously have different operating parameters. In this case, all parameter values for all modes will not follow the normal law of distribution, and hence statistical methods for determining emissions (anomalies) based on it will not be applicable.
In general, the following methods can be used in machine learning anomaly search tasks: single class support vector method, isolating forest method, metric methods, cluster analysis and others [11].
In the context of oil pumping equipment, it is interesting to apply methods using cluster analysis. According to this approach, all initial data reflecting equipment operation parameters are placed in the form of points in a conditional space: in case of two parameters – in a flat graph, three parameters – in a three-dimensional graph, -parameters – in -dimensional space. All points will be irregularly clustered in space, and those points that are close to each other are designated as belonging to the same cluster. In this way, several clusters will be formed, combining almost all the points, as well as several points that will not be included in them – these points will be anomalies, and in the case in question, abnormal equipment operation.
2. Conducting oil unit equipment accident studies using machine learning
To analyze the application of machine learning techniques to detect equipment abnormalities or signs of developing defects, we use synthetic raw data on the operation of conditional equipment. We select the data so that the main part of the data reflects several modes of equipment operation, and also contains several anomalous points.
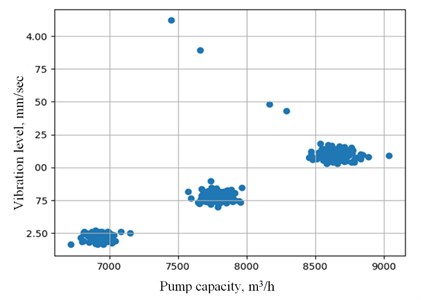
The raw data reflects the three operating modes, and has information about pump flow, pump differential pressure, vibration level, unit bearing temperature, power, pump inlet pressure, efficiency.
Fig. 1 shows a set of measurements from the raw data for the pump delivery-performance pair as an example.
The next step is performing of clustering using the -means method. This method assumes that there are -clusters. Then the position of their centroids is chosen so that the sum of Euclidean distances from all points to the nearest centroid is the smallest. Then the dependence of the sum of distances on k is plotted, and the optimal number of clusters is determined by the point of greatest inflection of the graph.
Fig. 1Visualization of raw data for the pump flow – vibration level
Given that the data to be analyzed have different dimensions, data normalization should be performed (in this case was applied a standard estimate, or -estimate). This is done using the following formula for each -th dimension of Eq. (1):
where – standardized value of the -th measurement of parameter ; – value of the -th measurement of parameter ; – average value of measurements of parameter ; standard deviation of parameter . Thus, all data are reduced to dimensionless values with a mean value of 0 and a standard deviation of 1.
According to the considered algorithm for each considered number of clusters k, we calculate the total distance to the nearest centroid from each point (Fig. 2).
Fig. 2Dependence of total distance to centroid for different numbers of clusters
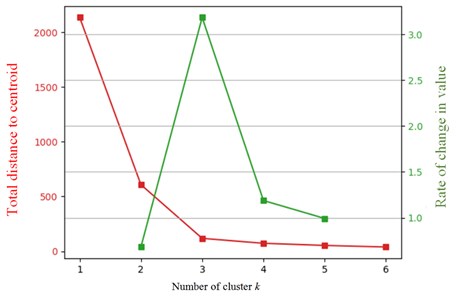
To determine the optimum value of , determine the rate of change of the graph using the following formula Eq. (2):
where is the total distance to the nearest centroid from each point in the case of a total number of clusters equal to .
And then the highest value of the rate of change of the schedule is determined, which in this case corresponds to 3. Thus, there are three clusters in the original data, in other words, the oil pumping unit is operating in three normal modes.
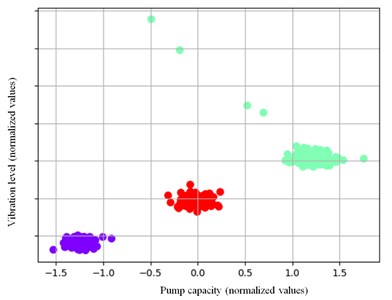
From a visual review of the data, there are anomalies (Fig. 3).
Fig. 3Visualization of the raw data for the pump flow – vibration level pairing into three clusters
To identify the anomalies numerically, we will use an analysis of the distribution of distances from each point to the nearest centroid (Fig. 4).
Fig. 4Distribution of points and parameters depending on the distance to the corresponding nearest centroid
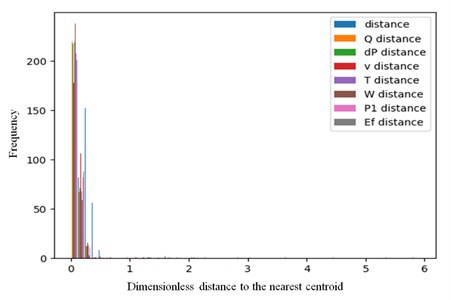
The graph in Fig. 4 shows that there are isolated outliers at values greater than about 0.5. Due to the low frequency of occurrence, they are almost invisible on the graph. A point is considered abnormal if at least one of the parameters differs from the larger mean by more than three times the standard deviation Eq. (3):
where is the mean value of distances from each dimension to the nearest centroid by the -th dimensionless parameter; is its standard deviation; is the threshold value of distance to the nearest centroid, above which the point is considered abnormal; is the index of enumeration of values by the initial parameters.
After performing a statistical analysis, it is obtained that the threshold dimensionless distance will be 0.443. We mark the points that are more distant than this value for any of the parameters. There are five such points in this case (Fig. 5).
Fig. 5Visualization of data clustering and highlighting of anomalies (anomalies are marked in red)
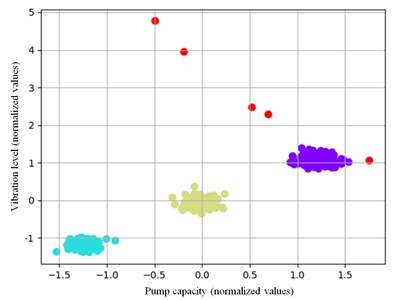
Thus, three normal operating modes and five abnormal cases are identified in the raw data with information on equipment operation.
Based on the threshold dimensionless distance information for each parameter, and using the inverse normalization procedure, a range of values can be obtained in which for each mode of operation the parameters are normal. The results are presented in Table 1.
Table 1Range of standard values for equipment operating parameters
Parameter | Regime 1 | Regime 2 | Regime 3 | ||||||
Average | Min | Max | Average | Min | Max | Average | Min | Max | |
Inflow, m3/hour | 7790 | 7415 | 8165 | 6929 | 6554 | 7303 | 8631 | 8256 | 9006 |
Pressure drop, atm. | 15,4 | 14,0 | 16,8 | 13,7 | 12,3 | 15,1 | 17,2 | 15,8 | 18,6 |
Vibration velocity, mm/sec | 2,8 | 2,5 | 3,1 | 2,5 | 2,2 | 2,7 | 3,1 | 2,9 | 3,4 |
Temperature, °С | 38,9 | 36,3 | 41,4 | 34,6 | 32,1 | 37,1 | 43,2 | 40,7 | 45,8 |
Capacity, kKW | 5094 | 4749 | 5438 | 4527 | 4182 | 4871 | 5657 | 5312 | 6001 |
Inlet pressure, atm. | 9,3 | 8,9 | 9,6 | 8,2 | 7,8 | 8,6 | 10,3 | 9,9 | 10,7 |
Efficiency | 0,802 | 0,751 | 0,852 | 0,711 | 0,661 | 0,762 | 0,885 | 0,834 | 0,935 |
Note that the proposed method makes it possible to monitor the state of the equipment, both by specific parameters and by various combinations of parameters.
3. Conclusion
This paper presents an algorithm for analyzing the operation of oil pumping equipment using real-time information on its condition. The presented method makes it possible to identify normal operating modes, and for each mode to determine threshold values for each of the operating parameters. This will make it possible to identify abnormal or emergency modes of pump operation even before threshold values of parameters determined according to normative documents are reached, as well as to expand the number of parameters by which the state of equipment can be judged.
The advantage of the proposed method is its complete automation. A database can be generated for each pumping unit individually. In this way, information about the operation of the equipment can stay within the plant, which is a great advantage in case of information security requirements. After operating the unit for several months, up to one year, when the equipment has worked in all its normal modes, the generated database will be sufficient. In case an abnormal operation of the unit is detected, the signal can first go to the control room, where a decision is made together with the mechanics whether this particular case is expected according to the current operation of the equipment, or whether the situation is potentially dangerous.
The obtained calculated range of standard values of equipment operation parameters more strictly estimates its technical condition, and the corresponding threshold values are less than those established by the normative documents on oil pumping units’ operation. This will make it possible to detect unfolding defects and the onset of emergencies at earlier stages, which will further reduce the probability of equipment failures and ensure more reliable pipeline transport of hydrocarbons.
References
-
A. R. Valeev, N. A. Atroshchenko, and B. G. Kharrasov, “History of technical diagnostics and repair organization systems in industry,” Liquid and Gaseous Energy Resources, Vol. 2, No. 1, pp. 31–37, Jun. 2022, https://doi.org/10.21595/lger.2022.22706
-
B. K. N. Rao, Handbook of condition monitoring. Elsevier, 1996.
-
“RD 08.00-60.30.00-KTN-016-1-05 Guidelines for maintenance and repair of equipment and facilities of oil pumping stations,” PJSC “Transneft”, Moscow, Russia, 2005.
-
A. Muszynska, “Vibrational Diagnostics of Rotating MachineryMalfunctions,” International Journal of Rotating Machinery, Vol. 1, No. 3-4, pp. 237–266, 1995, https://doi.org/10.1155/s1023621x95000108
-
“RD-75.200.00-KTN-119-16 Trunk pipeline transport of oil and oil products. Maintenance and repair of mechanical and technological equipment and facilities of oil transportation stations,” PJSC Transneft, Moscow, Russia, 2016.
-
P. Scanlon, D. F. Kavanagh, and F. M. Boland, “Residual life prediction of rotating machines using acoustic noise signals,” IEEE Transactions on Instrumentation and Measurement, Vol. 62, No. 1, pp. 95–108, Jan. 2013, https://doi.org/10.1109/tim.2012.2212508
-
G. Singh, T. C. Anil Kumar, and V. N. A. Naikan, “Induction motor inter turn fault detection using infrared thermographic analysis,” Infrared Physics and Technology, Vol. 77, pp. 277–282, Jul. 2016, https://doi.org/10.1016/j.infrared.2016.06.010
-
K. Wang, X. Liu, X. Wu, and Z. Zhu, “Condition monitoring on grease lubrication of rolling bearing using AE technology,” in 2017 9th International Conference on Modelling, Identification and Control (ICMIC), pp. 595–599, Jul. 2017, https://doi.org/10.1109/icmic.2017.8321525
-
M. T. Pham, J.-M. Kim, and C. H. Kim, “Intelligent fault diagnosis method using acoustic emission signals for bearings under complex working conditions,” Applied Sciences, Vol. 10, No. 20, p. 7068, Oct. 2020, https://doi.org/10.3390/app10207068
-
D. E. Butler, “The Shock-pulse method for the detection of damaged rolling bearings,” Non-Destructive Testing, Vol. 6, No. 2, pp. 92–95, Apr. 1973, https://doi.org/10.1016/0029-1021(73)90116-3
-
S. Nasiriany, G. Thomas, W. Wang, A. Yang, J. Listgarten, and A. Sahai, “A comprehensive guide to machine learning,” Department of Electrical Engineering and Computer Sciences University of California, Berkeley, USA, 2019.
Cited by
About this article

The reported study was funded by the Russian Science Foundation according to the research project No. 22-29-00970, https://rscf.ru/project/22-29-00970/.
The datasets generated during and/or analyzed during the current study are available from the corresponding author on reasonable request.
The authors declare that they have no conflict of interest.
