Abstract
The explosion site terrain and geomorphic environment will directly affect the shock wave pressure propagation and attenuation law and the shock wave test results uncertainty evaluation. In this study, the explosion site topographic and geomorphic parameters were analyzed, and the slope ratio and elevation difference within the region were proposed to parameterize the test site topographic and geomorphic characteristics. Using multi-physical field coupling simulation software, the finite element numerical simulation model of acoustic-solid structure coupling with different elevation difference and slope ratio is established and relevant research is carried out. The results show that when the pressure monitoring point is located at the test site low position, the elevation difference plays a role in attenuation of the shock wave pressure peak value, and vice versa; With the increase of the test site slope ratio, the shock wave pressure peak value at different test points gradually increases, and with the increase of the distance between the test points, the impact degree gradually decreases. Therefore, the elevation difference and slope ratio of the site shall be reduced as much as possible during the explosion shock wave pressure test, so as to improve the shock wave pressure test accuracy and the test data reliability, and provide theoretical support for the shock wave pressure test results uncertainty evaluation in the explosion field.
Highlights
- We analyzed the terrain and topography of the testing site and proposed to use elevation differences and slope ratios within the region to characterize the terrain environment.
- The numerical simulation model of explosion shock wave propagation propagation and distribution law coupled with multiple physical fields is constructed, and the influence of different terrain environments on the pressure propagation and distribution law is carried out.
- The impact of elevation difference and slope ratio within the testing site area on the propagation law of shock wave pressure has been clarified, providing a theoretical basis for the standardized design of the testing site.
1. Introduction
The shock wave pressure generated in the ammunition explosion process is one of the main damage parameters that can damage the target, and it is also the main technical index parameter that needs to be considered in the ammunition design process [1-2]. Therefore, it is particularly important to accurately obtain the shock wave pressure in the ammunition explosion process. Based on the existing test data analysis, it is found that with the change of the test site terrain and geomorphic environment, there is a large difference in the explosion shock wave pressure obtained by the same ammunition at the same location. Therefore, it is necessary to carry out research on the impact of the test site topography and geomorphic environment on the explosion shock wave pressure distribution law, so as to provide theoretical guidance for the explosion shock wave pressure test site standardized design.
At present, researchers at home and abroad have carried out relevant research on the test site environmental characteristics influence on the explosion shock wave pressure distribution law, and have made certain research results. For example, Xu Q. P. [3-4] and others established touchdown explosions numerical models on trench terrain and flat ground with different widths and depths in order to study the trench terrain impact on the explosion shock wave propagation law, and obtained the relationship between the impact wave pressure, impulse and trench width. In the same year, in order to study the slope effect on explosion shock wave pressure, they conducted explosion experiments and numerical simulation on slope terrain with slope angles of 0°, 10°, 20°, 30° and 40° respectively, obtained shock wave overpressure and impulse data under different terrain conditions, and established engineering calculation formulas for peak pressure and shock wave impulse on different slope terrain. Deng Y. et al. [5] studied the explosion shock wave pressure distribution law under complex tunnels. A comprehensive attenuation coefficient model considering multiple propagation attenuation factors is proposed, and the explosion shock wave most unfavorable propagation path model in complex tunnels is given. Ma R. H. et al. [6] designed four kinds of tunnel structures with equal sectional area but different shapes in order to study the tunnel section shape influence on the explosion shock wave propagation law, and carried out finite element numerical simulation and actual measurement tests to clarify the influence of tunnels different shapes on shock wave pressure. Rong K. et al. [7] established a calculation model with different thicknesses and different distances for simulation analysis using the SPH-FEM coupling algorithm in order to study the soil medium attenuation effect on the explosion shock wave. Zhang X. W. et al. [8] studied the shock wave diffraction and overpressure distribution law behind the flameproof wall under the explosion load action, carried out the experiment of the flameproof wall isolation effect on the explosion shock wave, and obtained the shock wave overpressure distribution law in different areas behind the flameproof wall under different explosion equivalent, explosion distance, wall height parameters. Liu X. et al. [9] studied the explosion shock wave propagation law and overpressure load o at the tunnel entrance, and analyzed the shock wave propagation law and overpressure load in the tunnel. In order to study the explosion shock wave propagation characteristics in the tunnel space, Zhu S. F. et al. [10] established a tunnel explosion physical model using the fluid structure coupling algorithm of ANSYS/LS-DYNA program, numerically simulated the mutual propagation process of explosion shock wave in the tunnel space, and obtained the explosion shock wave pressure propagation law in the confined space. Mao J. F. et al. [11] carried out a numerical simulation study on the shock wave pressure propagation process when the thermobaric explosive exploded at the tunnel mouth, analyzed the peak overpressure and positive pressure action time the variation law of the thermobaric explosive explosion shock wave along the tunnel depth, and fitted the empirical formula of peak overpressure attenuation along the tunnel depth, laying a foundation for determining the damage range.
It can be seen from the current research status that the relevant researchers mainly focus on the impact of test site different shapes on the shock wave pressure propagation law, while the research on the terrain and geomorphic environment under the conventional shooting range environment is almost zero. However, in the actual ammunition explosion shock wave pressure test, the ammunition static explosion shock wave pressure test is mainly carried out on the conventional shooting range ground. The test site terrain and landform impact on the shock wave pressure cannot be ignored. Therefore, in order to make up for this research shortage, it is necessary to carry out relevant research and analysis on the terrain and geomorphic environment of the shooting range.
In this study, the finite element numerical simulation model of the explosion shock wave pressure distribution law coupled with multiple physical fields was established, and the explosion shock wave pressure propagation distribution law was obtained when the test site had different elevation difference and slope ratio. Through the analysis of shock wave pressure evolution nephogram and shock wave pressure time history curve, the influence of elevation difference and slope ratio on shock wave pressure is clarified.
2. Explosion shock wave and the test site topographic and geomorphic characterization parameters
The explosive explosion is accompanied by the explosive products of high temperature and pressure. The explosive products diffuse to the outside at a very high speed. During the diffusion process, the surrounding air is rapidly compressed, causing a high-pressure area to appear at local locations, forming an initial shock wave in the air [12-14]. The initial shock wave is a strong discontinuity, and its velocity is far greater than the interface velocity between explosion products and air, resulting in the separation of the pressure wavefront and the interface between explosion products and air. If the initial shock wave pressure attenuation effect is not considered, the initial shock wave constitutes the entire pressure wave head, with the highest pressure and the lowest pressure at the pressure wave tail, and the interface between explosion products and air is continuous. After the explosion products first excessive expansion, the first reverse compression process starts because the explosion products pressure is lower than the air pressure. At this time, the pressure wave and rarefaction wave are separated from the explosion products and spread forward independently, thus forming an air shock wave with rarefaction wave (or negative pressure zone) at the tail, which is called explosion air shock wave. The formation and pressure distribution of explosion shock wave are shown in Fig. 1(a). The typical explosion shock wave pressure time history curve is shown in Fig. 1(b) [15, 16].
Fig. 1Explosion shock wave pressure
a) Shock wave and pressure distribution formation
b) Shock wave pressure time history curve
Through the analysis of the explosion site environment, it is found that the impact of the explosion site ground environment on the explosion shock wave pressure propagation law is mainly caused by the difference in the on-site test environment topography. According to the definition of topography and geomorphology in geology, the parameters characterizing topography and geomorphology in different environments are not fixed but directly related to the actual test environment. According to the actual blast field shock wave pressure test environment, combined with the blast wave pressure propagation and evolution law and the previous shock wave pressure test data processing results, on the basis of not affecting the blast field shock wave pressure test results accuracy, the blast field ground topography characterization parameters can be summarized as the elevation difference and the terrain within the region slope ratio.
Height difference refers to the height difference between the highest point and the lowest point within the range of shock wave pressure test in the explosion field. Assume that the shock wave pressure test site is as shown in Fig. 2, the highest point in the test area is B, the lowest point is A, and the height difference between them is . Then the height difference is called the elevation difference in the test area [17].
Fig. 2Height difference structure schematic diagram
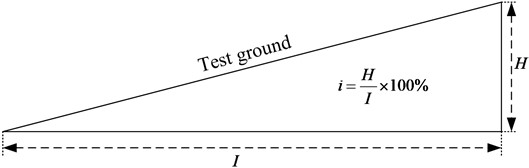
The slope ratio is the unit steepness within the shock wave pressure test area. Generally, the ratio of plumb height H and horizontal width I of slope surface is called slope, which is expressed by . There are four methods to express slope: percentage method, degree method, density method and fraction method, among which percentage method is more commonly used [18]. The percentage method is calculated by multiplying the ratio of elevation difference and horizontal width of two points by 100 %. The calculation formula and slope ratio structure are shown in Fig. 3.
Fig. 3Test site slope ratio structure schematic diagram
3. Multi physical field coupling finite element numerical simulation model
3.1. Analysis of elevation difference influence on shockwave pressure distribution
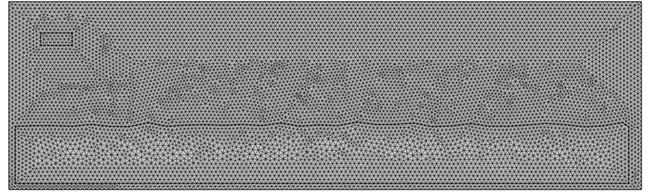
Based on the explosion shock wave pressure actual test environment in the shooting range, the finite element numerical simulation model of the propagation law of explosion shock wave coupled with sound and solid structure is established by using the multi-physical field coupling simulation software COMSOL. The model is mainly composed of three parts, namely air module, sound pressure generation module and ground propagation medium module. The sound pressure generation module is used to simulate the shock wave pressure signal generated in the ammunition explosion process. In order to simulate the normal reflection of the explosion shock wave (the shock wave pressure incident angle is 0°), the propagation velocity of the incident sound pressure generated by the sound pressure generation module is perpendicular to the ground (the vibration direction of the sound pressure generation module is up and down). The ground propagation medium module is used to simulate the terrain and geomorphic environment of the explosion site ground, and the ground propagation medium is soil. The air domain structural dimension is 1.1 m × 3.5 m (Length × Width), the ground transmission medium structure size is 10 m ×0.9 m (Length × Width). The ground transmission medium elevation difference is set as 30 mm, 50 mm, 80 mm, 100 mm and 130 mm (when the elevation difference within the area is greater than 130 mm, it is completely distinguishable by the naked eye, and the test site can be directly leveled manually before the test). In COMSOL, the each model mesh structure size division is different from that of finite element numerical simulation software such as ANSYS. In COMSOL, the software is directly used to automatically divide the mesh structure size. The mesh division type is very fine mesh. The software will directly divide the mesh according to the model characteristics, the model structure of the after meshing is shown in Fig. 4. In order to obtain the ground reflection pressure curve at different distance from the sound source center, several pressure monitoring points are set on the ground propagation medium upper surface. The horizontal projection distance from the pressure monitoring point to the vertical projection point of the sound source center is 0.7 m, 1.6 m, 2.8 m, 3.7 m, 4.6 m, 5.5 m, 6.7 m, 7.6 m, 8.8 m and 9.7 m respectively.
Fig. 4Model mesh subdivision results
To simulate the shock wave pressure propagation characteristics in semi-infinite space during the ammunition actual explosion, the air module four boundaries are set as soft sound field boundaries. When the shock wave reaches the air domain boundary, the pressure can flow out directly, reducing the incident shock wave reflection at the model boundary due to the boundary reflection, and forming the reflected shock wave. In order to truly simulate the interaction between the shock wave pressure and the surface propagation medium in the actual ammunition explosion process, the ground propagation medium upper surface is set as the acoustic-solid structure coupling boundary, and the other three boundary conditions are set as the hard sound field boundary. Various types of boundary conditions are preset in COMSOL. During actual use, you can directly select the required boundary condition type and add it to the corresponding modules boundary.
Because the test site overall elevation difference is a certain value, the elevation difference at each location of the site fluctuates, and has great randomness. In order to define the detailed position relationship between the measuring point and the elevation difference in the test site, when the ground slope at the pressure monitoring point location is positive, the pressure monitoring point is at the test site high position; when the ground slope at the pressure monitoring point location is negative, the pressure monitoring point is at the test site low position.
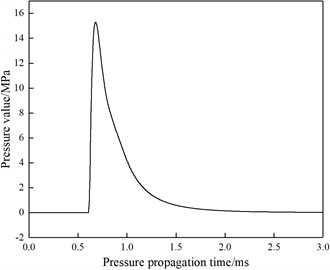
To simulate the shock wave pressure loading process in the ammunition actual explosion process, the shock wave pressure time history curve after the ammunition explosion is first obtained by using the explosion mechanics simulation software, and then the shock wave pressure data is added to the sound pressure generation module in the form of sound pressure excitation signal. The sound pressure generation module generates the shock wave pressure, thus simulating the shock wave pressure propagation process in the ammunition explosion process. In the process of ammunition explosion shock wave pressure test and damage effect evaluation, researchers pay more attention to the explosion shock wave pressure peak value, and the negative pressure area caused by the explosive products excessive expansion has less attention to the targets damage effect. Therefore, this study focuses on the impact of the topographic and the test site geomorphic parameters on the blast wave peak pressure. When selecting the acoustic pressure excitation signal loaded in the numerical simulation model, select the signal consistent with the blast wave pressure signal rising process. The acoustic pressure excitation signal loaded in the finite element numerical simulation model is shown in Fig. 5.
Fig. 5Sound pressure excitation signal loaded in the model
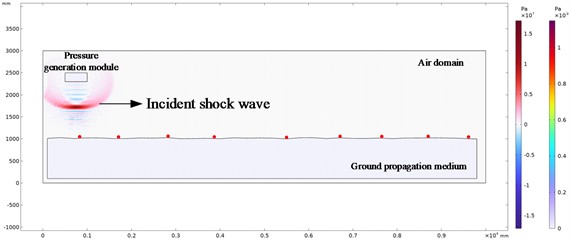
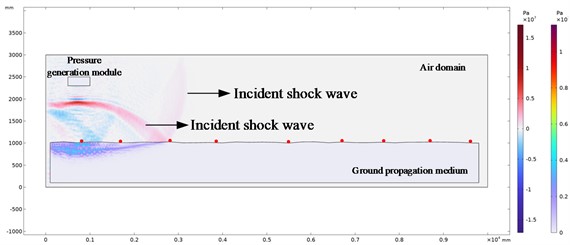
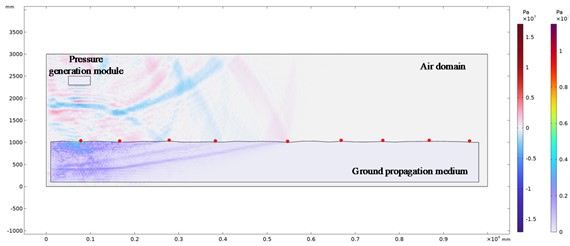
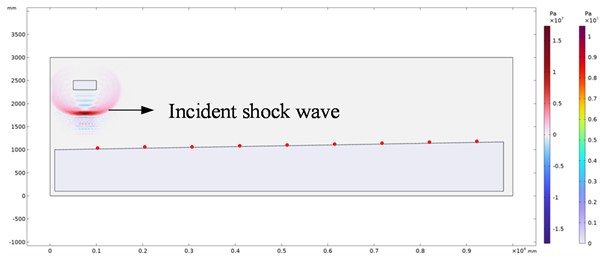
The above model is used to carry out finite element numerical simulation analysis, and the shock wave pressure evolution nephogram and the stress wave distribution nephogram in the solid propagation medium at different explosion times are obtained. Due to the large number of evolutionary cloud images obtained, we selected the evolutionary cloud images with a surface propagation medium elevation difference of 30 mm when the explosion time is 1.8 ms, 4.4 ms, 6.4 ms, 10.6 ms and 13.6 ms for display and analysis. The red dots in the pressure evolution nephogram are the set pressure monitoring points. The evolution cloud map is shown in Fig. 6.
Fig. 6Shock wave pressure evolution cloud chart at different explosion times
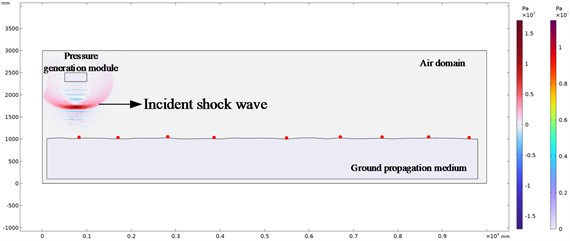
a) Explosion time 1.8 ms
b) Explosion time 4.4 ms
c) Explosion time 6.4 ms
d) Explosion time 13.6 ms
It can be seen from the above shock wave pressure evolution cloud diagram in the air and ground propagation medium that when the explosion shock wave propagates in the air, the shock wave propagates from the sound source center to the distance in the form of spherical wave. Before encountering obstacles, the shock wave front is a regular spherical surface, as shown in Fig. 6(a). When the shock wave propagates to the ground, the incident shock wave front collides with the ground, forming a reflected shock wave front. The reflected shock wave front shape is affected by the terrain of the ground propagation medium, as shown in Fig. 6(b).
To quantitatively study the effect of elevation difference of ground propagation medium on the distribution law of shock wave pressure propagation, the shock wave pressure time-history curves at the horizontal distance of 0.7 m, 1.7 m, 2.8 m, 3.7 m, 5.5 m, 6.7 m, 8.8 m and 9.7 m between the pressure monitoring point and the vertical projection point of the blast core were obtained, and the shock wave pressure time-history curves at the eight pressure monitoring points were obtained when the elevation difference of ground propagation medium was 30 mm, as shown in Fig. 7.
Fig. 7Shock wave pressure time history curve at different measuring points
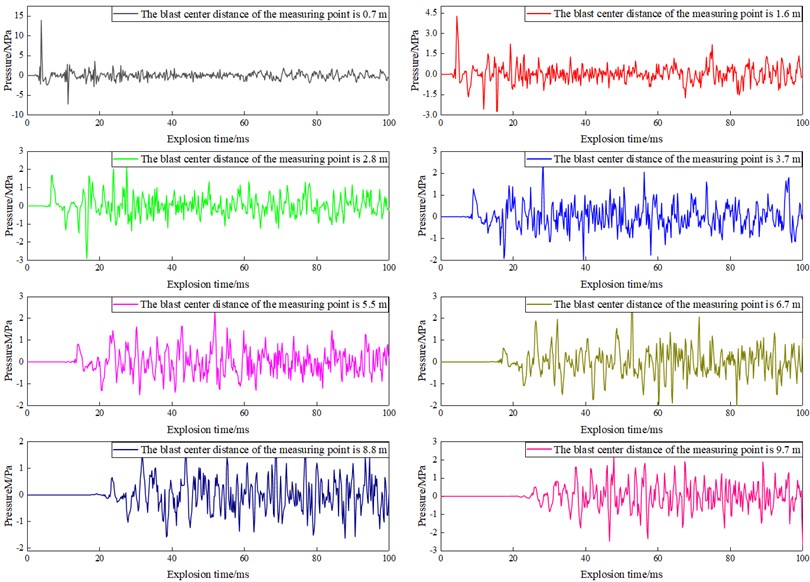
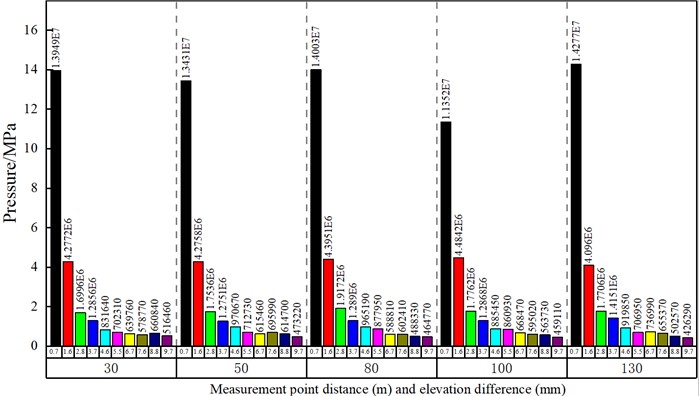
From analysis of the shock wave pressure time history curves at different measuring points, it can be seen that the shock wave pressure peak value gradually decreases with the increase of the distance between the measuring points, and the pressure time history curve gradually becomes irregular. This is mainly because the farther the measuring point is from the center of the sound source, the more complex the interaction between the incident shock wave and the reflected shock wave is, resulting in the irregular incident waveform similar to the quasi pulse. At this time, it will be very difficult to interpret the pressure peak value directly from the obtained shock wave pressure time history curve and the interpretation result will be inaccurate. Therefore, we analyze the cloud chart of shock wave pressure evolution obtained in the simulation process to obtain the accurate time when the shock wave front reaches the measuring point, and then read the shock wave pressure peak value on this basis. Process the shock wave pressure signals obtained at different measuring points with different elevation differences of surface propagation media, and obtain the shock wave pressure peak value, as shown in Fig. 8.
According to analysis the obtained shock wave pressure peak value data, when the ground propagation medium elevation difference changes, the shock wave pressure at different measuring points in the same explosion environment changes significantly, that is, the elevation difference of the terrain and geomorphic environment at the explosion site has a significant impact on the explosion shock wave pressure propagation law. Based on the analysis of the pressure peak data at different measuring points in Fig. 8 combined with the finite element numerical simulation model structure, it is found that the shock wave peak pressure at the measuring point is seriously affected by the measuring point elevation difference, and the greater the elevation difference, the greater the influence on the shock wave peak pressure. The main performance is that when the measuring point is located at the site high position, it will enhance the shock wave peak pressure; when the measuring point is located at the site low position, it will attenuate the shock wave peak pressure. The attenuation strength is positively correlated with the measuring point elevation difference. Therefore, based on the above analysis results, we need to put forward requirements for the regional elevation difference of topography and geomorphology in the test environment in the actual firing range test process. To accurately obtain the shock wave pressure data in the ammunition explosion process, the elevation difference in the test site ground propagation medium area should be as small as possible and keep the site smooth, so as to ensure that the test results have high credibility.
Fig. 8Shock wave pressure peak value under different elevation difference and different measuring point distance
3.2. Analysis of slope ratio influence on shock wave pressure distribution
Using the same finite element modeling method as above, combined with the current shooting range test site environmental characteristics, the blast wave pressure propagation law finite element numerical simulation model in the explosion range with different slope ratios is established. In the model establishment process, considering the actual site test environment, the slope ratios of the numerical simulation model established are 1.746 % (included angle 1°), 3.492 % (included angle 2°) and 5.241 % (included angle 3°) respectively. The included angle definition is shown in Fig. 9.
Fig. 9Included angle θ definition
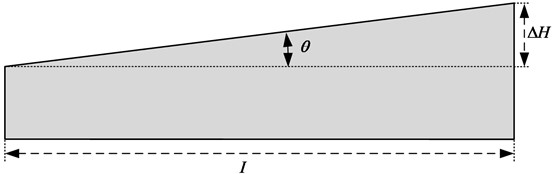
Fig. 10Shock wave pressure evolution nephogram under different explosion times
a) Explosion time 1.6 ms
b) Explosion time 3.4 ms
c) Explosion time 4.8 ms
d) Explosion time 7.2 ms
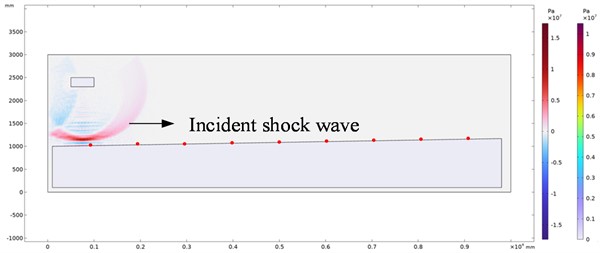
When the test site has a certain slope ratio, the terrain gradually rises from left to right, therefore, when setting the pressure monitoring points, it is not allowed to set the pressure monitoring points at the same horizontal position according to the conventional surface reflection pressure measuring point layout method. The measuring points location needs to be changed with the change of the explosion site height. The horizontal projection distance from the set pressure monitoring point to the sound source center is 1 m, 2 m, 3 m, 4 m, 5 m, 6 m, 7 m and 8 m respectively. The same shock wave pressure loading method as in the previous simulation is adopted. The cloud diagram of shock wave pressure evolution obtained at different propagation times in the simulation process is shown in Fig. 10. (Take the pressure evolution cloud chart with a slope ratio of 1.746 % as an example).
It can be seen from the above shock wave pressure evolution cloud chart that the pressure propagation law will be affected with the increase of the test site slope ratio. It is mainly reflected that with the increase of the test site slope ratio, the shock wave pressure at the same measuring point gradually increases, and the pressure peak value is positively correlated with the site slope ratio. To more accurately analyze the corresponding relationship between the explosion shock wave pressure peak value and the slope ratio, the pressure time history curve under different slope ratios and different measuring point positions is obtained, and the pressure time history curve peak value is extracted. Since there are many time history curves of shock wave pressure obtained in the actual simulation process, it is impossible to display them one by one. Therefore, the time history curves of shock wave pressure at different measuring points with slope ratio 1.746 % are selected for display. The shock wave pressure evolution cloud diagram at different explosion times is shown in Fig. 11. The extracted shock wave pressure peak value is shown in Fig. 12.
Fig. 11Shock wave pressure time history curve at different measuring points
According to the analysis of the shock wave pressure signal peak value at different measuring points above, with the increase of the testing site slope ratio, the peak pressure value at the same measuring point also increases, and the increased degree is related to the distance between the pressure monitoring point and the sound source. Specifically, in the near field, the increase of slope ratio will significantly increase the shock wave pressure peak value, and the influence degree will gradually weaken with the increase of distance between measuring points. Reference [4] carried out a field test and research on the propagation and distribution of the ammunition air explosion shock wave pressure under the terrain with different slope ratios at the test site, and obtained a conclusion similar to that of this study by analyzing the test data. According to the above analysis results, in order to accurately obtain the surface reflected pressure signal in the actual test process, the explosion site slope ratio needs to be required. The ground in the explosion shock wave pressure test area should be kept as horizontal as possible without slope, so that the obtained shock wave pressure signal can have a high reliability.
Fig. 12Shock wave pressure peak value under different slope ratio and different measuring point positions
At present, when engineering testing the shock wave pressure in the explosion field, the uncertainty evaluation of pressure engineering measurement mainly considers the uncertainty introduced by the measurement performance of instruments and meters in the shock wave pressure measurement system, the uncertainty caused by parasitic effects, and the uncertainty introduced by the sensor engineering installation method. The above influence parameters are independent and uncorrelated with each other. By combining the standard uncertainty components and taking the expansion factor as 2, we can obtain twice the expanded uncertainty in the typical shock wave pressure test process. It can be seen from the above analysis that the impact of the topographic and geomorphic parameters of the test site on the pressure test results is not considered in the shock wave pressure engineering measurement uncertainty evaluation, but the impact of the test site environment on the propagation and distribution of blast wave pressure is very significant in the actual test process. In order to improve the evaluation accuracy of the blast wave pressure engineering measurement uncertainty in the blast field, it is necessary to consider the influence of the topographic and geomorphologic parameters of the test site on the evaluation results in the subsequent study.
4. Conclusions
This study aims at the fact that the elevation difference and test site slope ratio will directly affect the shock wave pressure distribution in the ammunition explosion shock wave pressure test process. We use the multi-physical field coupling simulation software to establish the acoustic-solid structure coupling finite element numerical simulation model. The simulation results show that the greater the elevation difference and test site slope ratio, the greater the impact on the pressure peak. Specifically, when the measuring point is located at the test site high position, it will enhance the pressure peak; When the measuring point is at the test site low position, it will attenuate the peak pressure, and the influence degree is positively related to the elevation difference at the measuring point location; Similarly, the slope ratio increase will significantly increase the shock wave pressure peak value, but with the measuring point distance increase, the influence will gradually weaken. It can be concluded that the test site topographic and geomorphic parameters will directly lead to changes in the pressure distribution. Therefore, to improve the test data accuracy and reliability, the elevation difference and test site slope ratio are required to be as small as possible in the actual ammunition explosion shock wave pressure test process, so as to reduce the test error caused by the test site terrain and geomorphic parameters, thus affecting the shock wave pressure test results uncertainty evaluation, which is also a key issue that engineering testers pay more attention to at present. This research results provide theoretical guidance for the test site standardized design, and are of great significance for the explosion field shock wave pressure test results uncertainty evaluation.
References
-
L. Wang, F. Shang, and K. Deren, “Effect of sensor installation angle on measurement of explosion shock wave pressure,” Measurement Science and Technology, Vol. 33, No. 11, p. 115023, Nov. 2022, https://doi.org/10.1088/1361-6501/ac88eb
-
K. Z. Yang and S. Liu, “Research progress of air shock wave propagation and attenuation,” Protection Engineering, Vol. 42, No. 3, pp. 1–10, 2020, https://doi.org/10.3969/j.issn.1006-7051.2020.06.004
-
Q. P. Xu et al., “Numerical simulation of impact of trench terrain on shock wave propagation law,” Engineering Blasting, Vol. 26, No. 6, pp. 23–27, 2020, https://doi.org/10.3969/j.issn.1000-1093.2020.s2.013
-
Q. P. Xu et al., “The influence of terrain on the propagation law of air shock waves from ground explosions,” Journal of Military Engineering, Vol. 41, pp. 96–101, 2020.
-
Y. Deng et al., “Research on fast algorithm of explosion shock wave propagation in complex tunnels,” Journal of Underground Space and Engineering, Vol. 18, No. 4, pp. 1127–1137, 2022.
-
R. H. Ma et al., “The influence of tunnel section shape on the propagation law of explosion shock wave,” Journal of Weapon Equipment Engineering, Vol. 43, No. 2, pp. 92–96, 2022, https://doi.org/10.11809/bqzbgcxb2022.02.014
-
K. Rong, J. Yang, and Z. Y. Chen, “Study on attenuation law of blasting shock wave by soil medium retaining wall,” Engineering Blasting, Vol. 27, No. 6, pp. 1–8, 2021, https://doi.org/10.19931/j.eb.2020.0200
-
X. W. Zhang et al., “Diffraction and overpressure distribution of explosion shock wave behind the explosion-proof wall,” Journal of Beijing University of Technology, Vol. 41, No. 4, pp. 372–379, 2021, https://doi.org/10.15918/j.tbit1001-0645.2020.069
-
X. Liu, Y. X. Sun, and Q. Q. Zhong, “Numerical simulation analysis on propagation law of explosion shock wave at tunnel mouth,” Protection Engineering, Vol. 42, No. 1, pp. 12–17, 2020, https://doi.org/10.3969/j.issn.1674-1854.2020.01.003
-
S. F. Zhu et al., “Numerical simulation of gas explosion shock wave propagation in roadway space,” Mining Engineering Research, Vol. 34, No. 3, pp. 23–30, 2019, https://doi.org/10.13582/j.cnki.1674-5876.2019.03.004
-
J. F. Mao, F. Chen, and P. M. Hou, “Study on the damage effect of blast wave at the tunnel mouth of thermobaric explosives,” Mechanics Quarterly, Vol. 37, No. 1, pp. 184–193, 2016, https://doi.org/10.15959/j.cnki.0254-0053.2016.01.022
-
Y. Q. Wu et al., Theory and Application of Explosive Mechanics. Beijing University of Technology Press, 2021.
-
L. Wang and D. Kong, “Influence of ground impedance on explosive shock wave test accuracy,” International Journal of Impact Engineering, Vol. 171, p. 104395, Jan. 2023, https://doi.org/10.1016/j.ijimpeng.2022.104395
-
P. G. Jin et al., “The propagation law of shock wave pressure in air caused by non ideal explosive explosion,” Science, Technology and Engineering, Vol. 18, No. 22, pp. 184–188, 2018.
-
X. Kong, L. Wang, T. Yu, Z. He, H.E. Luo, and B. Li, “Free-field shock-wave test method for meteorological air cannons,” Measurement, Vol. 189, p. 110456, Feb. 2022, https://doi.org/10.1016/j.measurement.2021.110456
-
B. Chang et al., “Study on characteristics of shock wave field of near ground explosion of moving explosives,” Blasting, Vol. 35, No. 3, pp. 49–54, 2018, https://doi.org/10.3963/j.issn.1001-487x.2018.03.008
-
F. C. Dong et al., “Determination of average velocity in geomorphic unit hydrograph based on topographic and geomorphic parameters,” China Rural Water Resources and Hydropower, Vol. 12, pp. 43–47, 2019.
-
X. P. Yang et al., “Application of terrain slope and elevation variation coefficient in identifying motuo active fault zone,” Seismogeology, Vol. 41, No. 2, pp. 419–435, 2019, https://doi.org/10.3969/j.issn.0253-4967.2019.02.010
Cited by
About this article

This work was funded by National Natural Science Foundation of China, project number: 11372143.
The datasets generated during and/or analyzed during the current study are available from the corresponding author on reasonable request.
Liangquan Wang: conceptualization; data curation; formal analysis; methodology; software; writing-original draft; writing-review and editing; validation. Deren Kong: project administration; writing-review and editing; resources. Fe Shang: writing – review and editing.
The authors declare that they have no conflict of interest.
