Abstract
Oil tank level is an important control parameter in oil depot management. According to the principle that the liquid in the oil tank can absorb the guided wave propagation energy in the tank wall, this paper studied a non-reference detection method of external ultrasonic liquid level switch based on the signal energy change value between the current and the previously liquid level detection signal. The experimental results show that the ultrasonic guided wave with the center frequency of 30 kHz is sensitive and low misjudgment to liquid level detection. According to the experimental setup, the liquid level judgment threshold is set to 0.9890. The influence of the liquid on the guided wave propagation in the tank wall decreases with the frequency of the guided wave increase. Finally, the effectiveness of the proposed method is verified on a diesel oil tank. The research of this paper provides a method for the research of oil tank external liquid level switch technology, and provides an idea for the research of oil tank liquid level measurement based on ultrasonic guided wave.
Highlights
- We propose a non-reference detection method of external ultrasonic liquid level switch based on the signal energy change value between the current and the previously liquid level detection signal.
- The ultrasonic guided wave with the center frequency of 30 kHz is sensitive and low misjudgment to liquid level detection, and the liquid level judgment threshold is set to 0.9890.
- The influence of the liquid on the guided wave propagation in the tank wall decreases with the frequency of the guided wave increase.
- The proposed method is verified on a diesel oil tank.
1. Introduction
Oil tank is above-ground or underground storage units used to contain viscous liquids, which plays a critical role in the petroleum producing and refining industry [1]. Liquid level refers to the level of oil in an oil tank, which is an important monitoring parameter in industrial production [2]. Tank overflow accident is easy to occur during oil tank loading, which will not only pose safety risks to operators, managers, and the facility itself, but also is a risk of releasing toxic materials, fires, and explosions [3]. Therefore, the Liquid Level Switch (LLS) should be installed in the oil tank stipulated by API STD 2350 and IEC 61508 / 61511 industry standards to prevent tank overfilling. LLS is an instrument for monitoring the height of a liquid and tripping a relay contact switch or transmitting a solid-state relay switch output when a maximum, minimum or intermediate level has been reached. The LLS output can then be utilized by other instrumentation to open a valve, illuminate a warning lamp, activate an audible alarm, or switch on/off a pump [4].
There are many LLS technologies including: floating ball LLS [5], cable float LLS [6], capacitive LLS [7], tuning fork LLS [8], ultrasonic LLS [9], external ultrasonic LLS [10], etc. Among them, the external ultrasonic LLS is a new type of level measurement alarm device, which is installed outside the tank, no need to open holes in the tank, and non-contact measure. It is simplicity and safety in use. There are many advantages of the external ultrasonic LLS. It can be used to measure various liquid media in highly toxic, corrosive, high-pressure, various complex working conditions, and explosive gas environments. The installation can be without stopping production, unclearing the tank, and keeping the fire. The installation is convenient and the operation is simple [11]. Therefore, the external ultrasonic LLS has been studied by many scholars, and has been widely used in liquid level monitoring and alarm in various industries.
Hong et al. [12] present an Ultrasonic Guided Wave (UGW) liquid level detection method based on convolutional auto encoder and long short-term memory recurrent neural network, which is greater detection performance and better robustness both in feature extraction and liquid level regression. Raja et al. [13, 14] studied the behavior of UGW when embedded with fluid at different frequency using the finite element method and experiment. The results show that low frequency is preferred for measurement of level with high sensitivity but low range, and high frequency is preferred for measurement of level with lower sensitivity but higher range using the F(1, 1) mode. Matsuya et al. [15] presented a liquid level measurement method utilizing wedge wave, it is demonstrated that the mode 1 wedge wave is suitable for the liquid level measurement as for its slowness and clear signal in the water, and the liquid level is proportional to the traveling time of the mode 1 wedge wave for interface echo method and the end echo method. Gao et al. [16] built a non-contact, fixed-point, liquid level monitoring system based on the ultrasonic impedance method, and studied the relationship between the length of the near-field area and the ultrasonic echo energy. Xue et al. [17] studied the internal wedge parameters of the Ultrasonic Lamb Wave Liquid-Level sensor, it is indicated that the most suitable working mode as when 3 MHz·mm and the corresponding ultrasonic incident angle is 27.39◦, The wedge thickness should be as odd multiples of 1/4 wavelength. Zhao [18] provided an air-coupled ultrasonic Lamb wave liquid level detection method based on empirical mode decomposition and deep belief network for a steel oil tank of 5 mm thickness.
The current research shows that there are still some limitations in the use of the external ultrasonic LLS. For example, it is need recalibrated after a period of use, and the signal in the determined state is obtained as the judgment reference for liquid level detection. Moreover, the influence of environmental noise will also cause misjudgment of the liquid level.
This paper studies a non-reference detection method of external ultrasonic LLS, which uses the Signal Energy Change Value (SECV) between the current and the previously Liquid Level Detection Signal (LLDS) to determine whether the liquid level reaches the monitoring height. This method does not need to obtain the reference signal of liquid level discrimination in advance, thus simplifying the use of the system and reducing the influence of system error on liquid level discrimination. And the average of the SECVs of multiple LLDSs, which is used to judge whether the liquid level reaches the monitoring height, thus reducing the impact of environmental noise on the liquid level discrimination. The rest of this paper is organized as follows, in section 2, the principle of non-reference detection method for external ultrasonic LLS is proposed. The proposed method is experimental researched in section 3, and validated on a diesel oil tank in section 4. Finally, the conclusion is made in section 5.
2. The principle of non-reference detection method for external ultrasonic LLS
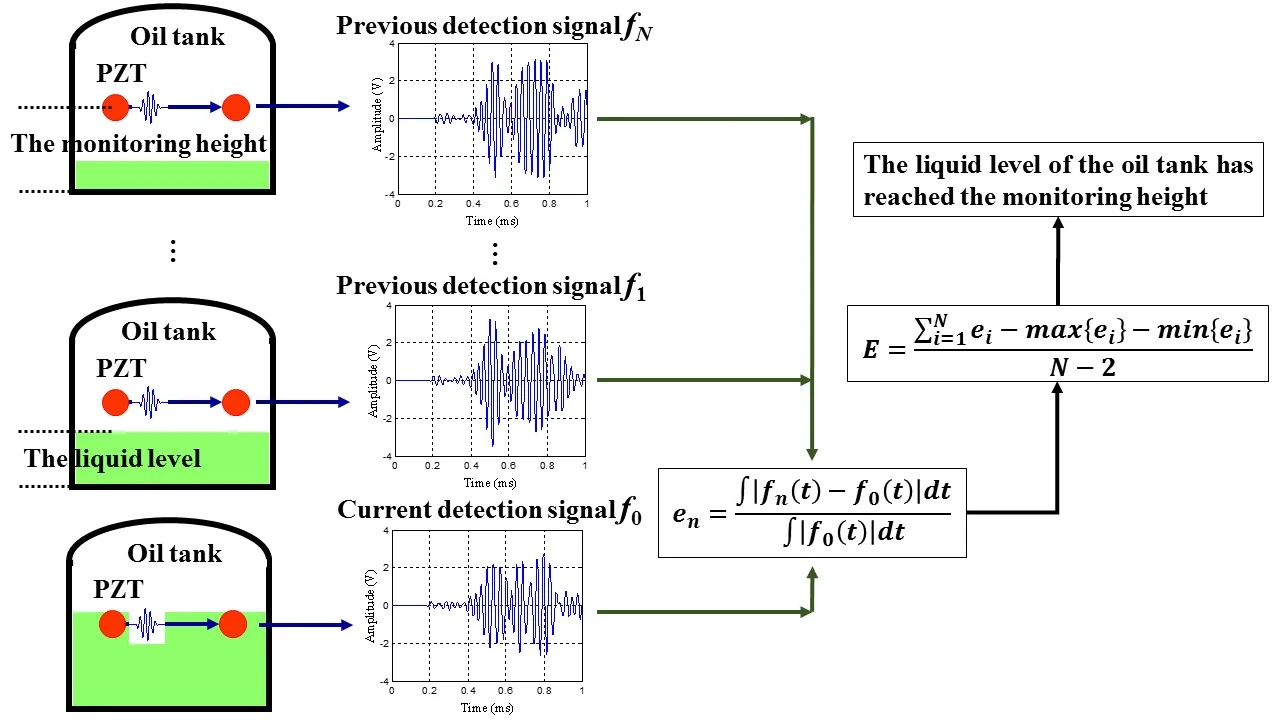
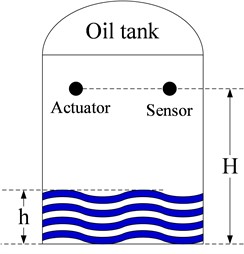
UGW is a kind of mechanical wave propagating in the elastic medium with finite boundary size [19]. In the process of UGW propagation, when encountering at the interface of different media, the acoustic impedance changes, resulting in reflection and transmission of it [20]. Therefore, the UGW can propagate in the wall of metal oil tank. When the oil tank is loaded with liquid, the energy of UGW propagated in the tank wall will leak into the liquid, that is, the liquid in the oil tank will affect the amplitude of the guided wave propagated in the tank wall. In other words, the attenuation of UGW in the liquid tank is greater than that in the empty tank. As shown in Fig. 1, the liquid level of a metal oil tank needs to be monitored is H, and the actual liquid level of oil in the tank is h. Then, a pair of UGW excitation and sensing elements are arranged horizontally outside the tank wall at the liquid level height H.
When the oil tank LLS monitoring system starts to operate, the UGW is excited in the oil tank wall structure using the UGW excitation element, and the UGW sensing element collects the UGW signal propagating in tank wall, which is marked as the LLDS (1, 2, 3, …, , 3). In this start time, the oil liquid level is below the monitoring height . The detection signal is also stored in the oil tank LLS monitoring system. Then, the UGW signal propagating in the oil tank wall is continually collected according to the set sampling interval, and the LLDS at the current time is marked as . After that, the SECVs of the current LLDS and the previous LLDSs saved is the system are calculated respectively:
where is the SECV between the detection signal and , is the LLDS at the current moment, (1, 2, 3, …, , 3) is the previous LLDS saved in the monitoring system, is the signal sampling time.
Fig. 1Schematic diagram of the non-reference detection method for external ultrasonic LLS
In order to reduce the impact of environmental noise, the average value E of SECV (1, 2, 3, …, ) is calculated after removing the maximum and minimum value, which is used to judge whether the liquid level reaches the monitoring height:
According to the previous theoretical analysis, the UGW is mainly propagated in the wall of the oil tank if the liquid level of the oil tank is below the monitoring height . So, the change of the LLDS is small, that is, the truncated average value of the SECV is also small. The energy of the UGW will leak into the liquid in the tank through the steel plate if the liquid level of the oil tank is above the monitoring height , which will cause the energy attenuation of the detection signal. That is, the truncated average value of the SECV is large. Therefore, when the truncated average value of the SECV is greater than the set threshold, it means that the liquid level of the oil tank has reached the monitoring height .
When the truncated average value of the SECV is less than the set threshold value, it means that the liquid level of the oil tank is below the monitoring height . At this time, the previous LLDS is shifted and saved after discard the earliest saved LLDS :
After that, the UGW signal propagating in the oil tank wall is continue to collected. Then, the liquid level is judged according to the above signal processing flow. In this method, there is only LLDSs need to be stored in the monitoring system.
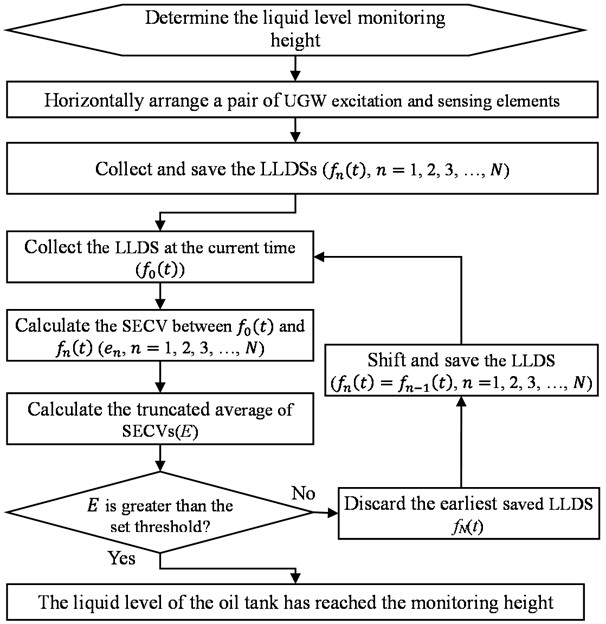
To sum up, the implementation process of the non-reference detection method for external ultrasonic LLS is shown in Fig. 2. Firstly, a pair of UGW excitation and sensing elements are arranged at the monitoring liquid level H. When the monitoring system starts to run, collects and saves LLDSs. In the second, collecting the LLDS at the current time and calculating its SECV relative to the previous detection signals. Finally, judging the liquid level whether reaches the set monitoring height according to the truncated average of SECVs.
Fig. 2The implementation process of the non-reference detection method for external ultrasonic LLS
3. Experimental system
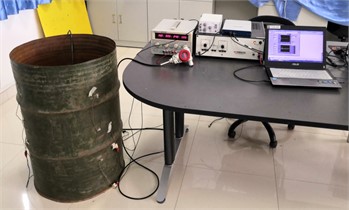
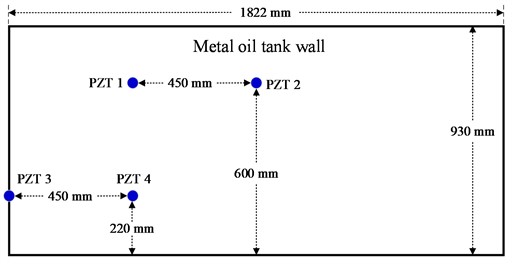
The 200L oil steel drum commonly used in the oil depot is selected to simulate the oil tank, and its size is Φ 580 mm × 930 mm (diameter × Height). PZT-5A piezoelectric ceramic sheet is used for UGW excitation and sensing. The diameter of piezoelectric sensor is 8 mm and the thickness is 0.4 mm. The experimental equipment is mainly composed of computer, NI USB-6366 portable data collector, KROHN-HITE 7500 broadband power amplifier, and MIK-P260 input liquid level meter. The whole experimental system is shown in Fig. 3.
Assuming that the liquid level to be monitored is 600 mm high, a pair of PZT-5A piezoelectric sensors, marked PZT 1 and PZT 2 respectively, are arranged at the outer side of the tank wall 600 mm from the bottom of the tank as the excitation and sensing elements of UGW. In addition, another pair of PZT-5A piezoelectric sensors are arranged at 220 mm from the bottom of the oil tank, which is used to study the central frequency of the UGW excitation signal, and the threshold of SECV. This pair of PZT-5A piezoelectric sensors are labeled as PZT 3 and PZT 4.
4. Frequency and threshold selection
In this section, PZT 3 is used as the UGW excitation element, and PZT 4 is used as the UGW sensing element. The UGW excitation signal uses sine modulated five waves peak narrowband signal. The amplitude of the UGW excitation signal is ± 70 V, and the center frequency is from 30 kHz to 150 kHz with the 5 kHz interval. The sampling frequency of the UGW detection signal is 2 MHz with the sampling length is 2000 sampling points, the trigger voltage is 6 V, and the pre-acquisition length is 200 sampling points. The signal averaging method is used to increase the signal-to-noise ratio with the average time is 100, The liquid level heights in this research are 100 mm, 150 mm, 200 mm, 220 mm, 250 mm, 300 mm, 350 mm and 400 mm respectively.
Fig. 3Illustration of the validation experimental for the non-reference detection method
a) Experiment setup (picture taken during authors experiment)
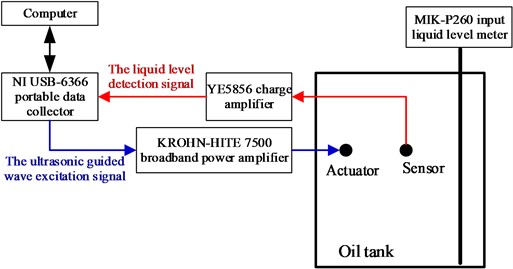
b) Block diagram of the experimental system
c) The positions of UGW excitation and sensing elements
Fig. 4The UGW excitation signal of 30 kHz
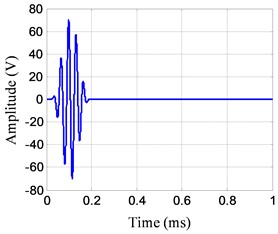
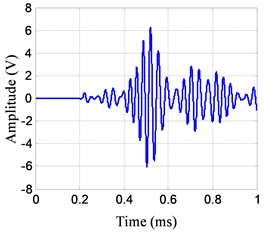
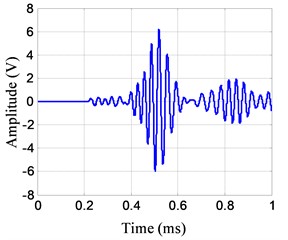
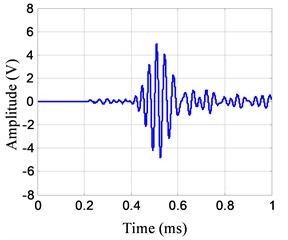
Fig. 5The UGW detection signal in the empty tank state with the center frequency of 30 kHz
The LLDS with the center frequency of 30 kHz is used as an example to describe the signal processing flow in detail. The UGW excitation signal is shown in Fig. 4.
Firstly, the UGW signal propagated in the oil tank wall is collected as the detection signal in the empty tank state, as shown in Fig. 5.
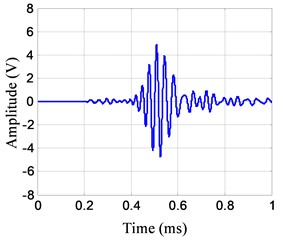
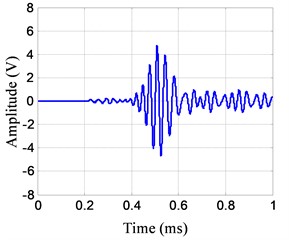
Fig. 6 shows the UGW detection signals at different liquid level heights.
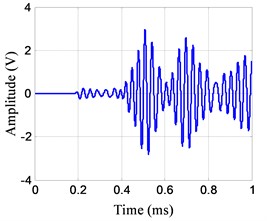
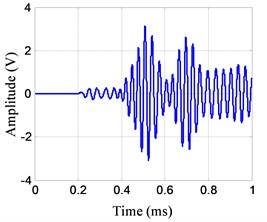
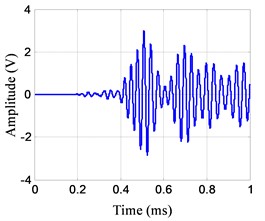
Fig. 6The UGW detection signal in the empty tank state with the center frequency of 30 kHz
a) 100 mm
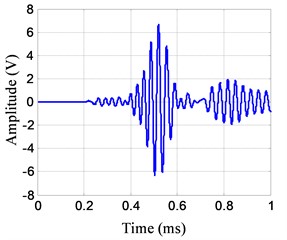
b) 150 mm
c) 200 mm
d) 220 mm
e) 250 mm

f) 300 mm
g) 350 mm
h) 400 mm
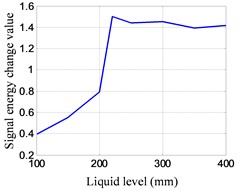
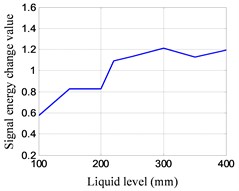
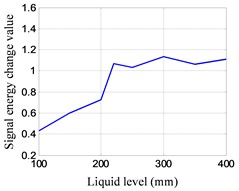
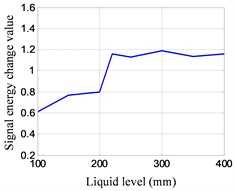
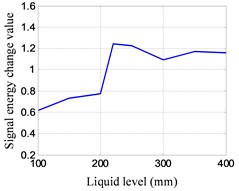
According to Eq. (1), the SECVs between the detection signals of different liquid level and the detection signal of the empty tank state are calculated, as shown in Fig. 7.
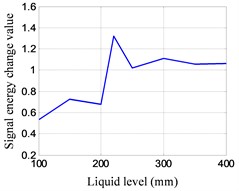
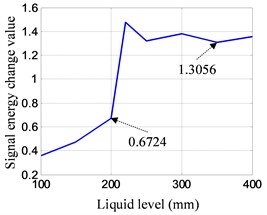
Fig. 7The SECV between the detection signals of different liquid level and the detection signal of the empty tank state
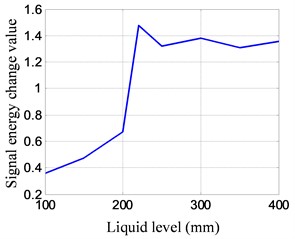
In Fig. 7, the SECV of 100 mm liquid level is 0.3591. The SECV of 150 mm liquid level is 0.4727. The SECV of 200 mm liquid level is 0.6724. The SECV of 220 mm liquid level is 1.4748. The SECV of 250 mm liquid level is 1.3212. The SECV of 300 mm liquid level is 1.3781. The SECV of 350 mm liquid level is 1.3056. The SECV of 400 mm liquid level is 1.3560.
Comparing the UGW detection signal and its SECV at different liquid level, which can be found that, the amplitude change of the UGW detection signal is small, and the SECV is smaller than 0.7, when the liquid level is below the monitoring height (220 mm). When the liquid level is above the monitoring height (220 mm), the amplitude change of the UGW detection signal is great, and the SECV of the UGW detection signal is larger than 1.3. When the liquid level passes through the monitoring height (200 mm to 220 mm), the SECV obviously jumps. The SECV of above monitoring liquid level is all greater than that below monitoring liquid level. Therefore, this characteristic can be used to judge the oil tank liquid level reaches the monitoring liquid level.
Fig. 8The SECVs at different signal center frequencies and liquid level heights
a) 35 kHz
b) 40 kHz
c) 45 kHz
d) 50 kHz
e) 55 kHz
f) 60 kHz
g) 65 kHz
h) 70 kHz
i) 75 kHz
j) 80 kHz
k) 85 kHz
l) 90 kHz
m) 95 kHz
n) 100 kHz
o) 105 kHz
p) 110 kHz
q) 115 kHz
r) 120 kHz
s) 125 kHz
t) 130 kHz
u) 135 kHz
v) 140 kHz
w) 145 kHz
x) 150 kHz
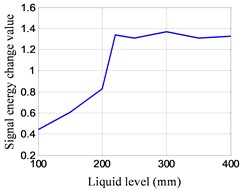
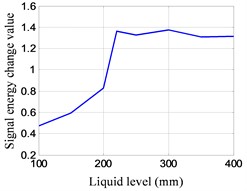
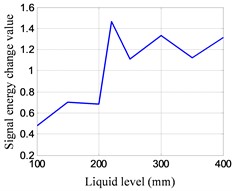
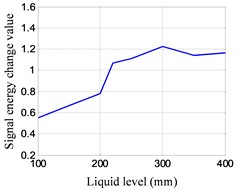
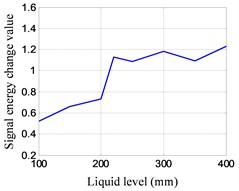
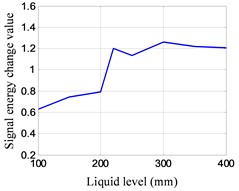
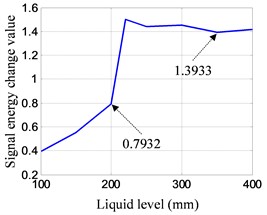
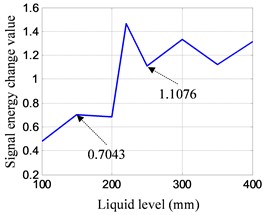
According to the above signal processing flow, the other UGW detection signals of different signal center frequencies and liquid levels are processed to obtain the SECVs , as shown in Fig. 8.
The differences of SECV between the 220 mm and 200 mm liquid level at each signal center frequency are calculated, as shown in Fig. 9.
Fig. 9The differences of SECV between the 220 mm and 200 mm liquid level at different signal center frequencies
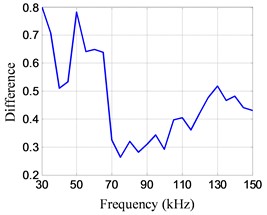
It can be seen from Fig. 9 that the SECV difference (0.8024) of 30 kHz center frequency between the liquid level above and below the monitoring height is the largest. Subsequent, the SECV differences of 50 kHz and 35kHz between the liquid level above and below the monitoring height are 0.7837 and 0.7079 respectively. It can be concluded that the UGW of 30 kHz is the most sensitive to liquid level detection.
According to Fig. 8, the SECV difference between the minimum value of the liquid level above monitoring height and the maximum value of the liquid level height below the monitoring height can be calculated, as shown in Fig. 10. It can be obtained that the SECV difference of 30 kHz 35 kHz and 50 kHz are 0.6332 0.6001 and 0.4033. It is indicated that the UGW wave of 30 kHz is lowest misjudgment on the liquid level detection.
Fig. 10The SECV difference between the minimum value of the liquid level above monitoring height and the maximum value of the liquid level height below the monitoring height at different signal center frequencies
a) 30 kHz
b) 35 kHz
c) 50 kHz
In conclusion, the center frequency of the UGW excitation signal is selected as 30 kHz in the next section of the experimental verification.
It can be seen from Fig. 10(a) that when the center frequency of the UGW is 30 kHz, the minimum value of the SECV as the liquid level above the monitoring height is 1.3056, and the maximum value of the SECV as the liquid level below the monitoring height is 0.6724. The average value (0.9890) of these two values is calculated as the liquid level judgment threshold for subsequent experiment.
5. Experimental verification
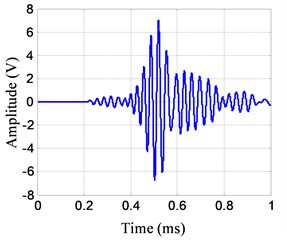
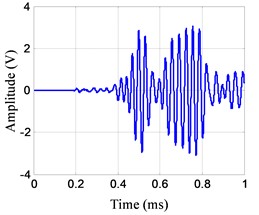
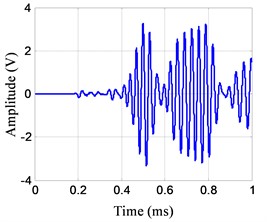
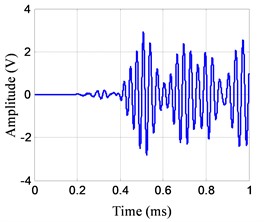
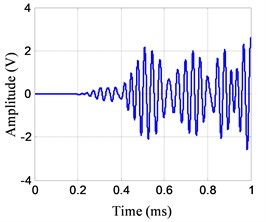
In this section, PZT 1 is used as the UGW excitation element, and PZT 2 is used as the UGW sensing element. The UGW excitation signal is sine modulated five wave peaks narrowband signal with the center frequency is 30 kHz and the amplitude is ± 70 V. The sampling frequency of the UGW detection signal is 2 MHz with the trigger voltage is 6 V. The sampling length is 2000 sampling points with 200 pre-acquisitions. There are 5 LLDSs stored in the monitoring system. The monitoring system continuously detects the liquid level of oil tank. For example, when the liquid level is 200 mm, the collected LLDS is shown in Fig. 11, and the previous stored five LLDSs are shown in Fig. 12.
Fig. 11The detection signal at 200 mm liquid level
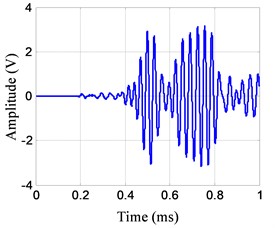
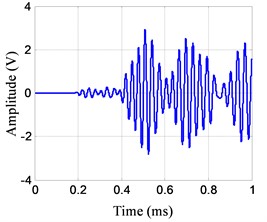
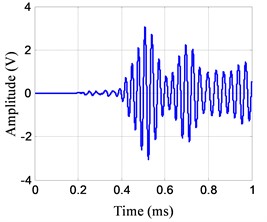
Fig. 12The previous stored five LLDSs of 200 mm
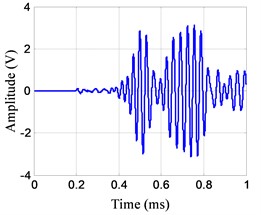
a)
b)
c)
d)

e)
According to Eq. (1), the SECVs between the current LLDS and the previous five LLDSs saved by the system are calculated as = 0.0476, = 0.0685, = 0.0869, = 0.1018, = 0.1341. After that, the truncated average of the five SECVs is calculated by Eq. (2). The average value after removing the maximum and minimum value (= 0.1341, = 0.0476) is 0.0857, which is not greater than the set threshold (0.9890). Therefore, it is judged that the liquid level does not reach the monitoring height. Then, the previous LLDS is shifted and saved by Eq. (3) after the earliest saved LLDS is discard. The oil tank liquid level is monitored continually.
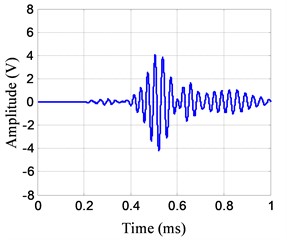
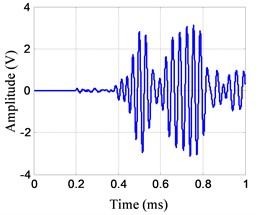
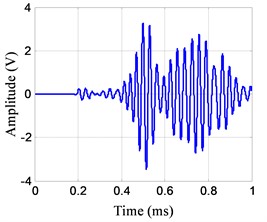
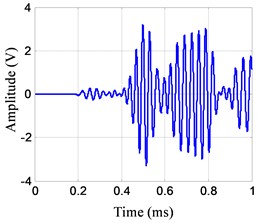
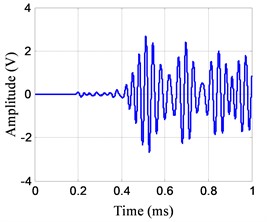
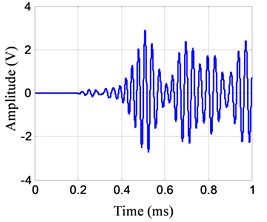
When the liquid level reaches monitoring height (600 mm), the collected LLDS is shown in Fig. 13, and the previous stored five LLDSs are shown in Fig. 14.
The SECVs between the current LLDS and the previous five LLDSs are calculated as = 0.9983, = 1.1606, = 1.1892, = 1.1489, = 1.1911. After that, the average SECV after removing the maximum and minimum value (= 1.1911, = 0.9983) is 1.1662, which is greater than the set threshold (0.9890). Therefore, it is judged that the liquid level has reached the monitoring height.
Fig. 13The detection signal at 600 mm liquid level
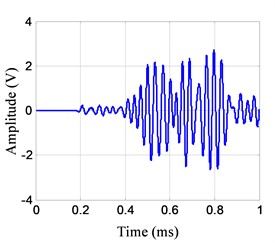
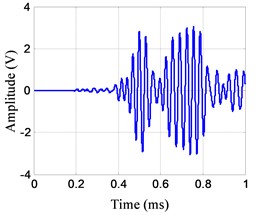
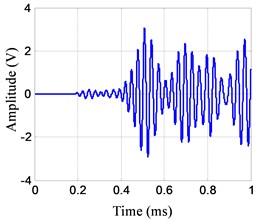
Fig. 14The previous stored five LLDSs of 600 mm
a)
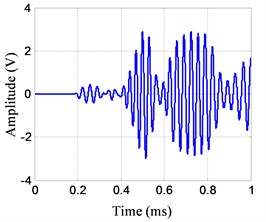
b)
c)
d)
e)
The results indicate that the non-reference detection method of external ultrasonic LLS can be used to monitor the liquid level whether reached the monitoring height. As for the diameter of piezoelectric sensor is 8 mm in this experiment, the maximum repeatability measurement error of this method is ±4 mm, which is conform to the value specified by API STD 2350 and IEC 61508 / 61511. There are four levels of repeatability measurement error: ± 1 mm, ± 2 mm, ± 5 mm, and ± 10 mm according to API STD 2350 and IEC 61508 / 61511. Compared to other measurement techniques, the repeatability measurement error of the proposed method is not influenced by the monitoring height [21].
6. Validation of the proposed method on an oil tank
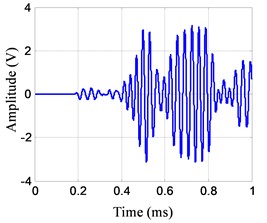
A 20 m3 diesel oil tank is used to test and verify the proposed method, as shown in Fig. 15. The validation equipment and parameter settings are consistent with the section 3.3. The monitoring liquid level is 1500 mm. When the liquid level is 1000 mm, the collected LLDS is shown in Fig. 16, and the previous stored five LLDSs are shown in Fig. 17.
Fig. 15Illustration of the validation experimental performed on the diesel oil tank
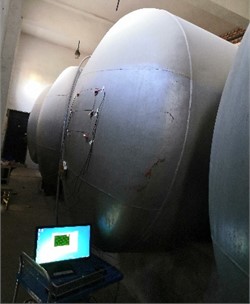
Fig. 16The detection signal at 1000 mm liquid level
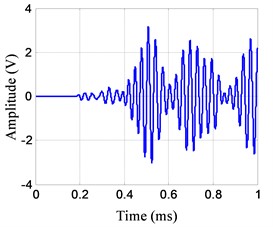
Fig. 17The previous stored five LLDSs of 1000 mm
a)
b)
c)
d)
e)
According to Eq. (1), the SECVs between the current LLDS and the previous five LLDSs are calculated as = 0.2384, = 0.3248, = 0.3695, = 0.3392, = 0.1762. After that, the truncated average of the five SECVs is calculated by Eq. (2). The average value after removing the maximum and minimum value is 0.3008, which is not greater than the set threshold (0.9890). Therefore, it is judged that the liquid level does not reach the monitoring height. Then, the previous LLDS is shifted and saved by Eq. (3) after the earliest saved LLDS is discard. The oil tank liquid level is monitored continually.
When the liquid level reaches monitoring height (1500 mm), the collected LLDS is shown in Fig. 18, and the previous stored five LLDSs are shown in Fig. 19.
Fig. 18The detection signal at 1501 mm liquid level
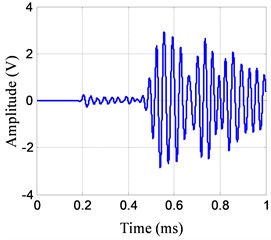
Fig. 19The previous stored five LLDSs of 1501 mm
a)
b)
c)
d)
e)
The SECVs between the current LLDS and the previous five LLDSs are calculated as = 1.4457, = 1.3428, = 1.4986, = 1.4797, = 1.4952. After that, the average SECV after removing the maximum and minimum value is 1.4735, which is greater than the set threshold (0.9890). Therefore, it is judged that the liquid level has reached the monitoring height.
7. Conclusions
According to the principle that the UGW propagated in the oil tank wall will leak into the liquid, this paper proposed a non-reference detection method of the external ultrasonic LLS. Through the experimental research, it is concluded that the UGW of 30 kHz is the most sensitive and lowest misjudgment to liquid level detection, and the liquid level judgment threshold is set to 0.9890. When the frequency of the UGW increases, the influence of the liquid on its propagation in the tank wall decreases. Finally, the effectiveness of the proposed method is verified on a diesel oil tank. The research in this paper provides a method for the technology of external ultrasonic LLS, and an idea for the oil tank liquid level measurement based on UGW. However, this research has only carried out a preliminary verification of the principle. And further comprehensive experimental research is needed before practical application.
References
-
T. Salem, H. Maaly, and A. Abdelbaset, “Analysis of above-ground steel storage tanks resting over piles or stone columns,” Frattura ed Integrità Strutturale, Vol. 15, No. 57, pp. 40–49, Jun. 2021, https://doi.org/10.3221/igf-esis.57.04
-
Y. Fu, W. Li, S. Chen, Z. Wang, and Y. Liu, “Experimental and simulation study on the capacitive liquid level gauge of LNG vehicular cylinder,” Measurement, Vol. 164, p. 107930, Nov. 2020, https://doi.org/10.1016/j.measurement.2020.107930
-
F. Qin et al., “Leakage detection of oil tank using terahertz spectroscopy,” Science China Technological Sciences, Vol. 64, No. 9, pp. 1947–1952, Sep. 2021, https://doi.org/10.1007/s11431-021-1884-1
-
D. Sengupta, M. Sai Shankar, P. Saidi Reddy, R. L. N. Sai Prasad, and K. Srimannarayana, “Liquid level switch using Bragg grating,” Optoelectronics and Advanced Materials, Vol. 4, No. 7, pp. 939–942, 2010.
-
S. Sundararaj, P. Krishnakumar, V. R. Anirudh, L. C. Shikhar, G. Surendhar, and V. Vijay, “Effect of water pressure and temperature on spherical float of level sensing auto drain valve,” Materials Today: Proceedings, Vol. 49, No. 5, pp. 1490–1497, 2022, https://doi.org/10.1016/j.matpr.2021.07.235
-
K. Svitana and J. South, “An approach for passive removal of residual lnapl from groundwater,” Groundwater Monitoring and Remediation, Vol. 39, No. 2, pp. 64–70, May 2019, https://doi.org/10.1111/gwmr.12314
-
R. T. Bento, R. W. O. Silva, L. A. Dias, A. Ferrus Filho, and A. J. C. Pitta, “Design, development and application of a real-time capacitive sensor for automatically measuring liquid level,” SN Applied Sciences, Vol. 1, No. 7, pp. 1–8, Jul. 2019, https://doi.org/10.1007/s42452-019-0770-3
-
H. Yang, Y. Rao, L. Li, H. Liang, T. Luo, and G. Xin, “Research on tuning fork dimension optimization and density calculation model based on viscosity compensation for tuning fork density sensor,” Mathematical Problems in Engineering, Vol. 2020, pp. 1–17, Oct. 2020, https://doi.org/10.1155/2020/7960546
-
S. Huang et al., “An optimized lightweight ultrasonic liquid level sensor adapted to the tilt of liquid level and ripple,” IEEE Sensors Journal, Vol. 22, No. 1, pp. 121–129, Jan. 2022, https://doi.org/10.1109/jsen.2021.3127127
-
W. Gao, W. Liu, F. Li, and Y. Hu, “Analysis and validation of ultrasonic probes in liquid level monitoring systems,” Sensors, Vol. 21, No. 4, p. 1320, Feb. 2021, https://doi.org/10.3390/s21041320
-
C. Baldeon-Perez, B. Meneses-Claudio, and A. Delgado, “Water level monitoring and control system in elevated tanks to prevent water leaks,” International Journal of Advanced Computer Science and Applications, Vol. 12, No. 2, pp. 437–442, 2021, https://doi.org/10.14569/ijacsa.2021.0120255
-
X. Hong, B. Zhang, Y. Liu, H. Qi, and W. Li, “Deep‐learning‐based guided wave detection for liquid‐level state in porcelain bushing type terminal,” Structural Control and Health Monitoring, Vol. 28, No. 1, Jan. 2021, https://doi.org/10.1002/stc.2651
-
N. Raja and K. Balasubramaniam, “Experimental study on dispersion effects of F(1,1) wave mode on thin waveguide when embedded with fluid,” Sensors, Vol. 21, No. 2, p. 322, Jan. 2021, https://doi.org/10.3390/s21020322
-
N. Raja, K. Balasubramaniam, and S. Periyannan, “Ultrasonic waveguide based level measurement using flexural mode F(1,1) in addition to the fundamental modes,” Review of Scientific Instruments, Vol. 90, No. 4, p. 045108, Apr. 2019, https://doi.org/10.1063/1.5054638
-
I. Matsuya, Y. Honma, M. Mori, and I. Ihara, “Measuring liquid-level utilizing wedge wave,” Sensors, Vol. 18, No. 1, Dec. 2017, https://doi.org/10.3390/s18010002
-
W. Gao, W. Liu, Y. Hu, and J. Wang, “Study of ultrasonic near-field region in ultrasonic liquid-level monitoring system,” Micromachines, Vol. 11, No. 8, p. 763, Aug. 2020, https://doi.org/10.3390/mi11080763
-
W. Xue, W. Gao, W. Liu, H. Zhang, and R. Guo, “Impact of wedge parameters on ultrasonic lamb wave liquid-level sensor,” Sensors, Vol. 22, No. 13, p. 5046, Jul. 2022, https://doi.org/10.3390/s22135046
-
Q. Zhao, “Liquid level intelligent detection for oil tank based on empirical mode decomposition and deep belief network,” Sensors and Materials, Vol. 34, No. 7, p. 2897, Jul. 2022, https://doi.org/10.18494/sam3930
-
H. Miao and F. Li, “Shear horizontal wave transducers for structural health monitoring and nondestructive testing: a review,” Ultrasonics, Vol. 114, p. 106355, Jul. 2021, https://doi.org/10.1016/j.ultras.2021.106355
-
C. J. Lissenden, Y. Liu, and J. L. Rose, “Use of non-linear ultrasonic guided waves for early damage detection,” Insight – Non-Destructive Testing and Condition Monitoring, Vol. 57, No. 4, pp. 206–211, Apr. 2015, https://doi.org/10.1784/insi.2015.57.4.206
-
K. K. Rajan, B. Aruna, S. Anju, P. R. Pedada, S. Verma, and R. Bhattacharyay, “Design development and testing of mutual inductance type level sensor for molten lead-lithium alloy,” Fusion Engineering and Design, Vol. 168, p. 112650, Jul. 2021, https://doi.org/10.1016/j.fusengdes.2021.112650
About this article

This work was supported by the National Natural Science Foundation of China (No. 51705530) and the Air Force Logistics College Youth Research Fund Project (No. KQQNJJ21-007).
The datasets generated during and/or analyzed during the current study are available from the corresponding author on reasonable request.
Bin Liu: Conceptualization, data curation, funding acquisition, methodology, validation and writing. Yunpeng Xiao, Li Wang, Wenjuan Wang and Jianqiang Hu help with research.
The authors declare that they have no conflict of interest.
