Abstract
The performance analysis of wind turbine systems should be considered when calculating the wind speed relative to the wind turbine structure, and is essential for wind turbine design. Since the conditions are precarious in transient state and the operating environments are challenging, the wind turbine is a complex, multivariate, nonlinear system. This paper presents a novel dynamic response test method for wind turbines based on three-dimensional digital speckle measurement. This method use a real-time speckle image collection of objects in various stages using binocular stereo vision to perform stereo matching of deformation points on object surface. A digital image correlation algorithm is used to rebuild three-dimensional space coordinates of matching points so as to achieve wind turbine dynamic response. A laboratory-scale experimental platform is constructed to test the dynamic response of the wind turbine system. In order to verify the accuracy of the proposed method, a three-dimensional model of a wind turbine is built. With dynamic structure response process adopted to carry out dynamic analysis and compare theoretical results with test results, the results vary by less than 10 %, indicating that the test method presented in the paper is feasible and effective.
Highlights
- This article presents a novel dynamic response test method for wind turbines based on three-dimensional digital speckle measurement.
- The three-dimensional model for wind turbine in experiment is set up to carry out dynamic response analysis of wind turbine based on ANSYS.
- The dynamic displacement response of hub on wind turbine at different wind speed increases with the increase of wind speed and decrease after the wind speed is up to rated wind speed.
1. Introduction
Since the global energy crisis and environmental pollution are increasingly serious problems, wind turbine must enter into the large scale development stage. Operating for years in stochastic wind fields, wind turbines are subject to frequent disturbances and dynamic excitations with extremely complex dynamic characteristics [1]. Accordingly, it is necessary to consider structural dynamic behaviors and dynamics responses under transient, dynamic loads when designing wind turbine generators [2].
In recent years, many researchers have investigated the dynamic response of wind turbines. Murtagh [3] studied the forced vibration response of wind turbine tower under wind loads, using a dynamic coupling relation between the random sampled wind load and the tower. Yanfeng Wang [4] combined dynamic response analysis with MSDC to analyze and test the extent of damage to a blade. Javad Baqersad [5] measured dynamic strain of a rotor using stereophotogrammetry. Li Rennian [6] obtained blade surface pressure data by installing belt pressure sensors on wind turbine blades to study the pressure distribution characteristics and influencing factors under a three-dimensional rotational effect. Li Ming [7] took a similar blade model on a 1.5 MW wind driven generator set and simulated a natural wind field using a vehicle to obtain load data of every section of the blade and the output power of the set, the result was consistent with the BLADED simulation result. Bai Yefei [8] experimentally studied the stress-strain characteristics of a wind turbine blade in running state in the opening section of a straight flow, low speed wind tunnel using a stress-strain wireless telemetry for rotary machinery. At present, the dynamic analysis of wind turbine systems has focused on the dynamic coupling response of individual parts or tower/hub-to-blade, less research has focused on the dynamic response of the entire wind turbine system (i.e., tower, hub and nacelle).
This paper combines the digital image correlation method with binocular stereo vision technology to achieve displacement response of a wind turbine. Speckle images are stereo matched before and after deformation of the specimen surface through use of a digital image correlation algorithm and geometrical point tracking. A three-dimensional model for wind turbines is detailed for use in analyzing dynamic response with respect to dynamic structure response. Then numerical analysis results and test results are compared, with errors no more than 10 %.
2. Introduction to wind turbine system
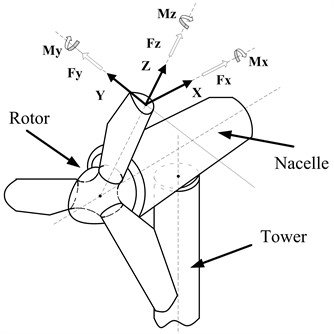
Wind turbine system is primarily composed of rotor, nacelle and tower, with drive system as the dominant part in nacelle. A wind turbine captures wind power by using rotating blades and converts it to electric power by a generator, thus blade is the most important stress part in wind turbine system, and the load on other component parts in is due mainly to load on blade [9-11]. When wind turbine is in operating state, the stress on blade includes gravitational load, centrifugal load and wind load [12]. The coordinate system for stress and deformation of blade is as shown in Fig. 1, in which is along blade span wise direction, is normal to and direction point in tower's direction, is determined by right hand grip rule and normal to main axis of nacelle.
Fig. 1The coordinate system of blade
Since the alternating load on blade can generate greater dynamical stress, it will lead to fatigue failure of structure and shorten life span of the system and have adverse influence on performance and stability of wind turbine generator set [13]. However, the wind in nature is precarious in time and space, which makes the wind’s effect on wind turbine very complex. It is obvious that the research of dynamic response of wind turbine structure under the action of various loads is one of key issues to be solved in design process of wind turbine [14]. With the extensive application of high power wind turbine at megawatt level, the rotor diameter of the blade is up to hectometer in order of magnitude to satisfy the requirement to capture wind energy. And at the same time, the blade is also subjected to strong wind thrust and the structural dynamics problem of wind turbine become more obvious. Therefore, it is more important to reveal the dynamic behavior of the wind turbine system [15]. Due to the consumption of a large amount of financial resource and material resource and requiring a long time, it is difficult to carry out the test of dynamic response of wind turbine generator system under the present condition. Therefore, the paper takes the laboratory wind turbine model as an object to carry out the test of dynamic response.
3. Introduction to wind turbine system
The paper adopts three-dimensional digital speckle deformation measurement system to test the dynamic response of wind turbine. XTDIC system is an optical non-contact type three-dimensional deformation measurement system which used for the measurement and analysis of surface appearance, displacement and strain and the obtainment of the three dimensional strain field data, with visual display of measurement result. This method is characterized by high precision, fast speed, non-contact, three-dimensional measurement in field [14], having overcome the deficiency of traditional strain gage measurement method: high measurement cost, low anti-interference and inaccurate measurement, which has already aroused extensive attention of scholars both here and abroad [16].
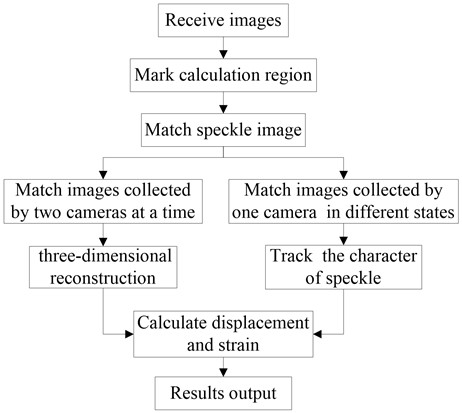
Digital speckle correlation method was presented by Ichiro YAMAGUTI and Peters respectively at the same time in 1980s [17]. Three-dimensional digital speckle deformation measurement together with digital image correlation technology and binocular stereo vision technology are to perform matching and analysis of speckle images before and after deformation of specimen surface by digital image correlation method and track the movement of the geometrical points on specimen surface to achieve test and analysis of appearance and displacement and strain of structure surface and obtain the three dimensional strain field data. The test precision is less than 10 um and ensures precision of test result of wind turbine. Compared with traditional speckle interferometry, digital speckle may use white speckle for irradiation to directly obtain deformation information from artificial or natural special field randomly distributed on object surface [18-20]. XTDIC is an optical non-contact dynamic deformation measurement system composed of measuring probe, control box and a high performance computer, with control box to achieve the signal linking of software and hardware. The operating principle of the entire system is as shown in Fig. 2 [21].
Fig. 2The operating principle of three-dimensional digital speckle deformation measurement
3.1. Digital image correlation method
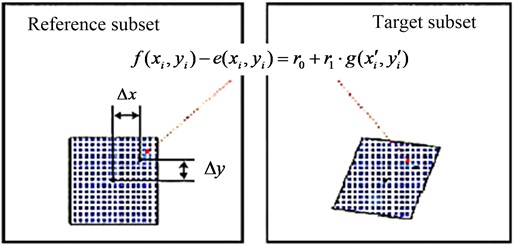
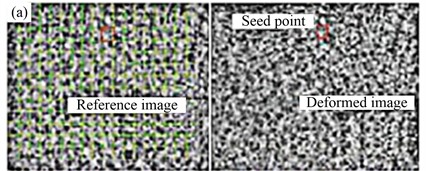
Digital image correlation method presented by Petres and Chu is to measure instantaneous displacement field and strain field of the surface of the object under the action of various loads by tracking and matching of gray scale information of images collected before and after deformation [22, 23]. The basic principle is as shown in Fig. 3, in which one is used as the reference image and the other is used as the image to be matched. In the reference image, taking the rectangular sub-image of (2+1)×(2+1) in size and centering on point to be matched , and in the image to be matched, correlation calculation is carried out based on certain search method and certain correlation function to make a search for the sub-image with the largest correlation coefficient with the selected image and centering on point , and then the point is the corresponding point of point in the image to be matched [24].
In correlation matching, the left and right images shall be subject to the calculation based on certain mapping function. The work adopts the first order mapping function, including components such as rotation, translation, positive strain and shear strain, etc:
where: and are the distance between the point and center point of sub-image along the directions of and respectively; , are the displacement component of center point of sub-image along the directions of , respectively after deformation; , , , are the first order displacement gradient of reference sub-image.
Fig. 3The theory of digital image correlation method
The relational expression between grey value of point and grey value of point may be expressed as:
where, is noise part and are used to compensate gray difference due to illumination.
Supposing that there are pixel points in sub-image, and the pixel gray level is subject to independent identically distributed noise interference, then the level of similarity between corresponding referenced sub-image and deformed sub-image shall be measured by the following formula:
where: is correlation parameter vector. The above formula is non-linear equation, and the least square iteration algorithm may be utilized for solution. However, it is necessary to give the initial value of the unknowns. Generally, , are obtained by rough matching, while the other unknowns are as following:
Nevertheless, the initial value with greater error shall reduce calculation speed of least square iteration algorithm or obtain false convergence result. Therefore, the work draws on seed point matching method given in document [25] to carry out calculation (as shown in Fig. 4). The detailed method is given in document [25], so the paper gives no unnecessary details.
After matching, for any center point of left or right sub-image in deformation state, its corresponding three-dimensional space coordinate shall be rebuilt based on triangulation measurement principle. Repeating the above-mentioned process to obtain the space coordinates of several points, these space points shall make up of three-dimensional appearance of object surface after surface fitting, and the three-dimensional displacement field of the surface of the object tested shall be obtained by the further calculation.
Fig. 4Seed point matching
a) Match one seed point
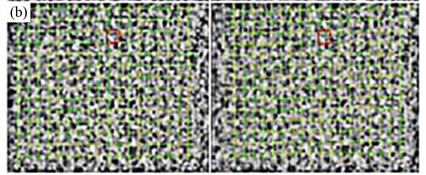
b) Match all seed points
3.2. Binocular stereo vision technology
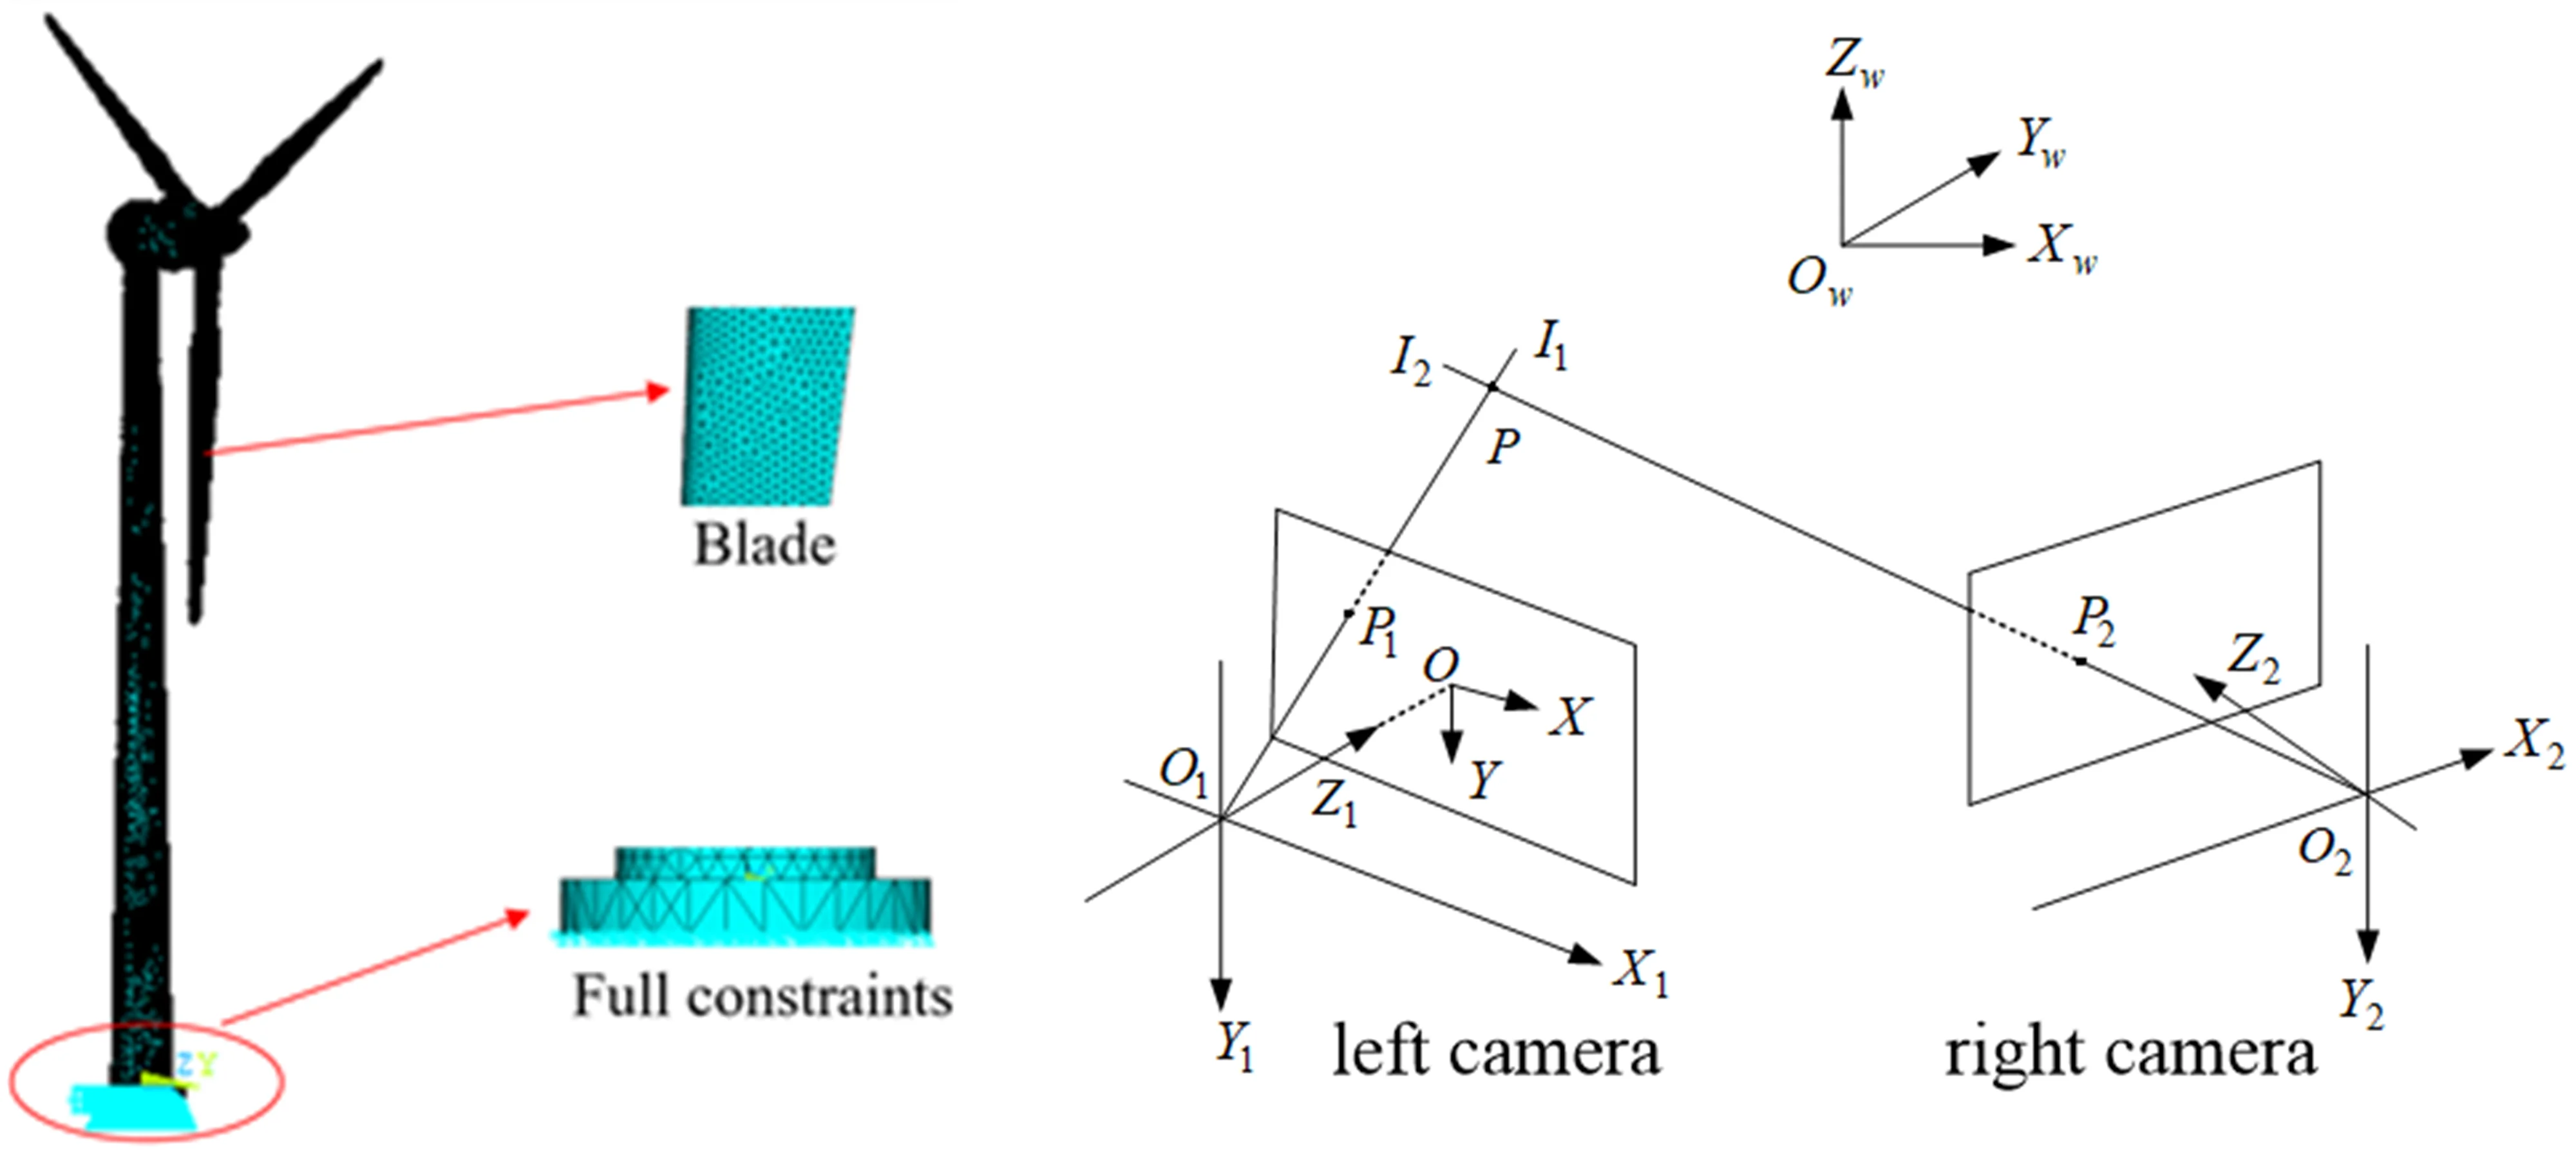
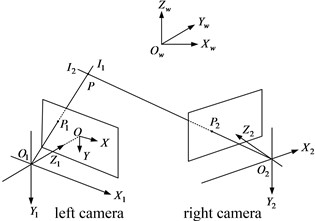
Basic principle of binocular stereo vision is similar to three-dimensional perception process of human being. Namely, perception image at different angle of view is obtained by observation of the same object from two viewpoints so as to obtain three-dimensional shape information of object surface by calculation and analysis of parallax of the same image point in different image [26]. Fig. 5 shows the binocular stereo vision model, with - as object world coordinate system, - as left camera coordinate system, - as right camera coordinate system, and - as image plane coordinate system. The corresponding image points of object space point in left and right cameras are and respectively, and the straight line and intersect at point . If image coordinate of and and intrinsic and extrinsic parameters of camera (intrinsic parameters include focus, principal point coordinate and various distortion parameters, and extrinsic parameters extrinsic parameters include rotation matrix and translation matrix between two camera coordinate systems) are known, three-dimensional coordinate system of under object world coordinate system shall be obtained based on triangulation principle [27].
Fig. 5Stereo vision model
Object point shall form image on image plane after camera lens photography. The preferred projection imaging model is pin-hole camera model in geometrical optics which can expressed as collinearity equation in photogrammetry, and in practice, various distortions of camera lens shall also be taken into consideration. The collinearity equation is as follows [28]:
where: is world coordinate system of object point; is coordinate system of projection center, is point coordinate of image, is principal point coordinate, is focus, is distortion.
The rotation matrix from world coordinate system to camera coordinate system:
Interior orientation parameter of camera includes principal point coordinate , focus f and various lens distortions. Lens distortion contains radial distortion, centrifugal distortion and thin prism distortion [25]. In order to reduce complexity in calculation, many researchers only consider their calibration algorithm with the second order radial distortion which is certainly to reduce accuracy in calibration. The calibration algorithm presented in the paper takes all possible distortions into consideration. The distortion model adopted is as following:
where: , , are radial distortion parameters; , are centrifugal distortion parameters; , are thin prism distortion parameters. There are ten parameters in addition to two principal point coordinates and focus on .
4. Laboratory-scale experimental platform and results
4.1. Laboratory-scale experimental platform
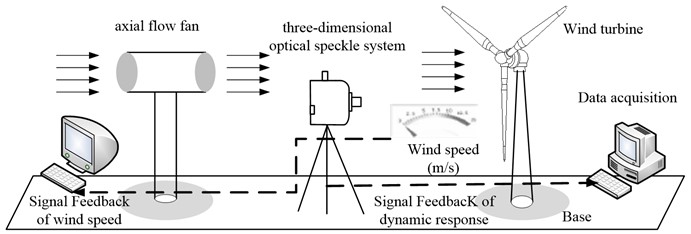
A lab-scale experimental platform is prepared in order to verify the suggested test method for wind turbine to get dynamic response, the test platform is as shown in Fig. 6, including axial flow fan, anemoscope, three-dimensional optical speckle system, wind turbine and base, in which the key function of axial flow fan is to offer wind source. When its impeller is rotating, air shall axially enter impeller from air inlet to increase air energy due to being pushed by blade on impeller and then the air shall flow into guide vane. During experiment process, the variance in wind speed of wind source shall be achieved by means of changing the speed of the axial flow fan and anemoscope shall determine wind speed value. Three-dimensional optical speckle system (XTDIC) shall be used to test movement responses of every part on wind turbine model. Wind turbine test model is composed of hub, tower and cabin, with cabin and tower subjected to integrated coupling and blade hub installed inside cabin by bearing support. The base is to support wind turbine model, with mock-up’s attitude adjusted by rotation of base so as to simulate variance in various wind directions.
Fig. 6Wind turbine generator set dynamic response test platform
4.2. Test process wind turbine dynamic response
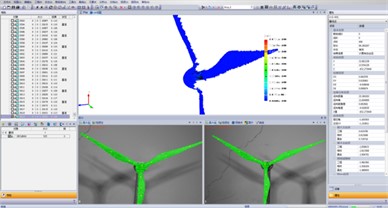
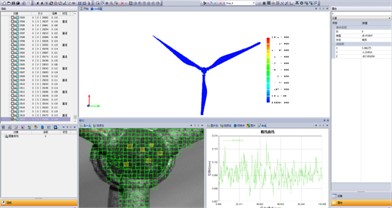
Wind turbine generator set dynamic response test process: (1) Make black and white speckle pattern on surface of wind turbine model in a stochastic way. The speckle pattern may be formed by slight spray of black and white flat lacquer, and the blade speckle spray result is as shown in Fig. 7; (2) Photograph the plane calibration board with circular marker printed on its surface from different azimuth. Binocular camera is subject to entire and primary calibration according to calibration board image collected and bundle adjustment algorithm so as to obtain intrinsic parameters and extrinsic parameters and lens distortion of two cameras, and the calibration method is as shown in Fig. 8 (The distance between the plane calibration board and binocular camera depends on the dimension of the plane calibration board and the number of megapixels of binocular camera); (3) Axial flow fan is to supply wind source for experiment and gain wind speed by means of anemoscope. And control two CCD cameras photography to obtain sequence image of the tested specimen in deformation process when wind speed tends to be stable; (4) Select zone to be analyzed as speckle zone and choose several seed points in speckle zone so as to carry out stereo matching calculation of images of left and right cameras as well as sequence matching calculation of images in various deformation states based on image correlation algorithm. (5) Rebuild three-dimensional image of object surface according to camera calibration result and image matching result and determine three-dimensional coordinate of every point. The displacement of every point on object surface shall be subject to automatic measurement by recording the image of the deformed wind turbine under the action of wind load in a continuous way as shown in Fig. 9; (6) Compare point coordinates in different states based on measurement result of displacement field (Fig. 9). The deformation gradient of object surface in different states shall be calculated based on calculation of the variance in position between certain point and its adjacent point in reference state.
Supposing that the space coordinate of point and its adjacent point in initial state and deformation state is as follows:
where: and are space potion of corresponding point in initial state and deformation state respectively, in which, , and () indicate space coordinate of point in initial state, , and () is space coordinate of point in deformation state , and in order to ensure precision of strain calculation, n shall be no less than 5.
and are subject to plane fitting, with every point in and projected on their respective fitting plane to obtain corresponding plane coordinate:
where: and are the corresponding positions of and in fitting plane, in which , () is plane coordinate corresponding to , , and , () is plane coordinate corresponding to , . According to the definition of two-dimensional deformation gradient tensor, they have the following relation:
where: is deformation gradient.
Fig. 7Speckle spray result of blade
Fig. 8Camera calibration method
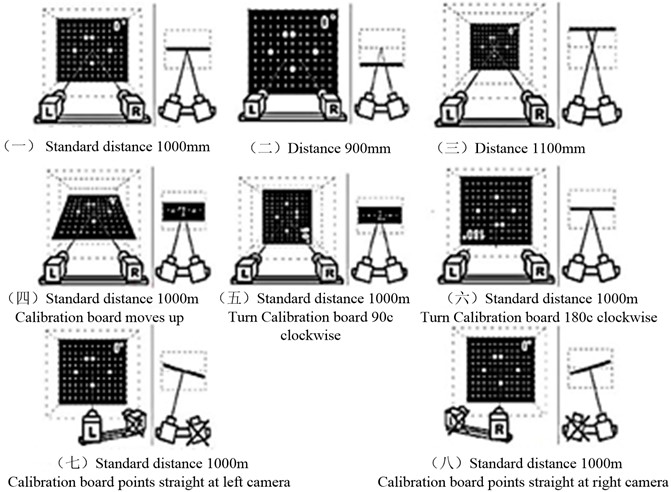
Fig. 9The test rendering of wind turbine dynamic response
4.3. Laboratory-scale experimental results
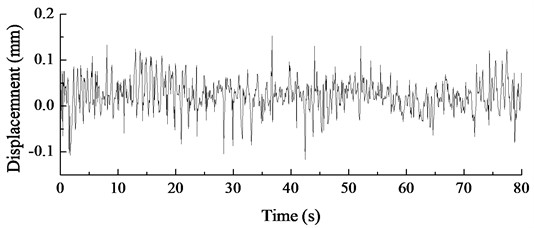
Wind turbine dynamic response test platform is adopted to test displacement response of wind turbine under the action of different wind speed in steady state. XTDIC is to photograph a set of pictures at intervals of 80 ms, and the test time is 150 s, with 1875 pictures photographed. Dynamic response of structure contains two stages, in which the stage from 0 to 70 s is transient response and the stage after 70 s is steady state response. The paper is only to make a study of dynamic response of structure in steady state. Since the available space of the paper is limited, the paper only presents the test result in case that wind speed is 12 m/s.
Fig. 10Steady displacement dynamic response of hub under a constant wind speed of 12 m/s
5. Numerical analysis
5.1. Numerical analysis of the wind turbine
In order to verify the accuracy of the wind turbine dynamic response test method presented in the paper, three-dimensional model for wind turbine is set up to carry out dynamic response analysis of wind turbine based on ANSYS.
Based on the experimental prototype of the wind turbine, a three-dimensional model of the wind turbine is established. The wind turbine prototype is made of hard polyvinyl chloride (PVC) material with an elastic modulus of 3.5×10⁹ Pa, density 1380 kg/m3. The bottom of the tower is fixed, so fixed constraints are applied to its bottom section to constrain all degrees of freedom of the section nodes. Fig. 11 shows the finite element analysis model of the wind turbine experimental prototype, with 6337 unit nodes and 29223 units.
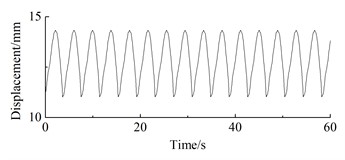
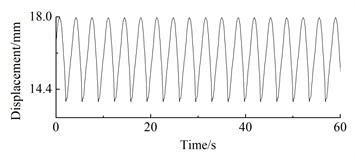
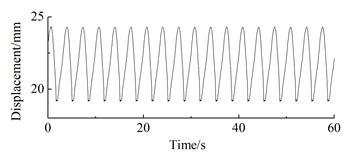
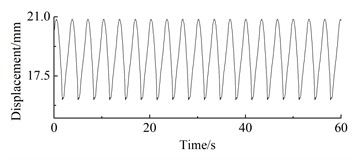
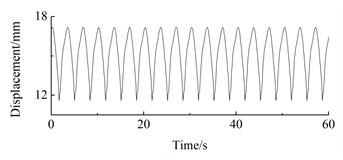
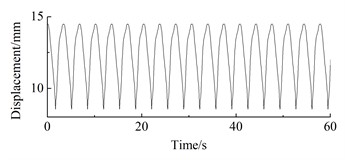
The constant wind speed range for the dynamic characteristics analysis of wind turbines is 4 m/s to 16 m/s, with a set of 7 wind speeds every 2 m/s. Load excitation is applied in the windward direction of the blades at different wind speeds, without considering the dynamic load excitation in the other two directions. After analysis and calculation, the displacement response of the wheel hub under different wind speeds is obtained, as shown in Fig. 12.
Fig. 11The finite element model of the wind turbine
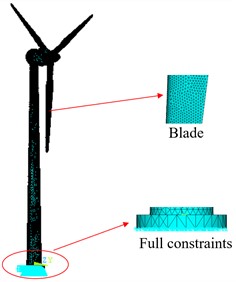
Fig. 12The displacement response of the hub
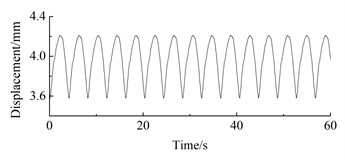
a) 4 m/s
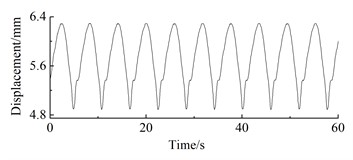
b) 5 m/s
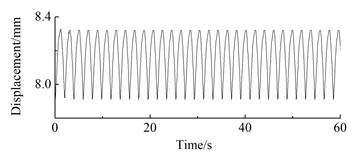
c) 6 m/s
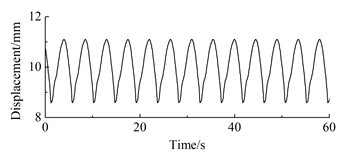
d) 7 m/s
e) 8 m/s
f) 9 m/s
g) 10 m/s
h) 12 m/s
i) 14 m/s
j) 16 m/s
As can be seen from Fig. 12, under steady-state wind conditions, the position displacement response of the wind turbine prototype exhibits periodic fluctuations. At 4 m/s, the position displacement response amplitude of the wheel hub is 0.65 mm, with an average of 4.03 mm; The displacement response amplitude of the wheel hub at 5 m/s is 1.41 mm, with an average of 5.73 mm; The displacement response amplitude of the wheel hub at 6 m/s is 0.43 mm, with an average of 8.17 mm; At 7 m/s, the vibration amplitude of the wheel hub is 2.53 mm, with an average vibration of 10.03 mm; The displacement response amplitude of the wheel hub at 8 m/s is 1.42 mm, with an average of 12.91 mm; The displacement response amplitude of the wheel hub at 9 m/s is 4.2 mm, with an average of 16.16 mm; The displacement response amplitude of the wheel hub at 10 m/s is 5.18 mm, with an average of 21.90 mm; The displacement response amplitude of the wheel hub at 12 m/s is 4.79 mm, with an average of 18.71 mm; The displacement response amplitude of the wheel hub at 14 m/s is 5.57 mm, with an average of 15.11 mm; The displacement response amplitude of the wheel hub at 16m/s is 5.94 mm, with an average of 12.42 mm.
5.2. Comparison
Table 1 shows dynamic displacement response of hub on wind turbine at different wind speed, based on numerical analysis result and test result, it shall be on the increase with the increase of wind speed, and after the wind speed is up to rated wind speed, it shall be on the decrease with the increase of wind speed, conforming to aerodynamic formula (formula 14). The reason is that with the increase of wind speed, the windward thrust shall be on the parabolic increase, since there is linear relation between hub displacement response axial thrust on hub. Therefore, prior to rated wind speed, the hub displacement shall be on the increase with the increase of wind speed. After rated wind speed, the hub displacement response shall be on the decrease with the increase of wind speed:
where: is air density; is thrust coefficient; is wind speed, is windward area.
The error between test result in case that wind speed is 12 m/s and theoretical result is the minimum, being 5.56 %; the error between test result in case that wind speed is 8 m/s and theoretical result is the maximum, being 8.67 %; on the whole, the error between hub displacement response test result and numerical analysis result is within the range of 10 %.
Fig. 13The mean of steady displacement dynamic response from blade root to blade tip under a constant wind speed of 12 m/s
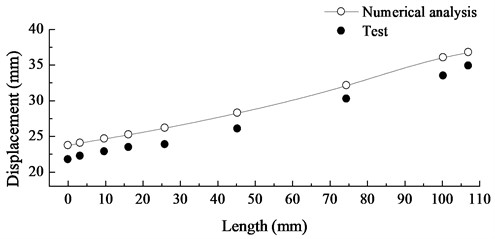
Fig. 13 shows displacement response mean graph of wind turbine from blade root to blade tip in case that wind speed is 12 m/s. Numerical analysis result shows that it is on the increase from blade root to blade tip, and the reason is that blade is every large in aspect ratio and that its dynamic characteristic is similar to that of cantilever. The test result also conforms to the trend. All test results are lower than numerical analysis results due mainly to influence of speckle spray on test result to a certain extent. However, the errors in comparison of results are within 10 %.
Table 1The contrast of test results and numerical analysis results (mm)
Wind speed (m/s) | 8 | 9 | 10 | 11 | 12 | 13 | 14 | 15 | 16 |
Test results | 11.79 | 15.27 | 17.58 | 19.14 | 21.59 | 16.01 | 14.16 | 12.63 | 11.53 |
Numerical analysis | 12.91 | 16.16 | 18.71 | 20.88 | 22.86 | 17.42 | 15.11 | 13.56 | 12.42 |
Error (%) | 8.67 | 5.51 | 6.03 | 8.33 | 5.56 | 7.82 | 6.29 | 6.88 | 7.17 |
6. Conclusions
The paper presents a dynamic response test method for wind turbine based on digital speckle strain measurement principle. The method is to achieve measurement of dynamic response of wind turbine surface in deformation process by data acquisition based on binocular stereo vision technology to carry out real time acquisition of speckle image of object in every deformation stage and adopting image correlation algorithm to perform stereo matching of object surface deformation points. In order to verify the accuracy of the method presented in the paper, three-dimensional model for wind turbine is set up to analyze dynamic response of the wind turbine. There are about 10 % test errors when using the measurement method in testing the dynamic response of wind turbine.
References
-
K. Sun, J. X. Yin, and Y. F. Liu, “Structure dynamic analysis of horizontal axis wind turbines,” (in Chinese), Journal of Engineering Thermophysics, Vol. 5, pp. 777–780, 2009.
-
X. G. Li, X. Jin, and Y. L. He., “Dynamic analysis of wind turbine based on ANN,” (in Chinese), Journal of Vibration and Shock, Vol. 8, pp. 78–83, 2009.
-
P. J. Murtagh, B. Basu, and B. M. Broderick, “Along-wind response of a wind turbine tower with blade coupling subjected to rotationally sampled wind loading,” Engineering Structures, Vol. 27, No. 8, pp. 1209–1219, Jul. 2005, https://doi.org/10.1016/j.engstruct.2005.03.004
-
Y. Wang, M. Liang, and J. Xiang, “Damage detection method for wind turbine blades based on dynamics analysis and mode shape difference curvature information,” Mechanical Systems and Signal Processing, Vol. 48, No. 1-2, pp. 351–367, Oct. 2014, https://doi.org/10.1016/j.ymssp.2014.03.006
-
J. Baqersad, C. Niezrecki, and P. Avitabile, “Full-field dynamic strain prediction on a wind turbine using displacements of optical targets measured by stereophotogrammetry,” Mechanical Systems and Signal Processing, Vol. 62-63, pp. 284–295, Oct. 2015, https://doi.org/10.1016/j.ymssp.2015.03.021
-
S. Schreck, “Surface Pressure Measurements,” (in Chinese), Handbook of Wind Energy Aerodynamics, Vol. 5, pp. 763–801, 2022, https://doi.org/10.1007/978-3-030-31307-4_37
-
M. Li, D. Tian, and H. K. Wang, “Load test experiment of variable pitch wind turbine rotor blade model,” (in Chinese), Acta Energiae Solaris, Vol. 9, pp. 1574–1578, 2013.
-
Y. F. Bai, J. W. Wang, and Y. X. Zhao, “Experimental research on dynamic strain characteristics of wind turbine blades based on telemetry,” (in Chinese), Journal of Engineering Thermophysics, Vol. 4, pp. 682–686, 2014.
-
T. Ackermann, “Wind Power in Power Systems,” IEEE Power Engineering Review, Vol. 22, No. 12, pp. 23–27, 2013.
-
L. Deyuan, Y. Zhiquan, C. Yan, and B. Nengsheng, “Load spectrum and fatigue life analysis of the blade of horizontal axis wind turbine,” (in Chinese), Wind Engineering, Vol. 27, No. 6, pp. 495–506, Dec. 2003, https://doi.org/10.1260/030952403773617463
-
J. G. Holierhoek, Aeroelasticity of Large Wind Turbines. Delft: Delft University of Technology, 2008.
-
R. J. Cao and D. X. Liu, “Experimental investigation on static structural characteristics of a horizontal axis wind turbine,” (in Chinese), Acta Energiae Solaris Sinica, Vol. 4, pp. 436–439, 2001.
-
D. C. Quarton, F. Rasnussen, and C. Nath, “Wind turbine design calculations-the state of the art,” in Proceedings of European Union Wind Energy Conference (EWEC), pp. 10–15, 1996.
-
D. Y. Li, “Structure dynamic analysis of large scale horizontal axis wind turbine,” (in Chinese), Shantou University, Shantou, Vol. 7, pp. 10–11, 2004.
-
B. Tony, S. David, and J. Nick, Wind Energy Handbook. New York: New Yor, 2005.
-
Z.-X. Chen, “Application of the speckle technique for three-dimensional deformation measurement,” (in Chinese), Optical Engineering, Vol. 51, No. 1, p. 013604, Jan. 2012, https://doi.org/10.1117/1.oe.51.1.013604
-
H. Hoffmann and C. Vogl, “Determination of true stress-strain-curves and normal anisotropy in tensile tests with optical strain measurement,” CIRP Annals, Vol. 52, No. 1, pp. 217–220, 2003, https://doi.org/10.1016/s0007-8506(07)60569-1
-
X. G. Dai, J. Kuang, and Z. He, “Study of strain measurement based on digital image processing,” (in Chinese), Journal of Wuhan Polyiechnic, Vol. 5, No. 1, pp. 90–92, 2006.
-
S. S. Russel, M. A. Sutton, and H. S. Chen, “Image correlation quantitative NDE of impact and fabrication damage in a glass fiber reinforced composite system,” Journal of Material Evaluation, Vol. 47, No. 5, pp. 550–558, 1989.
-
T. Fricke-Begemann, “Three-dimensional deformation field measurement with digital speckle correlation,” Applied Optics, Vol. 42, No. 34, pp. 6783–6796, Dec. 2003, https://doi.org/10.1364/ao.42.006783
-
Z. X. Chen, J. Liang, and C. Guo, “Application of digital speckle correlation method to deformation measurement,” (in Chinese), Optics and Precision Engineering, Vol. 7, pp. 1480–1485, 2011.
-
W. Peters and W. Ranson, “Digital imaging techniques in experimental stress analysis,” (in Chinese), Optical Engineering, Vol. 21, No. 3, pp. 427–431, 1982.
-
T. C. Chu, W. F. Ranson, and M. A. Sutton, “Applications of digital-image-correlation techniques to experimental mechanics,” (in Chinese), Experimental Mechanics, Vol. 25, No. 3, pp. 232–244, Sep. 1985, https://doi.org/10.1007/bf02325092
-
A. Oaturk, U. Halicii, and I. Ulusoy, “3D face reconstruction using stereo images and structured light,” in IEEE 16th Signal Processing, Communication and Applications Conference, pp. 1–4, 2008.
-
Z. Z. Tang, J. Liang, and Z. Z. Xiao, “Digital image correlation system for three dimensional defformation measurement,” (in Chinese), Optics and Precision Engineering, Vol. 18, No. 10, pp. 2244–2253, 2010.
-
S. D. Ma and Z. Y. Zhang, Computer Vision Algorithms and the Theoretical Calculation Based. Beijing: Science Press, 1998.
-
T. Luhmann, S. Robson, and S. Kyle, Close Range Photogrammetry: Principles, Techniques and Applications. UK: Whittles Publishing, 2006.
-
Zhou Lun-Bin, “Analysis of converse non-contact measurement technology,” (in Chinese), China Measurement Technology, Vol. 31, No. 5, pp. 25–27, 2005.
About this article

The reported study was funded by the Natural Science Youth Project (XJEDU2021Y013), the Doctoral Program of Tianchi (tcbs201924) and the Xinjiang University scientific research fund (BS190220).
The datasets generated during and/or analyzed during the current study are available from the corresponding author on reasonable request.
Li Cao performed the data analysis, designed of methodology and wrote the manuscript. Qianqian Zhang crubed data and maintained research data. Wenlei Sun Provided of study materials and laboratory samples.
The authors declare that they have no conflict of interest.
