Abstract
The material performance simulation software JMatPro was used to simulate and calculate equilibrium phase structure and properties of a mixture formed by mixing different proportions of Norem02 alloy and F304 stainless steel. The results show that in the range of 500-1300 °C, equilibrium phases of the mixture include Austenite and Ferrite, and the carbides include M2(C,N), M6C, M7C3 and M23C6. As the content of F304 in the mixture increases, the phase transition temperature A1 of the mixture decreases, and first decreases and then increases; in the equilibrium phase, the content of Austenite and Ferrite increases, and the content of carbide decreases until the carbides M7C3 and M6C gradually disappear. Density, coefficient of linear expansion, thermal conductivity, Young’s modulus, Poisson’s ratio and specific heat capacity of different mixture materials vary with temperature in a complex manner. Strength and hardness of the mixture formed when the content of F304 is 20 % is the highest. The finer the grain size of the mixture, the higher the strength and hardness of the material. Comparing standard physical property data of F304 stainless steel at room temperature with the simulation calculation results, it is found that the error is small, which verifies the accuracy of the simulation calculation results.
1. Introduction
The sealing surface of nuclear-grade valves for third-generation nuclear power plants uses iron-based alloys instead of Stellite alloys to reduce the radiation dose of nuclear power unit maintenance. However, during manufacturing and operating, a large number of welding cracks and brittle cracks on the sealing surface of iron-based alloys occurred. Analyzing the reasons [1-5], the first is the significant difference in physical properties between the surface iron-based alloy and the base stainless steel material, resulting in extremely high residual stress in the surfacing layer. The second is that the unbalanced solidification during iron-based alloy surfacing leads to thermal cracks, which propagate during subsequent processing and operating.
The valve sealing surface is one of a layered composite material. At present, some researches have used transition layers to solve the problems of microstructure and properties caused by the large difference in physical properties between the matrix material and the surface material during the welding process of layered composite materials. Ref. [6] prepared multi-layer functional gradient coatings by laser cladding of Stellite 6 and WC (0 wt.%~47 wt.%) mixed powders on low-carbon steel, and found that the multi-layer functional coatings had lower crack sensitivity. Ref. [7] utilized laser assisted metal deposition technology to directly deposit and indirectly deposit H13 mold steel powder with a “buffer layer” on a copper alloy substrate, indicating that the impact toughness of the sample using the “buffer layer” was improved. Ref. [8] proposed a composite surfacing welding repair method for molds with a “base material+transition layer+wear-resistant layer”, which added a gradient layer between the substrate material and the wear-resistant coating for transition. The surface hardness of the coating reached 60HRC, the hardness of the cross-section shows a gradient change, and there were no cracks generated in the gradient layer. Ref. [9] designed a transition layer alloy system through simulation calculation when surfacing hard layer alloys on the surface of 9Cr-2Mo steel, effectively controlling the microstructure and surface stress of the surfacing layer. Ref. [10] used a synchronous powder feeding method for laser surfacing of 316L stainless steel and iron-based alloy powders. Different powders were used in different parts of the component, achieving gradient function manufacturing and optimizing material and performance matching. In addition, transition layer studies have also been conducted on hydrogenation reactors [11], high-temperature boiler tubes [12], thermal power valves and other components [13, 14]. The research results indicate that the use of a transition layer can effectively regulate the microstructure, properties and stress state of the surfacing layer. Therefore, a material performance simulation calculation software JMatPro was used to calculate the microstructure and properties of the mixture formed by mixing different proportions of iron based alloys and matrix materials, in order to screen out a transition material, achieve gradient transition of microstructure and properties between the deposited layer and the matrix, and solve the problems of welding cracks and brittle cracking on the sealing surface of third-generation nuclear power grade valves.
2. Calculation materials
A typical iron based alloy material Norem02 and a valve material F304 stainless steel for nuclear power valves were selected as the calculation materials. The composition of these two materials is shown in Table 1, and the composition of the mixture formed by mixing in different proportions is shown in Table 2.
Table 1Alloy composition of Norem02 alloy and F304 stainless steel (wt,%)
Material | C | Mn | Si | Cr | Ni | N | Mo | Fe |
Norem02 | 1.23 | 4.30 | 3.38 | 25.40 | 4.00 | 0.17 | 2.00 | Bal. |
F304 | 0.08 | 2.00 | 0.75 | 18.00 | 8.00 | 0.10 | 0.0 | Bal. |
Table 2Composition of Norem02 alloy and F304 stainless steel mixture (wt,%)
No. of mixture | Proportion (%) | C | Mn | Si | Cr | Ni | N | Mo | Fe | |
F304 | Norem02 | |||||||||
F0 | 0 | 100 | 1.23 | 4.30 | 3.38 | 25.40 | 4.00 | 0.17 | 2.00 | Bal. |
F2 | 20 | 80 | 1.00 | 3.84 | 2.85 | 23.92 | 4.80 | 0.15 | 1.60 | Bal. |
F4 | 40 | 60 | 0.77 | 3.38 | 2.32 | 22.40 | 5.60 | 0.14 | 1.20 | Bal. |
F6 | 60 | 40 | 0.54 | 2.92 | 1.80 | 20.96 | 6.40 | 0.12 | 0.80 | Bal. |
F8 | 80 | 20 | 0.31 | 2.46 | 1.27 | 19.48 | 7.20 | 0.11 | 0.40 | Bal. |
F10 | 100 | 0 | 0.08 | 2.00 | 0.75 | 18.00 | 8.00 | 0.10 | 0.0 | Bal. |
3. Results and discussion
3.1. Equilibrium phase analysis
The microscopic structure obtained from simulation calculations of different mixtures are shown in Table 3, and the equilibrium phase diagram is shown in Fig. 1. During calculating, the temperature range is from 500 °C to 1300 °C, with a temperature gradient of 10 °C steps. It can be observed that as the mass fraction of F304 stainless steel increases in a 20 % gradient, the relative mass percentage content of Ferrite and Austenite in the equilibrium phase diagram increases, while the relative mass percentage content of carbides decreases until the carbides M7C3 and M6C gradually disappear.
Fig. 2 shows the calculated carbide content curve during the phase transition process of the mixture. It can be seen that the content of M23C6 carbide decreases with the increase of the mass fraction of F304 stainless steel, and its temperature range first extends. When the mass fraction of F304 stainless steel reaches 60 %, it begins to shorten. The content of carbides M2(C,N) decreases with the increase of the mass fraction of F304 stainless steel, and the temperature range in which it exists has been decreasing. The content of carbide M6C decreases with the increase of the mass fraction of F304 stainless steel, and the temperature range in which it exists has been decreasing until it disappears. With the increase of the mass fraction of F304 stainless steel, the content of carbide M7C3 has been decreasing, and its temperature range has been narrowing until it disappears.
Fig. 1Equilibrium phase diagram of a mixture of Norem02 alloy and F304 stainless steel with different proportions
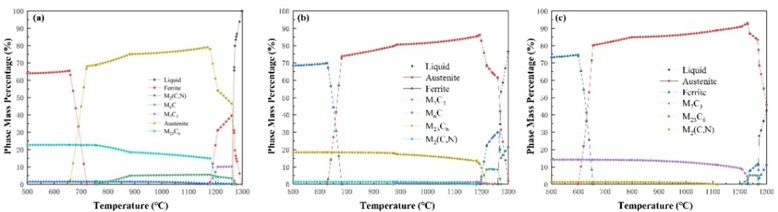
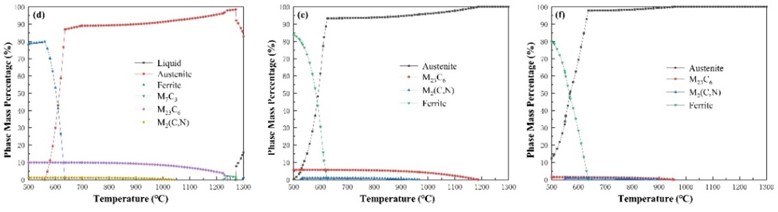
Fig. 2Change curve of different carbide content proportion during phase transformation
Table 3The calculated microscopic structures of different proportion mixtures
No. of mixture | Equilibrium solid phase | Carbide | Remark |
F0 | Ferrite + Austenite | M2(C,N), M6C, M7C3, M23C6 | Fig. 2(a) |
F2 | Ferrite + Austenite | M2(C,N), M6C, M7C3, M23C6 | Fig. 2(b) |
F4 | Ferrite + Austenite | M2(C,N), M7C3, M23C6 | Fig. 2(c) |
F6 | Ferrite + Austenite | M2(C,N), M7C3, M23C6 | Fig. 2(d) |
F8 | Ferrite + Austenite | M2(C,N), M23C6 | Fig. 2(e) |
F10 | Ferrite + Austenite | M2(C,N), M23C6 | Fig. 2(f) |
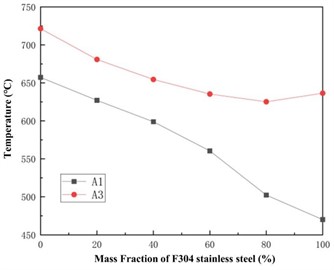
Fig. 3 shows the phase transition temperature and of different mixtures. It can be observed that as the mass fraction of F304 stainless steel increases, the phase transition temperature of the mixture decreases, while first decreases and then increases. This indicates that with the increase of the proportion of F304 stainless steel, the Ferrite in the material is more easily transformed into Austenite, which can form Austenite at a lower heating temperature. This can prevent Austenite grains from coarsening due to excessive heating temperature, thereby improving the comprehensive properties of the material such as strength and hardness. The lower the temperature of , the finer the final grain size of Austenite.
Fig. 3Variation curves of phase transition temperature A1 and A3 of the mixture
3.2. Physical performance simulation and comparison
Fig. 4 shows the curves of density, linear expansion coefficient, thermal conductivity, Young’s modulus, Poisson’s ratio and specific heat capacity of different mixtures with temperature. In order to verify the reliability of simulated calculation data, when the mass fraction of F304 stainless steel is 100 %, as a control, the standard density of F304 stainless steel at room temperature is about 7.93 (g·cm-3), the Young’s modulus is about 194 (GPa), and the specific heat is about 0.502 (J·(g·K)-1). The corresponding data obtained by software simulation calculation are 7.75 (g·cm-3), 189 (GPa), and 0.45 (J·(g·K)-1), with relatively small errors. Therefore, the accuracy and reliability of the software simulation calculation data are relatively high.
3.3. Mechanical performance simulation
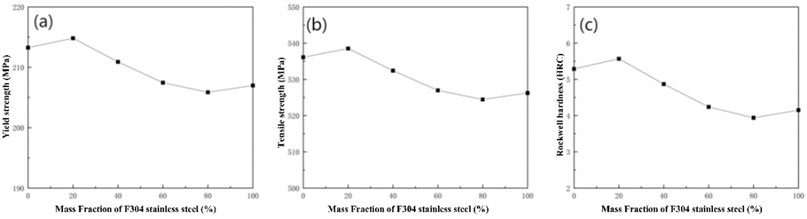
Assuming a heat treatment temperature of 720 °C, the curves of yield strength, tensile strength, and hardness of different mixtures with F304 content and grain size can be calculated as shown in Fig. 5. Analyzing found that the strength and hardness of the mixture do not simply increase or decrease with the increase of F304 content, but are higher than other mixtures at a 20 % content. From Fig. 5, it can also be seen that the finer the grain size of the mixture, the higher the strength and hardness of the material. When the grain size is 6.5, the strength and hardness variation curves of different mixtures are shown in Fig. 6.
Fig. 4Thermophysical performance parameters of different mixtures
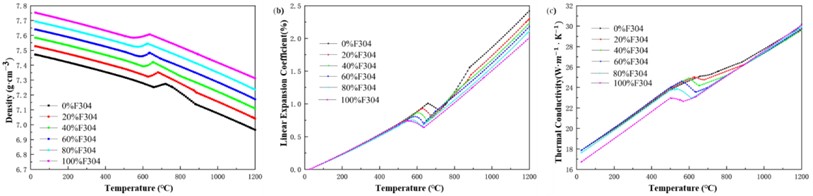
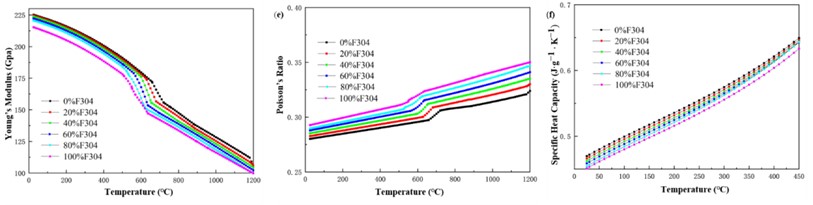
Fig. 5Mechanical properties of Norem02 alloy and F304 stainless steel under different composition gradients
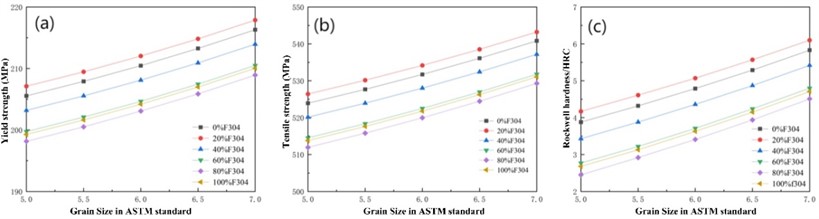
Fig. 6Strength and hardness of different mixtures with a grain size of 6.5
4. Conclusions
The mixture formed by mixing Norem02 alloy with F304 stainless steel in different proportions consists of Austenite and Ferrite in equilibrium at 500-1300 °C, and carbides include M2(C,N), M6C, M7C3, and M23C6. As the content of F304 in the mixture increases, the phase transition temperature A1 decreases, while A3 first decreases and then increases. The content of Austenite and Ferrite in the equilibrium phase increases, while the content of carbides decreases until the carbides M7C3 and M6C gradually disappear.
The density, linear expansion coefficient, thermal conductivity, Young’s modulus, Poisson’s ratio and specific heat capacity of different mixtures varied with temperature in a complex manner. Comparing the standard data of F304 stainless steel at room temperature with the data obtained through software simulation, the error was relatively small, proving the accuracy of the simulation calculation results.
The strength and hardness of the mixture do not simply increase or decrease with the increase of F304 content, but are higher than other mixtures when the F304 content is 20 %. The calculation shows that the finer the grain size of the mixture, the higher the strength and hardness of the material.
References
-
Y. Ding, R. Liu, J. Yao, Q. Zhang, and L. Wang, “Stellite alloy mixture hardfacing via laser cladding for control valve seat sealing surfaces,” Surface and Coatings Technology, Vol. 329, pp. 97–108, Nov. 2017, https://doi.org/10.1016/j.surfcoat.2017.09.018
-
Q. Sun, Q. H. Fan, and Y. X. Jiao, “Cause analysis of cracks on surfacing sealing surface of nuclear grade valve,” (in Chinese), Hot Working Technology, Vol. 50, No. 17, pp. 157–162, 2021, https://doi.org/10.14158/j.cnki.1001-3814.20202275
-
L. P. Nie, D. Y. Wang, and X. F. Gong, “Analysis for reason of cracks in steam turbine valve seat surfacing,” (in Chinese), Dongfang Turbine, No. 4, pp. 56–59, 2019, https://doi.org/10.13808/j.cnki.issn1674-9987.2019.04.013
-
Q. M. Zhu, T. B. Gao, and H. Q. Zhu, “Analysis and improvement of the failure causes of weld cracks in nuclear island valve discs,” (in Chinese), Welding Technology, Vol. 48, No. 11, pp. 81–85, 2019.
-
H. Wang, K. J. Yin, and W. Zhang, “Failure analysis of check valve in safety injection system of a nuclear power plant,” Nuclear Power Engineering, Vol. 38, No. 3, pp. 141–144, 2017, https://doi.org/10.13832/j.jnpe.2017.03.0141
-
G. Xu, M. Kutsuna, Z. Liu, and L. Sun, “Characteristic behaviours of clad layer by a multi-layer laser cladding with powder mixture of Stellite-6 and tungsten carbide,” Surface and Coatings Technology, Vol. 201, No. 6, pp. 3385–3392, Dec. 2006, https://doi.org/10.1016/j.surfcoat.2006.07.210
-
M. K. Imran, S. H. Masood, M. Brandt, S. Bhattacharya, and J. Mazumder, “Direct metal deposition (DMD) of H13 tool steel on copper alloy substrate: Evaluation of mechanical properties,” Materials Science and Engineering: A, Vol. 528, No. 9, pp. 3342–3349, Apr. 2011, https://doi.org/10.1016/j.msea.2010.12.099
-
B. Xie, J. Luo, and A. N. Li, “Study on microstructure and properties of gradient hardfacing layer for mould repairing,” (in Chinese), China Mechanical Engineering, Vol. 17, pp. 338–343, 2006.
-
G. L. Chen, “Gradient composition design and microstructure of hardfacing material for cold roll,” Hebei University of Technology, 2017.
-
J. L. Song, Z. J. Ge, and Q. L. Deng, “Laser deposited welding of functional gradient materials with powder feeding,” (in Chinese), Transactions of the China Welding Institution, Vol. 27, No. 2, pp. 27–30, 2006.
-
X. J. Wang, Y. J. Wang, and J. W. Yan, “Influence of welding or cladding E347 on E309L transition layer after PWHT to substrate material in hydrogenation reactor,” (in Chinese), Pressure Vessel Technology, Vol. 33, No. 3, pp. 61–68, 2016, https://doi.org/10.3969/j.issn.1001-4837.2016.03.010
-
G. X. Yu, “Study on welding procedure of corrosion resistant layer on low-alloy steel surface and properties of hardfacing layer,” China University of Mining and Technology, 2015.
-
G. L. Yang, D. Wang, and Y. Y. Li, “Effect of ENiCrFe-3 transition layer on composition and properties of cobalt base hard layer,” (in Chinese), Hot Working Technology, Vol. 48, No. 4, pp. 131–134, 2019, https://doi.org/10.14158/j
-
D. Zhan, S. Y. Chen, and X. E. Song, “Microstructure and properties of Fe-Cr-Ni gradient alloy steel by direct laser deposition,” (in Chinese), Heat Treatment of Metals, Vol. 48, No. 2, pp. 1–9, 2023, https://doi.org/10.13251/j.issn.0254-6051
About this article

An Acknowledgement for the finances of Jiangsu province natural science foundation project BK20221244.
The datasets generated during and/or analyzed during the current study are available from the corresponding author on reasonable request.
The authors declare that they have no conflict of interest.
