Abstract
In the service life of traffic markings, the visibility of the markings can be significantly impacted due to continuous rolling by vehicles. This study aims to investigate the change of retroreflective coefficient of traffic markings at different positions on the road after being rolled by vehicles. A two-month follow-up study was conducted on a specific section of the road, focusing on the sideline and middle line of the lane. The retroreflective coefficient instrument was utilized to collect data on the retroreflective coefficient of the markings. Results revealed that the middle line, due to more frequent vehicle rolling, exhibited a larger range in its retroreflective coefficient as compared to the sideline of the lane. The change in reflection ability of hot melt markings, when rolled by the vehicle, depends on the mosaic condition of the glass beads within the coating. It was observed that the rolling of the vehicle had a direct impact on the retroreflective coefficient of the hot melt marking line. Furthermore, it was found that with increased rolling of the marking line, the greater the impact on its reflection capacity and the thickness also demonstrated a significant decrease.
Highlights
- Due to the rolling effect of more vehicles, the wear degree of the middle line of the road is about 20 % higher than that of the edge line, resulting in a more obvious reduction in its thickness.
- Comparing the thickness changes of the inner road midline and the outer edge line, it is found that the inner test midline is more worn after the vehicle is rolled, while the outer edge line is less rolled and less damaged.
- The rolling of the vehicle will significantly reduce the retroreflective coefficient of the hot melt mark.
1. Introduction
Ensuring safety on the road is the primary responsibility of every driver. This involves both the driver's driving literacy and the availability of correct road instructions to guide them. Road markings are commonly used to assist drivers in making accurate judgments [1]. Proper design of road markings is crucial in reducing road congestion and improving traffic safety. Hot melt marking is widely preferred due to its low cost, strong adhesion, and resistance to cracking [2]. Shanxi roads utilize various types of road markings, including two-component markings for parking spaces in expressway service areas. Reflective hot melt markings are commonly planned for most road markings.
In practice, due to construction technology defects and external vehicle rolling, problems such as poor durability and lack of visibility often arise [3]. Compared with other types of markings, hot melt markings are mainly composed of natural resin or petroleum resin, resulting in better durability and adhesion [4]. Hot melt line has become the mainstream line used in roads due to its good durability, strong visibility, and a large market share. It is widely used in various types of roads [5].
According to statistics, 40 % of traffic accidents in China occur at night. The low night visibility of road markings is one of the causes of accidents. Reducing the loss of marking lines after rolling and improving the visibility of marking lines are effective measures in reducing accidents [6, 7]. Poor marking visibility is closely related to traffic safety. However, there is a lack of research on marking visibility in China. Improving marking visibility is of great significance in reducing traffic accidents and guiding safe driving. Combined with the traffic conditions in Jiangxi Province, the influence of the retroreflective coefficient of the marking line on some main roads in Nanchang City was studied within two months. By recording the data of different periods, the law of the change of the retroreflective coefficient is obtained, providing a basis for studying the influence of rolling on the retroreflective coefficient.
On the road, there are also differences in the traffic volume of lanes at different locations. The inner line is more susceptible to vehicle rolling than the outer line. The difference in traffic volume also leads to the difference in the inverse reflection and thickness of road markings at different locations.
In summary, to improve the visibility of traffic markings on the road and give full play to their guiding role in traffic, this paper studies the influence of vehicle rolling on the retroreflective coefficient of hot melt markings and proposes an improvement scheme.
2. Materials and methods
2.1. Materials
The Composition of the hot melt line was selected in this experiment, and the specific parameters are shown in Table 1.
The performance requirements of reflective glass beads in the test line are show in Table 2.
Table 1Composition of the hot melt marking
Raw material | Mass fraction |
Resin and plastics | 18 |
EVA | 1.2 |
PE wax | 1 |
Soybean salad oil | 2 |
AE-200 (Degaroutle) | 1 |
Group cyanine | 0.5 |
Titanium oxide | 5 |
Quartz powder (60-100 mesh) | 20 |
Glass bead | 30 |
Double fly powder (100-325 mesh) | 20 |
Assistant | 1.5 |
Table 2Performance requirements of glass beads
Technology index | Reflective microbeads | Test result |
Density /g/cm3 | The density of glass beads should be in the range of 2.4-4.3 g/cm3 | 3.2 |
Exterior request | Glass beads should be colorless loose spherical, clean without obvious foreign bodies | no abnormal |
Refractive index/mcd·m-2·lx-1 | 1.500 ≤ RI < 1. 700, 1. 70 ≤ RI < 1. 90, RI ≥ 1. 90 | 2.16 |
2.2. Experimental design
In this study, the two parts of the side line and the middle line of the lane on a road in Shanxi Province were selected as the control to study the influence of vehicle rolling on the retroreflective coefficient and the thickness. Firstly, the road surface of the test section is kept clean, and the glass beads that do not meet the requirements are screened and dried. According to the requirements of engineering specifications, the glass beads are sown into the coating. When the coating is melted, the temperature is controlled within 200 °C-240 °C, and the choice of marking thickness is specified. The hot melt marking coating is planned to be spread on the road surface with glass beads. The density is controlled at 350-550 g/cm2, and the degree of bead inlay is about 55 %-70 %. Finally, the retroreflective coefficient line measuring instrument and the thickness measuring instrument is used for testing.
2.3. Performance test
The national standard GB/T 16311-2009 Specification and test method for road traffic markings stipulates that the retroreflective coefficient of white reflective markings cannot be less than 150 mcd·m-2·lx-1, and the retroreflective coefficient of yellow markings cannot be less than 50 mcd·m-2·lx-1.The reflection coefficient of the selected road was recorded on the 0th, 7th, 15th, 30th and 60th days of the selected road, and track and measure the change data of the marking thickness for 1 year. After testing three sets of values for each coating, the average value is used as the result.
3. Results and discussion
3.1. Change of retroreflective coefficient of road markings
The retroreflective coefficients of six groups of lane sidelines were measured and shown in Table 3.
The middle line and lane marking data of road markings in Fig. 1 meet the requirements of Specification and test method for road traffic markings (GB/T 16311-2009). The data are all measured from a main highway in Jiangxi Province within 60 days. After the initial uniform dispersion of glass beads, the retroreflective coefficient of two kinds of marking lines at different positions on the road are measured regularly. Compared with the sideline of the carriageway, the change of the middle line data is greater. After collecting the data, the trend chart of the inverse reflection coefficient of the two types of markings in different time periods is drawn. By comparing the numerical changes of the retroreflective coefficient between the sideline and the middle line of the lane, it can be analyzed that the degree of rolling of the vehicle will have a significant impact on the retroreflective coefficient of the marking.
Table 3Retroreflective coefficient of markings
Detection area | Retroreflective coefficient | |||||
No. | 0d | 7d | 15d | 30d | 60d | |
Retroreflective coefficient of lane marking / mcd·m-2·lx-1 | 1 | 476 | 425 | 429 | 464 | 450 |
2 | 486 | 483 | 468 | 507 | 462 | |
3 | 488 | 486 | 515 | 522 | 447 | |
Retroreflective coefficient of Center line / mcd·m-2·lx-1 | 4 | 331 | 331 | 347 | 416 | 335 |
5 | 395 | 373 | 426 | 494 | 363 | |
6 | 363 | 364 | 398 | 465 | 372 | |
Fig. 1Retroreflective coefficient line chart of edge line and center line
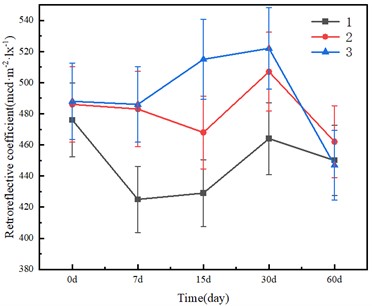
a) Road edge line group
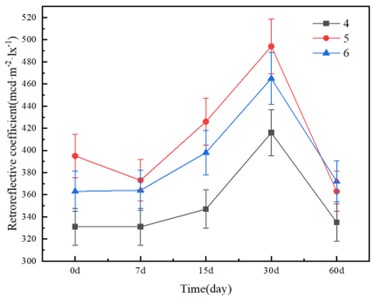
b) Road center line group
3.2. Thickness variation of road markings
Fig. 2 shows the changing trend of the marking thickness at two different positions.
The data in the figure shows that the distribution of the two points and the pattern of the confidence band have the same shape. As the time of follow-up observation became longer, although the thickness of the two control groups changed significantly after 15 days, the downward trend of the middle line was more obvious, and the change range initial value was larger. By comparing the fitting curves of the two groups, it is found that the trend of the two groups of marking data is roughly the same. After 60 days, the thickness decreases the most. Although the change trend in the figure is roughly the same, the value of the middle line decreases higher than that of the edge line. The wear degree of the middle line is 20 % higher than that of the edge line. After 270 days, the marking is repaired to a certain extent, and it shows the same downward trend. Numerically, the thickness change of the middle line is larger than that of the edge line, and the decrease is more apparent. Obviously, the thickness of the center line marked by greater vehicle rolling is more obvious than that of the edge line marked by less vehicle rolling. Due to excessive vehicle rolling, the thickness of the middle line decreases faster than the edge line.
Fig. 2Fitting curve of line thickness change
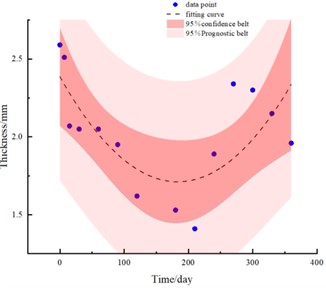
a) Road edge line thickness
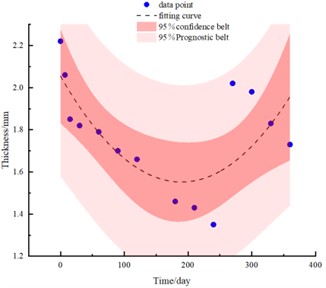
b) Road center line thickness
3.3. Analysis of influencing factors of retroreflective coefficient
In Fig. 3, a clear phenomenon of partial cracking can be observed on the middle line compared to the complete and smooth edge line. Upon local amplification, it becomes more prominent that there are more holes and wear phenomena on the surface of the middle line. The uniform distribution of glass beads in the middle line position is obviously more scattered than that in the edge line. Most of the glass beads in the middle line position are completely embedded in the coating, which has a negative impact on reflective performance.
Another factor is that the rolling of the vehicle will cause the degree of mosaic of the glass beads in the coating to change. During the construction period, the excess glass beads will be artificially removed and the proportion of the glass beads embedded in the coating will be guaranteed. Excessive rolling of the vehicle will cause the glass beads originally half-embedded in the coating to be completely embedded in it. As shown in the Fig. 4, when the glass beads are embedded too deeply, the incident light will be irradiated into the glass beads, and the reflected light angle is prone to deviation and cannot be absorbed by the drivers, which may cause the decline of the retroreflective coefficient of traffic markings.
3.4. The influence of vehicle rolling on the distribution of glass beads
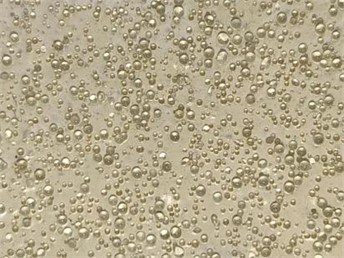
The distribution of glass beads in the hot melt line directly affects the inverse reflection coefficient. In actual construction, the glass beads do not always form an ideal mosaic shape. As shown in Fig. 5, some glass beads may float on the surface of the hot melt line, while others may be embedded inside the line as a whole. Both cases decrease the inverse reflection coefficient. Vehicle rolling is also an external factor that changes the distribution of glass beads. As indicated in Table 3, retroreflective coefficients of markings at different positions exhibit certain regular changes. After construction, the rolling of vehicles separates unstable glass beads from marking surfaces, which initially increases retroreflective coefficient of the marking. However, over a prolonged period of the marking, vehicle rolling increases the degree of glass bead inlay, causing the loss of most reflection ability of glass beads.
Fig. 3Marking surface condition after 60 days
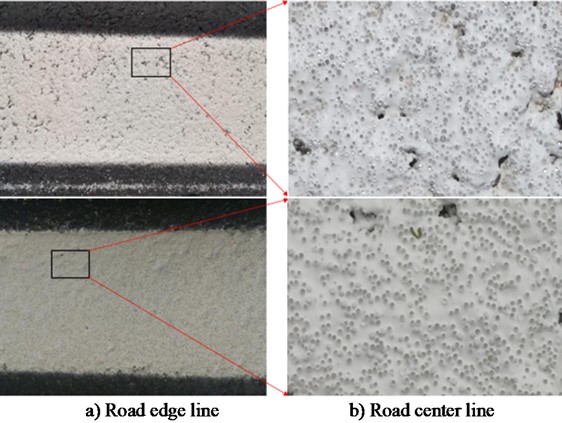
Fig. 4Glass beads inlaid too deep
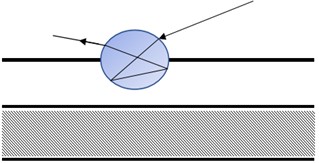
Fig. 5Distribution of glass beads
4. Conclusions
Through the experimental design and results discussion in this paper, the relationship between the initial retroreflective coefficient, thickness is clearly obtained, which can be summarized as follows:
1) Due to the rolling effect of more vehicles, the wear degree of the middle line of the road is about 20 % higher than that of the edge line, resulting in a more obvious reduction in its thickness. Comparing the thickness changes of the inner road midline and the outer edge line, it is found that the inner test midline is more worn after the vehicle is rolled, while the outer edge line is less rolled and less damaged. The change of the marking thickness of the former is obviously greater than that of the latter.
2) The rolling of the vehicle will cause a decrease in the retroreflective coefficient of the hot melt line. The rolling of the vehicle will cause the glass beads in the hot melt line coating to be too embedded in the glass beads, and the reflected light will deviate. Secondly, the rolling of the vehicle will damage some of the glass beads on the surface, resulting in a decrease in the number of reflections. The rolling of the vehicle will significantly reduce the retroreflective coefficient of the hot melt mark.
References
-
M. Mennig, P. W. Oliveira, and H. Schmidt, “Interference coatings on glass based on photopolymerizable nanomer material,” Thin Solid Films, Vol. 351, No. 1-2, pp. 99–102, Aug. 1999, https://doi.org/10.1016/s0040-6090(99)00335-1
-
E. Hadizadeh, S. Pazokifard, S. M. Mirabedini, and H. Ashrafian, “Optimizing practical properties of MMA-based cold plastic road marking paints using mixture experimental design,” Progress in Organic Coatings, Vol. 147, No. 1, p. 105784, Oct. 2020, https://doi.org/10.1016/j.porgcoat.2020.105784
-
J. Nance and T. D. Sparks, “From streetlights to phosphors: A review on the visibility of roadway markings,” Progress in Organic Coatings, Vol. 148, p. 105749, Nov. 2020, https://doi.org/10.1016/j.porgcoat.2020.105749
-
S. M. Mirabedini, F. Zareanshahraki, and V. Mannari, “Enhancing thermoplastic road-marking paints performance using sustainable rosin ester,” Progress in Organic Coatings, Vol. 139, p. 105454, Feb. 2020, https://doi.org/10.1016/j.porgcoat.2019.105454
-
T. E. Burghardt and A. Pashkevich, “Green Public Procurement criteria for road marking materials from insiders’ perspective,” Journal of Cleaner Production, Vol. 298, No. 2, p. 126521, May 2021, https://doi.org/10.1016/j.jclepro.2021.126521
-
M. Cruz, A. Klein, and V. Steiner, “Sustainability assessment of road marking systems,” Transportation Research Procedia, Vol. 14, pp. 869–875, 2016, https://doi.org/10.1016/j.trpro.2016.05.035
-
S. M. Mirabedini, S. S. Jamali, M. Haghayegh, M. Sharifi, A. S. Mirabedini, and R. Hashemi-Nasab, “Application of mixture experimental design to optimize formulation and performance of thermoplastic road markings,” Progress in Organic Coatings, Vol. 75, No. 4, pp. 549–559, Dec. 2012, https://doi.org/10.1016/j.porgcoat.2012.05.012
About this article

The research was supported by the Transportation Science and Technology Project in Jiangxi Province (No. 2021H0034), Key R&D Project in Shaanxi Province (2023-ZDLGY-25), Transportation Science and Technology Project in Shaanxi Province (Nos. 19-21K, 20-16K, 20-22K).
The datasets generated during and/or analyzed during the current study are available from the corresponding author on reasonable request.
The authors declare that they have no conflict of interest.
