Abstract
This study aims to investigate the effect of thickness and initial retroreflective luminous coefficient () on the retroreflection attenuation of thermoplastic road marking. The road marking with a thickness range of 2.5-3.7 mm were divided into six groups with a 0.2 mm interval to assess the relationship between the initial and the retroreflection attenuation. The settlement pattern of glass beads was also investigated for road markings with different thicknesses. Furthermore, the road markings with an initial range of 457-492 mcd·lx-1·m-2 and a thickness range of 2.46 ~ 3.42 mm were divided into four groups. The values at 7, 15, 30, 60 and 90 days were measured and compared to assess the impact of thickness and initial on retroreflection attenuation. It is concluded that the change of value is due to the change of glass bead embedment. When the thickness is 3.08 mm and the initial is 465.5 mcd·lx-1·m-2, there is a noticeable delay in the retroreflection attenuation.
1. Introduction
As a crucial element of the transportation system, road marking plays a vital role in enhancing road capacity and fortifying safety measures [1]. Simultaneously, it effectively ensures the smooth flow of traffic and maintains a safe transportation environment [2]. Thermoplastic road marking are the preferred choice for road markings in China, occupying a significant market share of nearly 80 % [3]. This is due to the superior durability, quick drying time, environmental protection, exceptional visibility at night, and high coating utilization rate of coating.
In the transportation system, the nighttime visibility relies on the luminous retroreflection generated under the illumination of vehicle headlights. This retroreflection as a crucial indicator for effectively conveying essential traffic information [4]. Utilizing the retroreflective luminous coefficient (), one can assess this important indicator. The , in the unit of (mcd·lx-1·m-2), is the ratio of the luminous intensity coefficient to the surface area of the inverse reflector [5]. It is directly connected to the perception of road markings and overall traffic safety [6], and improving it can effectively reduce traffic accidents [7].
However, the value of road markings often experiences a notable decrease during their service life, it should be maintained above a specific threshold to ensure that drivers can accurately identify and perceive the road markings. Previous studies have shown that the reduction in the values of road markings is primarily caused by the impact of temperature changes. These temperature fluctuations lead to the formation of intricate cracks on the surface [8]. During the service life of road markings, a common problem is the decrease in adhesion between the paint and the glass beads. This decreased adhesion causes the glass beads to detach prematurely from the road marking, thereby accelerating the retroreflection attenuation. Therefore, the prediction of retroreflection attenuation of road markings has received considerable attention as the basis for guiding the maintenance and replacement of road markings due to the issue of rapid attenuation of the values during the service of road markings. Li et al. [9] conducted a study on the attenuation pattern of photometric performance in retroreflective materials using artificial neural networks. They developed a photometric prediction model to forecast the values of different types of retroreflective films. It is concluded that the predicted value has a high matching degree with the experimental value.
The objective of this study is to examine the relationships between thickness of road marking and the initial . Additionally, the study aimed to investigate the relationships among the initial , the thickness of road marking, and retroreflection attenuation. The thermoplastic road marking dates of a construction road within a three-month period are collected. Two experiments were designed. In the Exp. 1, the road markings with a thickness range of 2.5-3.7 mm were divided into six groups at an interval of 0.2 mm. The initial of each group were measured, and a polynomial fitting function was derived based on the collected data. In the Exp. 2, the road markings with an initial ranging from 457-492 mcd·lx-1·m-2and a thickness ranging from 2.46-3.42 mm were respectively divided into four groups. The values at 7, 15, 30, 60 and 90 days were measured and compared to assess the impact of thickness and initial on retroreflection attenuation. Based on the measured data, the impact of the initial and the thickness of the road marking on the retroreflection attenuation was evaluated, and the best scheme to delay the retroreflection attenuation was obtained.
2. Materials and methods
2.1. Materials
In this experiment, the road marking adopted the most widely thermoplastic material for expressways in China. The paint is in the state of white solid powder at room temperature, it is heated to 200 ℃-210 ℃ during construction. The thermoplastic material is melted and applied onto the road surface as a coating.
2.2. Experimental design
In this study, the road markings investigated were primarily focused on lane sideline. Considering the additional wear and tear caused by environmental factors and other variables, the actual marking thickness was slightly larger than the standard specification requirements. This adjustment ensured that the road markings can withstand the anticipated degradation and maintain their intended functionality over time. The of road marking should not be less than 100 mcd·lx-1·m-2. Through the optimization of the confidence interval equation, the measured data were optimized to ensure that the error rate of the statistical data is less than 5 % within the 95 % confidence interval, which meets the requirements of analyzing its laws. Eq. (1) is as follows:
where, is the confidence interval; when 0.05, 1.96, is the standard error of the rate, .
The formula employed in this study allows for a convenient and rapid manual calculation of the confidence interval.
To assess the relationship between the initial and thickness, the thickness range of 2.5-3.7 mm was divided into six groups with a 0.2 mm interval for testing. The design of the Exp. 1 is outlined in Table 1.
Table 1The thickness interval of each group of samples in the Exp. 1
No. | Coating thickness / mm |
TR-1 | 2.5-2.7 |
TR-2 | 2.7-2.9 |
TR-3 | 2.9-3.1 |
TR-4 | 3.1-3.3 |
TR-5 | 3.3-3.5 |
TR-6 | 3.5-3.7 |
The Exp. 2 was designed as a two-factor, four-level experiment to examine the effects of thickness of road marking and initial on retroreflection attenuation. The thickness interval of 2.8-3.0 mm was divided into four intervals based on the various initial . Similarly, the initial interval of 470-475 mcd·lx-1·m-2 was divided into four intervals based on thickness, and the average values were determined. The experiment design is presented in Table 2.
Table 2The thickness, initial RL interval and average value of each group of samples in the Exp. 2
No. | Coating thickness / mm | Initial / (mcd·lx-1·m-2) | Average value of initial / (mcd·lx-1·m-2) | Average value of thickness / mm |
RA-1 | 2.8-3.0 | 457-460 | 458 | 2.9 |
RA-2 | 2.8-3.0 | 465-466 | 465.5 | 2.9 |
RA-3 | 2.8-3.0 | 471-472 | 471.5 | 2.9 |
RA-4 | 2.8-3.0 | 477-492 | 484 | 2.9 |
TA-1 | 2.46-2.52 | 470-475 | 473 | 2.49 |
TA-2 | 2.71-2.83 | 470-475 | 473 | 2.78 |
TA-3 | 2.98-3.18 | 470-475 | 473 | 3.08 |
TA-4 | 3.32-3.42 | 470-475 | 473 | 3.37 |
2.3. Performance test
The testing procedure referred to Specification and test method for road traffic markings (GB/T 16311-2009). The initial was measured approximately 10 days after the road marking construction, following Coefficient of initial retroreflected of newly applied pavement marking and test method (GB/T 21383-2008). Referring to Retroreflectometer (JT/T 612-2004), the measurement is carried out under adequate lighting conditions.
3. Results and discussion
As depicted in Fig. 1, it is evident that the TR-1 group, characterized by the lowest thickness, exhibited the lowest initial RL, while the TR-6 group, with the highest thickness, demonstrated the highest initial RL. The initial RL of the four middle groups showed a gradual increase. In conclusion, there is a positive correlation between the initial RL and the thickness of road marking, indicating that as the thickness increases, the initial RL also tends to increase.
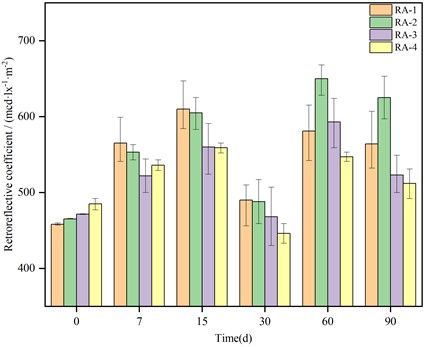
As is shown in Fig. 2, the values of the road markings on the test section was measured for 7, 15, 30, 60 and 90 days. During the 0-15 days, the values of each group showed an increase. Comparing the values of each group, it is apparent that the RA-1 group, with the smallest initial , exhibited the highest increase in the values, while the RA-4 group, with the largest initial , showed the least increase. In other words, a smaller initial corresponds to a greater increase in the values within the 0-15 days. Between 15-30 days, the value of each group experienced attenuation. The attenuation was smaller for groups with smaller initial . The RA-4 group with the largest initial even attenuated to a level lower than its initial value. During the period of 30-60 days, the value of each group showed an increase. The increase was relatively small for the RA-1 group, while the RA-2 group exhibited the highest increase. Within the timeframe of 60 to 90 days, the value of each group started to decline. The decay rate was slower for the RA-1 and RA-2 groups, while the decay rate was faster for the RA-3 and RA-4 groups.
Fig. 1Distribution of initial RL of road markings
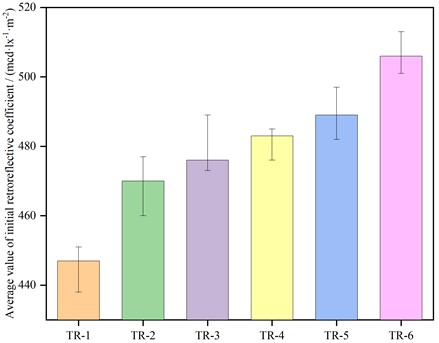
Fig. 2RL values of road markings for 7, 15, 30, 60, and 90 days
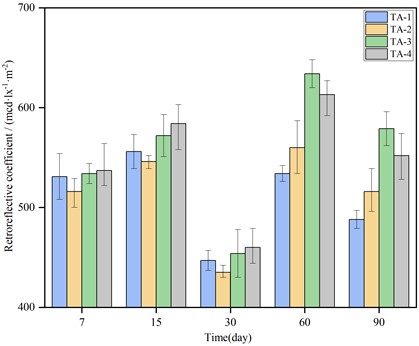
As is shown in Fig. 3, the values of the road markings on the test section was measured for 7, 15, 30, 60 and 90 days. As the service time of the road markings increases, the value of the TA-4 group, which has the largest thickness, remained the highest within the 7-30 days. Additionally, it exhibited the greatest increase in the value during this timeframe. In the 60-90 days, the value of the TA-4 group decreased more rapidly compared to the TA-3 group. This implies that when the thickness of the road markings is approximately 3.08 mm, the retroreflection attenuation rate is slower.
The glass beads are a crucial factor that significantly influences the initial of road markings. When the thickness is low, there are fewer glass beads on the surface, leading to a lower . As the thickness increases, the solidification rate at the bottom of road marking also increases. This results in a shallower settlement depth of the glass beads. Insufficient settlement of the glass beads leads to their exposure on the surface of road marking, increasing their density and consequently raising the initial . As the progresses of wear, the embedding degree gradually improved to the best level, resulting in an increase in the value for each group. In the early stage (0-30 days), when the initial was small, there was more room for improvement, and the growth rate of the value was higher compared to other groups. Due to the group with smaller initial maintained a higher value in the early stage, the value gradually decayed under the influence of later wear, but it was still higher than other groups. However, too small initial indicated poor performance, which would lead to accelerated retroreflection attenuation in the later stage under wear.
Fig. 3RL values at 7, 15, 30, 60 and 90 days
4. Conclusions
The relationship between the initial , thickness, and retroreflection attenuation is studied, the summarized findings are as follows.
1) Due to varying embedding degrees of glass beads in road markings of different thicknesses, the initial of the road marking increases as the thickness increases.
2) Optimal delay of retroreflection attenuation is achieved when the initial of road marking is approximately 465.5 mcd·lx-1·m-2and the thickness is around 3.08 mm.
3) Due to the embedding degree of glass beads undergoes constant changes because of wear and tear. During the service period, the value of thermoplastic road markings exhibits a slow initial increase, followed by a rapid decline, then a sharp increase, and ultimately a gradual decrease.
References
-
H. Qian, X. Lu, P. Kou, and R. He, “Influence of construction technology on the retroreflective performance of two-component traffic marking,” Vibroengineering Procedia, Vol. 47, pp. 35–41, Dec. 2022, https://doi.org/10.21595/vp.2022.23043
-
L. Xu, Z. Chen, X. Li, and F. Xiao, “Performance, environmental impact and cost analysis of marking materials in pavement engineering, the-state-of-art,” Journal of Cleaner Production, Vol. 294, p. 126302, Apr. 2021, https://doi.org/10.1016/j.jclepro.2021.126302
-
W. Fan, S. Wu, L. Li, and P. Ji, “Bio-based polymer materials modified traditional hot-melt marking paint and its properties,” Paint and Coatings Industry, Vol. 52, No. 9, pp. 38–43, 2022.
-
R. He, Y. P. Liang, R. S. Xie, X. S. Lu, and J. G. Geng, “Research progress in application of strontium aluminate long afterglow luminescent materials in road markings,” Journal of Chang’an University (Natural Science Edition), Vol. 42, No. 3, pp. 1–13, 2022, https://doi.org/10.19721/j.cnki.1671-8879.2022.03.001
-
J. E. Hummer, W. Rasdorf, and G. Zhang, “Linear mixed-effects models for paint pavement-marking retroreflectivity data,” Journal of Transportation Engineering, Vol. 137, No. 10, pp. 705–716, Oct. 2011, https://doi.org/10.1061/(asce)te.1943-5436.0000283
-
D. Babić, M. Fiolić, and D. Žilioniene, “Evaluation of static and dynamic method for measuring retroreflection of road markings,” Journal of the Croatian Association of Civil Engineers, Vol. 69, No. 10, pp. 907–914, Dec. 2017, https://doi.org/10.14256/jce.2010.2017
-
H. Fares et al., “Modelling the performance of pavement marking in cold weather conditions,” Structure and Infrastructure Engineering, Vol. 8, No. 11, pp. 1–13, Aug. 2010, https://doi.org/10.1080/15732479.2010.504212
-
L. Ozelim and R. E. Turochy, “Modeling retroreflectivity performance of thermoplastic pavement markings in Alabama,” Journal of Transportation Engineering, Vol. 140, No. 6, p. 05014, Jun. 2014, https://doi.org/10.1061/(asce)te.1943-5436.0000661
-
D. Li, C. J. Sun, W. Y. Su, X. Wang, and W. Wang, “Study on photometric performance attenuation law of retroreflective materials for road traffic,” Advanced Materials Research, Vol. 490-495, pp. 3568–3573, Mar. 2012, https://doi.org/10.4028/www.scientific.net/amr.490-495.3568
About this article

The research was supported by the Transportation Science and Technology Project in Jiangxi Province (No. 2021H0034), Key R&D Project in Shaanxi Province (2023-ZDLGY-25), Transportation Science and Technology Project in Shaanxi Province (Nos. 19-21K, 20-16K, 20-22K, 21-40K), the Fundamental Research Funds for the Central Universities, CHD (300102312402).
The datasets generated during and/or analyzed during the current study are available from the corresponding author on reasonable request.
The authors declare that they have no conflict of interest.
