Abstract
The present article aims to examine the age-related changes in the basic characteristics important for biomechanics (body height and body weight) of Bulgarian men. We do this after dividing the measured individuals into two age groups: I) 18-25 years and II) 30-40 years. The data used in the investigation were collected by performing our own anthropometric measurements. In group I) we measured 41 men and in group II) – 44 men. We present the mean values, standard deviations, and minimal and maximal values of the height, weight, and body mass index of each of the groups, as well as the corresponding probability distributions of these characteristics. The obtained results can be used when there is a need for such anthropometric and mass parameters, e.g., in problems related to the biomechanics of human movements, ergonomics, rehabilitation, orthopaedics and traumatology, sports, forensic studies, etc.
1. Introduction
The physical characteristics of the human body change throughout life. These changes occur not only at the whole body level but also at the cellular and tissue level. Rates of change are also not constant during the ageing process. Certainly, the two main characteristics in which these changes are reflected are a person’s height and weight.
Stature, like other phenotypic characteristics, is controlled by a blend of genetics and environmental factors [1]-[5], among which are the genetic heritage of parents, anatomy and physiology of the individual, individual metabolism, pregnancy and birth weight, infections, diseases and hormonal dysfunction, age, psychosocial environment, way of living, the level of development of the public healthcare system, etc. Concerning weight, it is not clear, even to date, the relative importance of various factors influencing weight. It is usually claimed that the most important is the hormonal factors, but a poor diet and lack of physical activity surely are among the most responsible for weight gain too.
The scientific field devoted to anthropometric measurements and their changes with age has been the topic of different investigations where issues have been studied, like, e.g., the impact of ageing on anthropometric dimensions and its importance to workplace design [6], anthropometric differences detected between the genders and the numerous age groups in the elderly [7-8], comparison of the anthropometric measures for different nationalities [9-10], etc.
Changes in the stature and weight of the Bulgarians in the last century and the early XXI century are described in Ref. [11-12].
Till nowadays the data collection reported in Ref. [12] represents the most representative anthropological investigation of the Bulgarian population performed during the period 1988-1993. In this study, the authors measured a total of 5290 individuals (2435 males and 2855 females) aged between 30 and 40 years.
The current work aims to present and assess in a comparative aspect the data about two of the basic anthropological characteristics from the individual's physical development of the Bulgarian man: i) stature (height) and ii) weight (mass). We do that after dividing the measured subjects into two age groups: I) 18-25 years and II) 30-40 years. It is usually accepted that the basic physical characteristics of humans physical dimensions are at their peak from age 20 to 35 years.
The data used in the investigation are gathered by performing our own anthropometric measurements. In group I) we measured 41 men and in group II) – 44 males.
We present the average values of the height, weight and body mass index of any of the groups, as well as the corresponding standard deviations, minimal and maximal values, as well as probability distributions of the height, weight and body mass index in the groups.
Let us mention that the total number of persons studied in Ref. [12] is exceptionally large. However, this is not so in two other, considered basic, studies related to women in biomechanics. These are the studies reported in Ref. [13] and Ref. [14]. Indeed, there the group of women investigated in Ref. [13] consists of only 15 female athletes, while in another basic study In Ref. [14], they are about 25 Germans women and 25 Chinese ones. Thus, our group of 36 women from the town of Sofia might look small in comparison with the study of [12], but it is bigger than the other respectful studies mentioned above.
The results obtained can be used when one needs such anthropometric and mass characteristics in problems appearing in rehabilitation, medicine (orthopaedics and traumatology), sports, ergonomics, for investigating forensic cases – body fall, car crash accidents, etc.
2. Comparative analysis of the stature, weight and body mass index of the Bulgarian males
As already mentioned above, the purpose of this work is to present a study of the age changes in the basic anthropometric characteristics (body height, body weight and body mass index) of Bulgarian males. Table 1 contains data for the average body height [cm], body weight [kg] and body mass index [kg/m2] (with their minima, maxima, and standard deviation) of all participating males divided into two age groups: I) 18-25 years and II) 30-40 years.
We performed anthropometric measurements of 85 Bulgarian males – all of whom are inhabitants of Sofia – the capital of Bulgaria. In group I) we measured 41 men, and in group II) – 44 males.
Table 1Average age, body height, body weight and body mass index of all participating males
Age (years) | Height (cm) | Weight (kg) | Body mass index (kg/m2) | |||||||
Average | Min | Max | Average | Min | Max | Average | Min | Max | ||
18-25 | 41 | 180.53 (SD = 7.83) | 165 | 200 | 79.27 (SD = 3.39) | 55 | 110 | 24.27 (SD = 3.46) | 17.35 | 33.57 |
30-40 | 44 | 179.14 (SD = 6.90) | 165 | 198 | 84.82 (SD = 13.68) | 65 | 120 | 26.36 (SD = 3.41) | 20.51 | 32.81 |
The inspection of the results shows a small increase in individual height, by about 1 cm, in the range “male aged 18-25” in comparison with “male aged 30-40”. One concludes that, due to the acceleration, the height of the body quickly reaches its maximum. At the same time, however, the average weight of a “male aged 30-40” is about 5 kg more than that of the average “male aged 18-25”.
Usually, BMI (body mass index, BMI) is calculated by dividing the individual's weight by the square of the corresponding height, i.e.:
It is a popular measure used to determine the normal, healthy weight in people of different heights and to diagnose obesity and malnutrition. BMI is a reliable indicator of body fatness for most people and is used to screen for weight categories that may cause health problems. It is evident from Table 1 that the body mass index for the studied group “male aged 18-25” is within the normal range (18.5-24.9) which indicates optimal weight. BMI for the group “male aged 30-40” is within the limits 25.0-29.9, which means overweight (pre-obese).
Table 2 contains data for the average body height [cm], body weight [kg] (with their minima, maxima and standard deviation) and body mass index [kg/m2]of men aged 30-40 from the capital Sofia for the period 1989-1993, (see Ref. [12)] versus our data obtained in the time period from 2018 to 2019. Inspecting the data in this Table, one can conclude that for the period of about 35 years, the height of the average Bulgarian man has increased by about 6 centimetres and that it has also become heavier by about 5 kg. The body mass index in the study by Yordanov et al. (see Ref. [12]) is in the limits 25.0-29.9, which means overweight (pre-obese). In our study subjects fall within similar limits and the BMI is practically the same.
Table 2Comparison of weight, height and body mass index of men aged 30-40 for the period 1989-1993 versus 2018-2019 from the capital Sofia
Height (cm) | Weight (kg) | Body mass index (kg/m2) | ||||||||
Average | Min | Max | Average | Min | Max | Average | Min | Max | ||
Ref. [12] | 234 | 173.0 (SD = 6.49) | 157.0 | 190.4 | 79.0 (SD = 12.8) | 55.0 | 133.0 | 26.3 (SD = 3.8) | 19.1 | 41.7 |
Our data | 44 | 179.14 (SD = 6.90) | 165 | 198 | 84.82 (SD = 13.68) | 65 | 120 | 26.36 (SD = 3.41) | 20.51 | 32.81 |
3. Histograms and probability density functions of the measured quantities for the different groups studied in the current investigation
We present the histograms, probability density function (distribution), mean value, and standard deviation of each of the measured values (height, weight and body mass index) in the groups.
Next, let us note that we did report in the article the standard deviation for all quantities considered. Supposing normal distribution, it means that if the average value is , with confidence 68.2 % all of the measured values are expected to be in the interval .
3.1. Data for the group 18-25 years
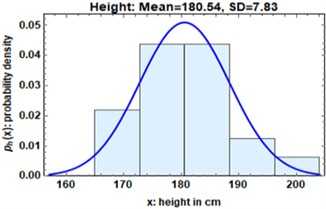
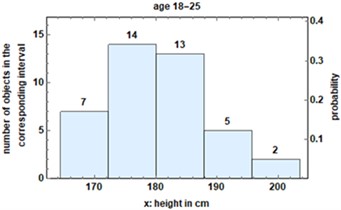
Fig. 1 presents, the probability density function (Fig. 1(a)) and histogram (Fig. 1(b)) for the height of the group 18-25 years. The histogram demonstrates that the mean value of the man’s height is 180.54 cm with a standard deviation of 7.83 cm. The width of the bin intervals is also 7.83 cm. We observe that 34 % of the males in the group are in the interval 172-180 cm, and 32 % in 180-188 cm. By defining the fraction of dimensions divided by the width of the bin, the density of the probability distribution of the measured data can be constructed. This can be compared, in its turn, with the normal probability distribution (the blue bold curve) centred on the calculated mean value of 180.54 cm and having the corresponding standard deviation of 7.83 cm. We conclude that our data with a good approximation can indeed be considered of being normally distributed.
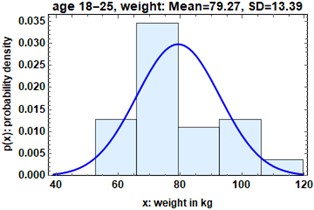
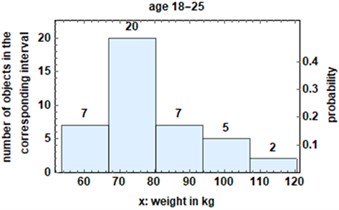
Fig. 2 presents, the probability density function (Fig. 2(a)) and histogram (Fig. 2(b)) for the weight of the males belonging to the group 18-25 years old. Fig, 2b shows that the mean value of the man’s weight in the group is 79.27 kg with a standard deviation of 13.39 kg. The width of the bin intervals is also 13.39 kg. We observe that 40 % of the males in the group are in the interval 66-80 kg, 17.07 % in the intervals between 54 kg and 66 kg and also between 80 kg and 94 kg. The normal probability distribution (the blue bold curve in Fig. 2(a)) is centred around the mean value of 79.27 kg.
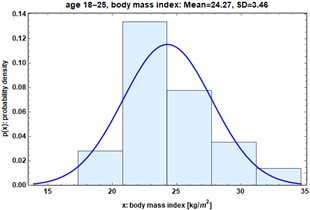
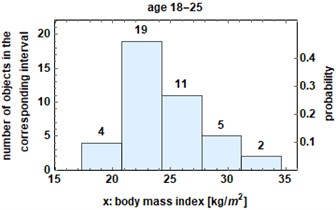
The probability density function of the body mass index of the males in the group 18-25 years old is given in Fig. 3(a). The corresponding histogram of the measured data is shown in Fig. 3(b). The width of the bin intervals is equal to the standard deviation of 3.46 kg/m2. The average value is 24.27 kg/m2. We observe that about 46 % of the males are with BMI between 20-24 kg/m2. The normal probability distribution (the blue bold curve in Fig. 3(a) is centred around the mean value of 24.27 kg/m2.
Fig. 1a) Probability density function and b) histogram for the height of the group 18-25 years
a)
b)
Fig. 2a) Probability density function and b) histogram for the weight of the group 18-25 years
a)
b)
Fig. 3a) Probability density function and b) histogram for the body mass index of the group 18-25 years
a)
b)
3.2. Data for the group 30-40 years
The data for the group of males in the group 30-40 years old are presented in Fig. 4, 5 and 6.
The corresponding normal probability distributions (the bold red curves) are shown in Figs. 4(a), 5(a), and 6(a).
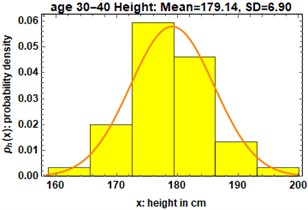
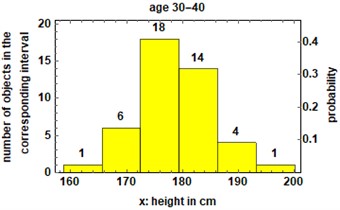
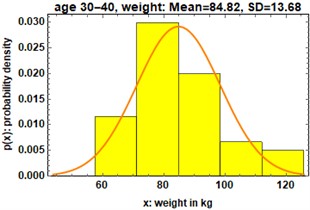
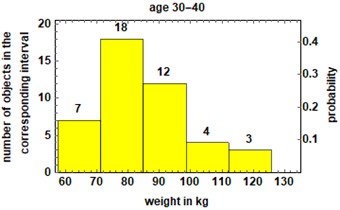
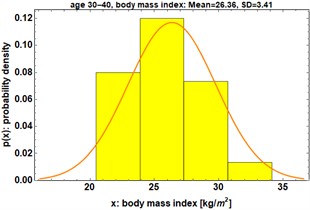
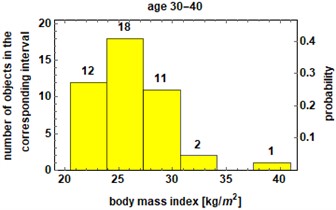
The histograms of the specific data are shown in Figs. 4(b), 5(b) and 6(b). The width of the bin intervals is equal to the corresponding standard deviation of 6.90 cm for the height, 13.68 kg for the weight, and 3.41 kg/m2 for the body mass index. The inspection of the BMI shows that in this age group, there is already a noticeable amount of about 29 % of males with overweight (pre-obese).
Fig. 4a) Probability density function and b) histogram for the height of the group 30-40 years
a)
b)
Fig. 5a) Probability density function and b) histogram for the weight of the group 30-40 years
a)
b)
Fig. 6a) Probability density function and b) histogram for the body mass index of the group 30-40 years
a)
b)
4. Conclusions
It is very difficult to delineate the trends and dynamics in distinctions with the age of stature and weight, as a function of all possible factors influencing them. Some scientists speculate, e.g., that it is not just genetics that reflects human stature and that there is a relationship between the stature of humans and the economic development of the society in a given period with a better economic status claimed to lead to an increase in stature. Economic cataclysms then are expected to lead to a decrease in stature, while prosperity and a high standard of living - to an increase in stature. Based on Bulgaria, we can say that this hypothesis is supported – there are two maxima of the stature of the Bulgarians - in 1940 and 1980, (see Ref. [11-12]) corresponding to a relative economic growth in the decade preceding them.
From the inspection of our aforementioned studies, it appears that a “man aged 18-25” is 1 cm taller than a “man aged 30-40”. The conclusion is that due to the acceleration, the height of the body quickly reaches its maximum. It can be concluded that as the years progress, the weight increases or more precisely, the average weight of a “male aged 30-40” is about 5 kg heavier than the average “male aged 18-25”.
Compared with the group of 30-40 years old men measured about 35 years ago living in the capital of Bulgaria, we observe an increase in the average height by 6 cm and an increase in the average weight by about 5 kg (see Table 2).
From the results for men belonging to the same age group (“male aged 30-40”) but who lived in different historical periods, one can conclude that in the XXI century, the stature of Bulgarian men increased by about 6 centimetres compared to men who lived in the XX century. The conclusion to be made is that in the present century, there is a tendency of increasing men's height.
In terms of the weight for the same age group, it can be seen that the average weight of men in the current century has increased by 5 kilograms compared to that of the last century.
When the height of the individual is increased with the weight decreased leads to changes in the movements of that individual – longer steps, increases pace of movement, easier rotations of the body, etc.
We are not aware of any other studies confronting the characteristics of the young adult generation 18-25 to the one aged 30-40. Having in mind that the sizes of the body have to be reflected in the clothing, shoe sizes, etc., the biomechanical changes shall be of importance for the corresponding industries. Of special importance is the percental of individuals belonging to the given size group. Some information about that can be inferred from the results reported by us. The changes in the parameters of the body shall be also taken into account in the medical industry – for orthopaedic materials.
Finally, let us recall that the results from one representative anthropological investigation of the human body can be applied in industry, ergonomics, sport, health care, etc., with the investigation of mass parameters being necessary for the analysis of human movement and many biomechanical activities. In the current study, we have observed some substantial differences caused by age between the basic parameters characterizing the average Bulgarian man from the city of Sofia. On a practical level, such differences have to be known to the industry when planning products aimed at the market of the corresponding geographical regions.
References
-
S. G. Topp, J. Cook, W. W. Holland, and A. Elliott, “Influence of environmental factors on height and weight of schoolchildren.,” Journal of Epidemiology and Community Health, Vol. 24, No. 3, pp. 154–162, Aug. 1970, https://doi.org/10.1136/jech.24.3.154
-
S. A. Czerwinski et al., “Genetic factors in physical growth and development and their relationship to subsequent health outcomes,” American Journal of Human Biology, Vol. 19, No. 5, pp. 684–691, Sep. 2007, https://doi.org/10.1002/ajhb.20663
-
T. M. Baye, T. Abebe, and R. A. Wilke, “Genotype-environment interactions and their translational implications,” Personalized Medicine, Vol. 8, No. 1, pp. 59–70, Jan. 2011, https://doi.org/10.2217/pme.10.75
-
Q. Liu et al., “Genetic and environmental effects on weight, height, and BMI under 18 years in a Chinese population-based twin sample,” Twin Research and Human Genetics, Vol. 18, No. 5, pp. 571–580, Oct. 2015, https://doi.org/10.1017/thg.2015.63
-
A. Jelenkovic et al., “Genetic and environmental influences on height from infancy to early adulthood: An individual-based pooled analysis of 45 twin cohorts,” Scientific Reports, Vol. 6, No. 1, pp. 1–13, Jun. 2016, https://doi.org/10.1038/srep28496
-
J. F. Annis, “Aging effects on anthropometric dimensions important to workplace design,” International Journal of Industrial Ergonomics, Vol. 18, No. 5-6, pp. 381–388, Dec. 1996, https://doi.org/10.1016/0169-8141(95)00100-x
-
E. Perissinotto, C. Pisent, G. Sergi, F. Grigoletto, and G. Enzi, “Anthropometric measurements in the elderly: Age and gender differences,” British Journal of Nutrition, Vol. 87, No. 2, pp. 177–186, Feb. 2002, https://doi.org/10.1079/bjn2001487
-
A. Dunsky et al., “Level of physical activity and anthropometric characteristics in old age-results from a national health survey,” European Review of Aging and Physical Activity, Vol. 11, No. 2, pp. 149–157, Oct. 2014, https://doi.org/10.1007/s11556-014-0139-y
-
S. Kuhle, B. Maguire, N. Ata, and D. Hamilton, “Percentile curves for anthropometric measures for Canadian children and youth,” PLOS ONE, Vol. 10, No. 7, p. e0132891, Jul. 2015, https://doi.org/10.1371/journal.pone.0132891
-
K. Singh, S. P. Singh, G. Kaur, and K. Bose, “Comparison of age-related anthropometric changes among elderly Punjabi males residing in old-age homes with those residing with their families,” Journal of the Anthropological Survey of India, Vol. 69, No. 1, pp. 102–116, Jun. 2020, https://doi.org/10.1177/2277436x20905923
-
Y. Yordanov et al., “Basic Antropological Data of the Bulgarian Population at the end of the XX-th Century,” American Journal of Biological Anthropology, Vol. 2, pp. 19–28, 1999.
-
Y. Yordanov, A. Nacheva, S. Tornjova, N. Kondova, B. Dimitrova, and D. Topalova, Anthropology of the Bulgarian population at the end of the 20-th century (30-40 years old persons). Sofia, Bulgaria: Prof. Marin Drinov Academic Publishing House, 2006.
-
V. M. Zatsiorsky, Kinetics of Human Motion. IL: Human Kinetics, Champaign, 2002.
-
G. Shan and C. Bohn, “Anthropometrical data and coefficients of regression related to gender and race,” Applied Ergonomics, Vol. 34, No. 4, pp. 327–337, Jul. 2003, https://doi.org/10.1016/s0003-6870(03)00040-1
About this article

This work has been accomplished with the financial support by the Grant No BG05M2OP001-1.002-0011-C02 financed by the Science and Education for Smart Growth Operational Program (2014-2020) and co-financed by the European Union through the European structural and Investment funds.
The datasets generated during and/or analyzed during the current study are available from the corresponding author on reasonable request.
The authors declare that they have no conflict of interest.
