Abstract
Daily energy expenditure includes resting metabolism (RMR), endogenous thermogenesis (or thermal effects of food), and energy expenditure associated with exercise. RMR depends on body weight, age, gender, genetic factors, medications used and health status. Every living organism is affected by external factors. Fluctuations in magnetic fields can affect almost every biological system more or less, depending on the characteristics of the particular biological system and magnetic fluctuations. Environmental energy phenomena affect psychophysical processes that can affect people in a variety of ways, depending on their sensitivity, health status, and ability to self-regulate. The aim of this study: to investigate the correlations between basal metabolic rate in humans with different age, gender, BMI and local Earth magnetic field activity. Information on gas metabolism during respiration was obtained by indirect calorimetry where the gas flow was continuously analysed. O2 consumption and CO2 emissions were continuously analysed. The best quality 5 min section was selected from the 15 min recording (automatically selected by the computer). The results were analysed and mean resting metabolic rate (M_RMR) was calculated. Investigations of metabolic rate were performed in Lithuanian, Druskininkai, Medical SPA Center ,,UPA”. Power of spectral density of Local Geo Magnetic field (LGMF) was calculated in 0.32 to 36 Hz frequency range from the Lithuanian (GCI003) magnetometer for East – West direction (E-W). 395 persons were investigated: 116 men and 279 women. All participants were divided into two groups according gender. Women and men groups were divided again into two groups according mean age, the mean was 46 years. Was analysed correlations in women younger (≤ 46 years) and older (> 46 years) groups and the same for men younger (≤ 46 years) and older (> 46 years) groups. On the next step all women and all men, then younger women group, older women group, younger men group and older men group was divided according BMI mean (29), with less than ≤ 29 BMI and with more than > 29 BMI. On the basis of obtained results, we can conclude, that correlations between LGMF and basal metabolic rate features are negative. More expressed negative correlations are seen in persons with smaller BMI. With age negative correlations with LGMF decrease in men group and increase in women group. Sensitivity of persons of different gender to LGMF – differ.
1. Introduction
The human body constantly requires energy to exist. Daily energy expenditure includes resting metabolism (RMR), endogenous thermogenesis (or thermal effects of food), and energy expenditure associated with exercise [1], [2]. Most physically inactive people RMR accounts for 60 % and 70 % of their total daily energy needs, while in physically active people it only accounts for about 50 % [1]. The determination of RMR should be performed on an empty stomach, at rest, and after a period of physical and psychological relaxation [1], [2].
RMR depends on body weight, age, gender, genetic factors, and medications used [1], [2] as well as health status [3].
Energy consumption is determined by cellular mass [2], so individuals with a higher body mass index have a higher RMR than individuals with a lower BMI [4]. Studies have shown that weight loss results when there is a decrease in RMR [4]. Baseline metabolic rate (BMR), as well as RMR, is thought to decrease markedly with age. Changes in organ weight with age have a significant effect on BMR [5], and it has been hypothesized that age-related loss of muscle mass may affect energy expenditure associated with both central regulatory processes and peripheral cellular mechanisms [6].
Studies have shown that RMR changes over a lifetime. The first rapid decline in RMR occurs from birth to age 30, and the second at a much slower rate from adulthood to death. At the age of 25-30, when the human body reaches its maximum level of complexity and maturity, its RMR is 70 % of its value [7]. Throughout life, women typically have a lower RMR than men. It is likely that body composition and different hormonal patterns at least partly account for such differences [7].
Studies show that people aged 40-96 who do not have a major health problem have a significantly lower RMR than those who are ill and / or functionally disabled [3]. In some diseases - COPD, diabetes, heart failure, oncological diseases - an increase in RMR is observed in their initial stage [5], [8], [9]. Additional energy is needed to neutralize chronic diseases and maintain biological homeostasis, as the body works harder to sustain biological processes and life [3], [9]. This energy demand is met by increasing the RMR at the expense of physical and cognitive energy [7]. When the metabolic reserve and body mass becomes depleted, a decrease in RMR is observed [8], physical and cognitive weakness develops, and eventually disability [7]. Thus, a high RMR can be a biological marker that provides information on the degree of instability in energy metabolism, the current use of energy reserves, and the risk of deterioration in health [3], [7].
Every living organism is affected by external factors. Fluctuations in magnetic fields can affect almost every biological system more or less, depending on the characteristics of the particular biological system and magnetic fluctuations [10]. There is a growing body of research showing that solar and geomagnetic activity affect a variety of human health and behavioral processes, with the cardiovascular and nervous systems being the most sensitive [11]. The response of the autonomic nervous system (ANS) to changes in solar and geomagnetic activity was investigated in numerous studies [11], [12]. An increase in solar wind intensity was observed to be associated with an increase in heart rate, which the researchers interpreted as a stress-specific response while increases in cosmic rays, solar radio flux, and Schumann resonance power was associated with increased HRV and parasympathetic activity [12], [13]. In another study after analyzing the data of the local magnetic field change registered by the magnetometer operating in Lithuania, the possible correlations between the time-varying intensity of the local Earth's magnetic field and the frequency of myocardial infarction were investigated [14]. The results showed that the Earth's magnetic field is related to the number of acute myocardial infarction with ST-segment elevation (STEMI) events per week and the average weekly geomagnetic field strength at different frequency ranges. Correlations varied in different age groups, as well as in men and women, which may indicate different sensitivities of the organism to the Earth’s magnetic field [14]. Reviewing the literature on the health effects of geomagnetic interference, Palmer et al. suggests the following conclusions: 1) geomagnetic disturbances have a greater impact on people in higher (northern) geomagnetic latitudes; 2) abnormally high geomagnetic activity affects the health of the cardiovascular system; 3) abnormally low geomagnetic activity has a negative effect on health; 4) Disrupted geomagnetic activity has a negative impact on the health of about 10-15 % of people living in the study areas. 5) HRV is negatively correlated with geomagnetic interference [15], [11]. Thus, research findings support the hypothesis that environmental magnetic activity affects psychophysical processes that can affect people in a variety of ways, depending on their sensitivity, health status, and ability to self-regulate [12].
The aim of this study: to investigate the correlations between basal metabolic rate in humans with different age, gender, BMI and local Earth magnetic field activity.
2. Methods
2.1. Research methodology
Medical device used for the research: spyroergometry system Metacontrol 3000, (Cortex Biophysik GmbH, Germany). Information on gas metabolism during respiration was obtained by indirect calorimetry where the gas flow was continuously analyzed. Metabolic costs depend on the caloric equivalents of oxygen (O2) and carbon dioxide (CO2) consumed, which vary according to the energy substrate (protein, carbohydrate and lipid) used [1].
The study was conducted in the morning before the participant had eaten. The participant laid on the couch for 15 minutes while psychologically and physically relaxed. Breathing was performed through a special gas flow recorder. O2 consumption and CO2 emissions were continuously analyzed and their ratio (RQ) was calculated. The best quality 5 min section was selected from a 15 min recording (automatically selected by the computer). The results were analyzed and mean resting metabolic rate (M_RMR) was calculated.
2.2. Measure of Local Earth magnetic field
Time varying local Earth magnetic field data were recorded at the GCI magnetometer site located in Lithuania using 2 Zonge Engineering Inc. (Tucson Arizona) ANT4 induction coil magnetometers placed in two directions – north/south and east/west. Signals from the magnetometer were collected with a 24-bit ADC (Symmetric Research, Las Vegas NV) at a sample rate of 130 Hz frequency. For all data the power spectral density (PSD) was calculated using a FFT (fast Fourier transformation) for every hour [16]. Power of spectral density was calculated in 0.32 to 36 Hz frequency range from the Lithuanian (GCI003) magnetometer for East – West direction (E-W) [17]. This frequency band embraces the same frequency bands that are typically used for human brain waves. Asses to magnetometer data (for GCI003) are in web page https://www.heartmath.org/research/global-coherence/gcms-live-data/.
2.3. Participants
During 2016-2020 years, 395 participants were investigated: 116 men and 279 women. For all investigated persons the mean age for men (M+/-SD) was 50.05 +/- 13.12 years, for women - 44.52 +/- 12.67 years. The mean of body mass index (BMI) for men was 28.95 +/- 6.87 [kg/cm2] and for women 27.05 +/- 5.97 [kg/cm2]. All investigated persons were divided into groups - according age (younger ≤ 46 years and older > 46 years), according gender (women and men) and according body mass index BMI (≤ 29 and > 29).
Investigations of metabolic rate were performed in Lithuanian, Druskininkai, Medical SPA Center ,,UPA”.
The study was carried out with Kaunas Regional Biomedical Research Ethics Committee Permission No. BE-50.
3. Results
In article [17] we reported on the analysis of 5 years of basal metabolic rate features and LGMF changes. In this article we report on the analysis of correlations between LGMF and basal metabolic features: M_RMR, VO2, VCO2 in relation to different ages, gender and BMI (body mass index – human mass divided on the height in square [kg/cm2]). All participants were divided into two groups according gender. Than women and men groups were divided into two groups according to mean age, (mean was 46 years). We analysed correlations in younger women (≤ 46 years) and older (> 46 years) groups and the same for younger men (≤ 46 years) and older (> 46 years). We then looked at all women and all men, then the younger women group, older women group, younger men group and older men group which was divided according BMI mean (29), with less than ≤ 29 BMI and with more than > 29 BMI.
Fig. 1Correlations between LGMF and different age in women and men
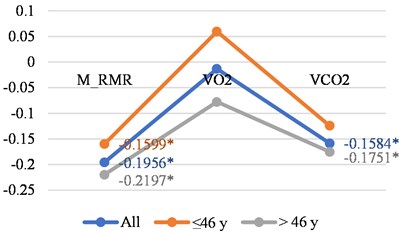
a) Women
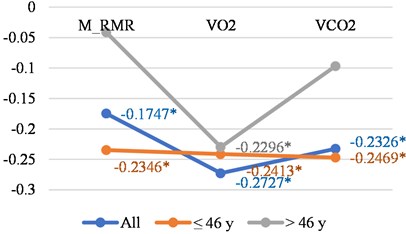
b) Men
In Fig. 1(a) and in 1(b) it is interesting to note, that with age negative correlations with LGMF in the womens group increase. In the mens group, we see decreasing of the same correlations, along with small changes with age in O2 consumption, but large changes in CO2 production and M_RMR. In the women group the changes in the negative correlations with LGMF with age are quite opposite – in the correlation of LGMF and O2 consumption, CO2 production and the increased R_BMR. More detailed correlation presentation can be found in Table 1 for women and for men. We can conclude that correlations are stronger for younger men and older women. Men have higher correlations with O2 consumption, and women with CO2 production.
Table 1Correlations between LGMF and women/men age
Correlations between LGMF and women age | |||
Women | All | ≤ 46 years old | > 46 years oold |
M_RMR | –0.1956 | –0.1599 | –0.2197 |
VO2 | –0.0131 | 0.0597 | –0.0777 |
VCO2 | –0.1584 | –0.1241 | –0.1751 |
N | 277 | 131 | 146 |
Correlations between LGMF and men age | |||
Men | All | ≤ 46 years old | > 46 years oold |
M_RMR | –0.1747 | –0.2346 | –0.0413 |
VO2 | –0.2727 | –0.2413 | –0.2296 |
VCO2 | –0.2326 | –0.2469 | –0.0968 |
N | 118 | 66 | 52 |
Bold: 0.05 | |||
Analysis of correlations between LGMF and BMI in women and men groups show more simple changes – basal metabolic features have smaller negative correlations in persons with bigger BMI and women and men, (Fig. 2(a) and 2(b)).
Here again we can see differences between women and men in the correlations between LGMF and O2 consumption and CO2 production (Table 2). Such behaviour of those correlations in different genders is difficult to interpretate.
Fig. 2Correlations between LGMF and metabolic features in women and men with BMI less than or 29 and with BMI > 29
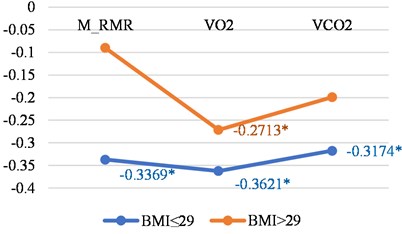
a) Men
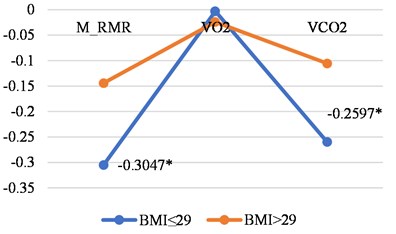
b) Women
Table 2Correlations between LGMF and women/men with different BMI
Correlations between LGMF and women with different BMI | ||
Women (all) | BMI ≤ 29 | BMI > 29 |
M_RMR | –0.3047 | –0.144 |
VO2 | –0.003 | –0.0241 |
VCO2 | –0.2597 | –0.1054 |
N | 188 | 92 |
Correlations between LGMF and men with different BMI | ||
Men (all) | BMI ≤ 29 | BMI > 29 |
M_RMR | –0.3369 | –0.0898 |
VO2 | –0.3621 | –0.2713 |
VCO2 | –0.3174 | –0.199 |
N | 67 | 50 |
Bold: 0.05 | ||
In younger persons (Fig. 3(a) and 3(b)), we have decrease in the correlations between LGMF and basal metabolic features, except in the younger womens group in O2 consumption – where the negative correlation increases, although not significantly.
Fig. 3Correlations between LGMF and metabolic features in younger than 46 years women and men with BMI less than or 29 and with BMI > 29
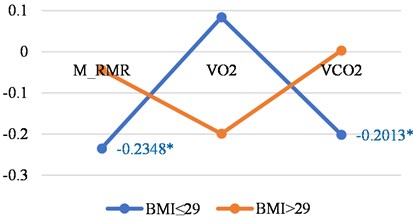
a) Women
b) Men
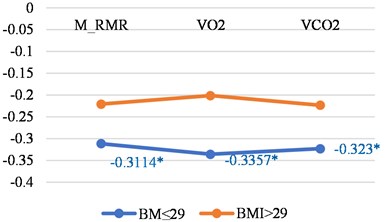
Tables 3 show the correlations for younger persons with different BMI. The biggest correlations we found was in younger men with a BMI of less then 29.
In Fig. 4(a) and 4(b), for older persons we can see the same tendency as in young persons, the correlations between LGMF and basal metabolic rate features were slightly decreased. But again, one interesting feature – in older mens group, the O2 consumption and CO2 production was about the same as in men with a BMI ≤ 29 and in men with a BMI > 29, where the M_RMR became even slightly positive. Regrettably those changes where not significant due to the small number of participants.
Table 3Correlations between LGMF and women/men age ≤ 46 year with different BMI
Correlations between LGMF and women age ≤ 46 year with different BMI | ||
Women (all) | BMI ≤ 29 | BMI > 29 |
M_RMR | –0.2348 | –0.0437 |
VO2 | 0.0839 | –0.199 |
VCO2 | –0.2013 | 0.003 |
N | 109 | 21 |
Correlations between LGMF and men age ≤ 46 year with different BMI | ||
Women (all) | BMI ≤ 29 | BMI > 29 |
M_RMR | –0.3114 | –0.2208 |
VO2 | –0.3357 | –0.2011 |
VCO2 | –0.323 | –0.2233 |
N | 45 | 21 |
Bold: 0.05 | ||
Fig. 4Correlations between LGMF and metabolic features in older than 46 years women and men with BMI less than or 29 and with BMI > 29
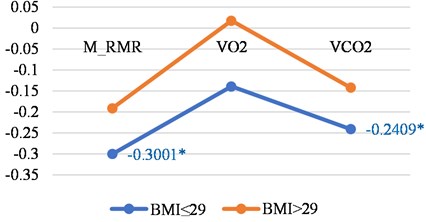
a) Women
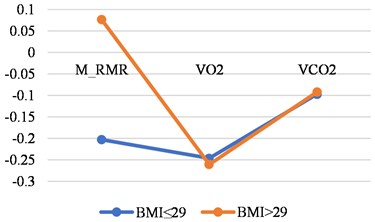
b) Men
Tables 4 shown the correlations for older persons with different BMI. The biggest correlations we found was in older women with a BMI less than ≤ 29.
Table 4Correlations between LGMF and women/men age > 46 year with different BMI
Correlations between LGMF and women age > 46 year with different BMI | ||
Women (all) | BMI ≤ 29 | BMI > 29 |
M_RMR | –0.300 | –0.1912 |
VO2 | –0.139 | 0.0176 |
VCO2 | –0.2409 | –0.1418 |
N | 77 | 72 |
Correlations between LGMF and men age >46 year with different BMI | ||
Women (all) | BMI≤29 | BMI > 29 |
M_RMR | –0.2028 | 0.0769 |
VO2 | –0.2461 | –0.2606 |
VCO2 | –0.097 | –0.0917 |
N | 24 | 28 |
Bold: 0.05 | ||
4. Discussion
The results were interesting in the fact, that with few exceptions, correlations between LGMF and basal metabolic features parameters were negative, many of them significant. This means, that when LGMF activity increases, basal metabolic features parameters decrease. This suggests that when the LGMF activity, which the time varying aspects of the field, including the resonant frequencies is increased that some metabolic chains are working more effectively or coherently, and utilize energy to maintain life and healthy function. This is also supported by the fact that people with a smaller BMI have higher negative correlations with LGMF activity which suggest – they are more sensitive to LGMF fluctuations (Table 3 and 4). It is natural that with age and obesity such sensitivity decreases. It is also interesting that found different sensitivities in different genders, that LGMF activity impacts and activates women and mens metabolic chains differently.
5. Conclusions
On the basis of obtained results, we can conclude, that correlations between LGMF and basal metabolic rate features are negative. More expressed negative correlations are seen in persons with smaller BMI. With age negative correlations with LGMF decrease in men group and increase in women group. Sensitivity of persons of different gender to LGMF – differ.
References
-
R. Blasco Redondo, “Gasto energético en reposo; métodos de evaluación y aplicaciones,” Nutricion Hospitalaria, Vol. 31, No. 3, pp. 245–254, Feb. 2015, https://doi.org/10.3305/nh.2015.31.sup3.8772
-
S. Sharma, T. Sheehy, F. Kolahdooz, and M. Barasi, Mityba. Vilnius, 2017.
-
J. A. Schrack, N. D. Knuth, E. M. Simonsick, and L. Ferrucci, ““IDEAL” Aging is associated with lower resting metabolic rate: the baltimore longitudinal study of aging,” Journal of the American Geriatrics Society, Vol. 62, No. 4, pp. 667–672, Apr. 2014, https://doi.org/10.1111/jgs.12740
-
C. K. Martin et al., “Effect of calorie restriction on resting metabolic rate and spontaneous physical activity,” Obesity, Vol. 15, No. 12, pp. 2964–2973, Dec. 2007, https://doi.org/10.1038/oby.2007.354
-
C. Henry, “Mechanisms of changes in basal metabolism during ageing,” European Journal of Clinical Nutrition, Vol. 54, No. S3, pp. S77–S91, Jun. 2000, https://doi.org/10.1038/sj.ejcn.1601029
-
M. R. Rizzo et al., “Resting metabolic rate and respiratory quotient in human longevity,” The Journal of Clinical Endocrinology and Metabolism, Vol. 90, No. 1, pp. 409–413, Jan. 2005, https://doi.org/10.1210/jc.2004-0390
-
C. Ruggiero and L. Ferrucci, “The endeavor of high maintenance homeostasis: resting metabolic rate and the legacy of longevity,” The Journals of Gerontology Series A: Biological Sciences and Medical Sciences, Vol. 61, No. 5, pp. 466–473, May 2006, https://doi.org/10.1093/gerona/61.5.466
-
M. Zampino, M. Alghatrif, P.-L. Kuo, E. M. Simonsick, and L. Ferrucci, “Longitudinal changes in resting metabolic rates with aging are accelerated by diseases,” Nutrients, Vol. 12, No. 10, p. 3061, Oct. 2020, https://doi.org/10.3390/nu12103061
-
S. Kim et al., “An elevation of resting metabolic rate with declining health in nonagenarians may be associated with decreased muscle mass and function in women and men, respectively,” The Journals of Gerontology Series A: Biological Sciences and Medical Sciences, Vol. 69, No. 6, pp. 650–656, Jun. 2014, https://doi.org/10.1093/gerona/glt150
-
R. McCraty, A. Deyhle, and D. Childre, “The global coherence initiative: creating a coherent planetary standing wave,” Global Advances in Health and Medicine, Vol. 1, No. 1, pp. 64–77, Mar. 2012, https://doi.org/10.7453/gahmj.2012.1.1.013
-
I. Timofejeva et al., “Identification of a group’s physiological synchronization with earth’s magnetic field,” International Journal of Environmental Research and Public Health, Vol. 14, No. 9, p. 998, Sep. 2017, https://doi.org/10.3390/ijerph14090998
-
A. Alabdulgader et al., “Long-Term study of heart rate variability responses to changes in the solar and geomagnetic environment,” Scientific Reports, Vol. 8, No. 1, Dec. 2018, https://doi.org/10.1038/s41598-018-20932-x
-
R. McCraty, M. Atkinson, V. Stolc, A. Alabdulgader, A. Vainoras, and M. Ragulskis, “Synchronization of human autonomic nervous system rhythms with geomagnetic activity in human subjects,” International Journal of Environmental Research and Public Health, Vol. 14, No. 7, p. 770, Jul. 2017, https://doi.org/10.3390/ijerph14070770
-
G. Jaruševičius, T. Rugelis, R. McCraty, M. Landauskas, K. Berškienė, and A. Vainoras, “Correlation between changes in local earth’s magnetic field and cases of acute myocardial infarction,” International Journal of Environmental Research and Public Health, Vol. 15, No. 3, p. 399, Feb. 2018, https://doi.org/10.3390/ijerph15030399
-
S. J. Palmer, M. J. Rycroft, and M. Cermack, “Solar and geomagnetic activity, extremely low frequency magnetic and electric fields and human health at the earth’s surface,” Surveys in Geophysics, Vol. 27, No. 5, pp. 557–595, Nov. 2006, https://doi.org/10.1007/s10712-006-9010-7
-
M. Landauskas, A. Vainoras, and M. Ragulskis, “Algebraic and spectral analysis of local magnetic field intensity,” Proceedings of the Lithuanian Mathematical Society Mathematic, Vol. 56, pp. 54–59, Dec. 2015, https://doi.org/10.15388/lmr.a.2015.10
-
G. Taletaviciene, R. McCraty, V. Pestininkas, and A. Vainoras, “Investigation of parallels between human basal metabolic features and local Earth magnetic field,” Journal of Complexity in Health Sciences, Vol. 4, No. 1, pp. 31–37, Jun. 2021, https://doi.org/10.21595/chs.2021.22123
Cited by
About this article

