Abstract
The motors are critical components of the electromechanical transmission in vehicles, and its operating status directly affects the maneuverability of vehicles. To quickly and accurately identify the operating status of motors, this paper proposes a new entropy - Composite Multi-scale Weighted Reverse Slope Entropy (CMWRSlE) for motor fault diagnosis, which is a more interpretable entropy due to its deep exploration of signals. Firstly, the composite multi-scale weighted reverse slope entropy values are extracted from the vibration signals of the motor in different states; Secondly, the extracted features are dimensionally reduced by the manifold learning algorithm – Neighbourhood Preserving Embedding (NPE) and classified by the hierarchical prototype-based approach (HPA) to achieve the fault diagnosis of the motor. Finally, the method proposed in this paper is validated through two sets of experimental data: motor rotor faults and motor bearing faults. The results show that the accuracy of the proposed method in motor fault diagnosis reaches 100 %, which indicates the effectiveness of the proposed method.
1. Introduction
The motors are key components of the electro-mechanical compound transmission of vehicles. If fails, it will seriously damage the stability of the vehicle and affect driving safety [1]. Cai et al. [2] reviewed the latest research and technological progress in the motor system and electric transmission system of new energy vehicles, including comparison of motor types and characteristics, as well as control methods for motors. Choudhary et al. [3] sorted out various types of motor faults and their probability statistics, among which the more significant faults include motor bearing faults, motor stator and rotor faults, etc., and listed the state monitoring techniques and methods of the motor. Liu et al. [4] and Smith et al. [5] conducted simulation experiments on motor rotor faults and bearing faults respectively, providing data support for motor fault diagnosis. Yousfi et al. [6] coupled the electrical model of an induction motor with a centralized parameter model of a two-stage gear system to establish an integrated model. Through time-domain and frequency-domain analysis of vibration and motor current characteristics, fault detection of gear teeth was ultimately achieved. Rafaq et al. [7] reviewed parameter estimation techniques for permanent magnet synchronous motors. Despite the successful applications of parameter identification technology, it still has some limitations. For example, it could not cover all possible fault situations, especially when facing complex systems or new equipment, and require expert knowledge of the system.
At present, data-driven methods are mainly used for motor fault diagnosis [8], and fault type recognition is achieved through machine learning such as neural networks and support vector machines [9]. However, the classification accuracy of neural networks is limited by the small sample size of motor faults [10]. To improve the accuracy of fault diagnosis and increase the interpretability of fault diagnosis, it is necessary to extract features from fault data, and then combine dimensionality reduction algorithms and classifiers to achieve motor fault recognition. In the diagnosis of mechanical and electrical system dynamics faults, entropy is widely used due to its nonlinear characterization ability and clear physical significance [11], such as multi-scale permutation entropy [12], refined composite generalized multi-scale bubble entropy [13], and composite multi-scale weighted slope entropy [14]. In terms of feature dimensionality reduction, manifold learning could map high-dimensional data to low-dimensional spaces in a nonlinear way, mine the inherent low-dimensional structures hidden in high-dimensional spaces, and thereby improve the classification distance among fault features.
Based on the above description, this article proposes a new feature – CMWRSlE for motor fault representation, which combines manifold learning algorithm NPE [15] and hierarchical prototype machine [16] to achieve motor fault diagnosis. The effectiveness of this feature is verified through two types of motor fault test data.
2. Composite multi-scale weighted reverse slope entropy
2.1. Reverse slope entropy
Standardization of vibration sequences is performed as:
in which and respectively are the mean and the standard deviation of vibration sequences , and then a new time series , is obtained according to Eq. (1) to ensure the following slope entropy computation. Then the subsequence is obtained as following:
in which , represents the embedding dimension and represents the delay time. Consider the difference in adjacent amplitudes , and then divide it with the number of segments as shown in Fig. 1, namely.
1) When , the identifier was set as +2.
2) When and , the angle is below 45° and above a small area near 0°, set the identifier as +1.
3) When , in a small area near 0°, the identifier was set as 0.
4) When and , the angle is above –45° and below the small area near 0°, set the identifier as -1.
5) When , the identifier was set as –2.
Fig. 1Slope entropy with five division levels
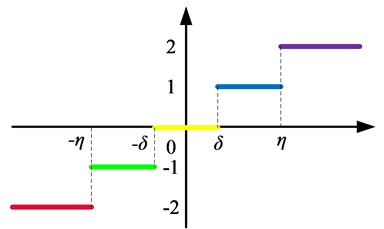
There are a total of types of permutation patterns that may appear after the symbolization of -dimensional vectors. Let be the number of all pattern types, be the th pattern and , then the probability of each pattern is as follows:
in which is the indicator function of set . When , ; when , . Substitute Eq. (3) into Eq. (4), and then the slope entropy of the vibration sequence at the specified embedding dimension and delay parameter is obtained as:
Considering the volatility of vibration sequences under the same structure, an improved algorithm is proposed as shown in Fig. 2 [17]. In this algorithm, the same structured data is weighted based on its volatility, and Eq. (3) is replaced with:
When , and , the above equation degenerates to Eq. (3). Substitute the statistical results of each pattern obtained from Eq. (5) into Eq. (4) and the weighted slope entropy is derived.
In addition, Bandt proposed a reverse permutation entropy [18] to measure the distance between useful information and white noise. On this basis, this paper proposes the weighted reverse slope entropy:
Fig. 2Volatility of data with the same structure [17]
![Volatility of data with the same structure [17]](https://static-01.extrica.com/articles/24009/24009-img2.jpg)
2.2. Composite multi-scale weighted reverse slope entropy
Composite coarse-grained the sequence to obtain the sequence , that is:
where, is the scale factor, and is the maximum scale factor. Under scale factor , calculate the weighted reverse slope entropy of coarse-grained sequences and take the mean to obtain the composite weighted reverse slope entropy under scale :
Combine the composite weighted reverse slope entropy at multiple scales and the composite multi-scale weighted reverse slope entropy as a vector is obtained finally.
2.3. Neighbourhood preserving embedding
Assuming the high-dimensional state space , where in this paper, the goal of the NPE algorithm is to find the optimal projection matrix , and map high-dimensional data to relatively low dimensional feature spaces through dimensionality reduction [15]. The detailed algorithm is as follows:
(1) Determine the nearest neighbor points. Use the -nearest neighbor method to find the sample points closest to the sample point , in which Euclidean distance is often employed as a measure between the sample point and the sample points in the original manifold and then the neighborhood points are selected. Each sample point is only reconstructed from the relevant nearest neighbor points, and when is not a neighborhood of , the connection weight .
(2) Reconstruct the weight matrix. Reconstruct of each data point ci linearly from neighboring points, and calculate of the reconstruction weight matrix for this sample point. Minimize the following reconstruction error:
where, .
(3) Calculate the feature mapping matrix. Maintain the linear reconstruction weight of the sample points unchanged, reconstruct the original data sample, and minimize the reconstruction error, i.e.:
where, , is the identity diagonal matrix. Constraints are:
By using the Lagrangian method, the objective function and constraint conditions are merged and derived, and the minimization problem of the objective function can be transformed into solving the generalized eigenvalue problem as shown in Eq. (11):
Since and are semi positive definite matrices, the eigenvectors corresponding to the smallest eigenvalues form the projection matrix :
Then a low dimensional representation of in the low dimensional space is obtained, and is the reduced dimensional data matrix.
2.4. Motor fault diagnosis flowchart
The motor fault diagnosis process based on CMWRSlE and NPE is as follows:
1) Collect vibration signals of motor normal and different fault types, and set the data length to extract composite multi-scale weighted reverse slope entropy.
2) Normalize each segment of data and then extract CMWRSlE, with parameters set as: embedding dimension 3, maximum scale factor 30, symbol segmentation parameters 1, 0.001.
3) The number of neighboring points in NPE is 5, and the first 5 principal components (PCs) after dimensionality reduction are taken as training features.
4) Set the number of training samples and testing samples respectively for each type of motor fault, substitute the training samples into the HPA for classification training while the testing samples for testing, and define the classification accuracy as:
where, and respectively represents the total number of correctly classified samples and the total number of test samples.
3. Experiment and results
3.1. Motor rotor fault data from Wuhan University in China
The simulation test bench for motor rotor faults at Wuhan University in China is shown in Fig. 3 [4]. The vibration signals of the motor rotor state include four types: normal, contact friction, imbalance, and misalignment. The rotor imbalance is simulated by screwing a 2 g mass block into the threaded hole at the edge of the mass disk; misalignment is achieved by changing the relative position of the shafts at both ends of the coupling; contact friction fault is achieved by screwing the friction screw into the shell of the friction screw and then contacting the rotating shaft. During the signal acquisition process of normal and various faults, the rotor speed is 1200 r/min, the sampling frequency is 2048 Hz, and the sampling time is 1 s. The rotor state data used in this paper are pre-processed with wavelet threshold denoising, as shown in Fig. 4.
Fig. 3Rotor laboratory bench [4]
![Rotor laboratory bench [4]](https://static-01.extrica.com/articles/24009/24009-img3.jpg)
45 sets of data were collected for each type of rotor state, and a total of 180 sets of data were acquired finally. The mean and the standard deviation (std) of the entropy values at each scale factor are calculated as shown in Fig. 5(a), while the mean and the std of the first three PCs after NPE dimensionality reduction are shown in Fig. 5(b). As the first three PCs shown in Fig. 6, it is indicated that various faults of the motor rotor can be clearly identified.
Randomly select 10 training samples from each state, which are then dimensionally reduced by NPE and brought into the HPA for training. The rest 35 samples are then dimensionally reduced by NPE and used as testing samples. Randomly select 10 training samples and repeat the above test 100 times. The classification results are shown in Table 1, and the classification accuracy of each test is 100 %.
Fig. 4Vibration signals of rotor faults
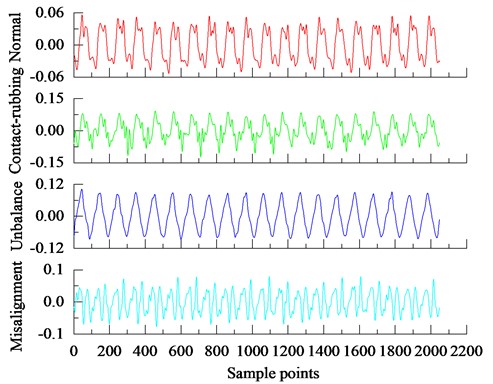
Fig. 5Statistics of motor rotor fault features
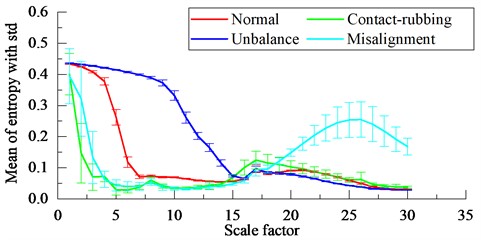
a) The mean with the corresponding std of the entropy values at each scale factor
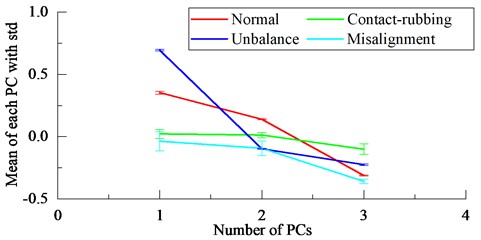
b) The mean with the corresponding std of the first three PCs
Fig. 6The first three PCs of state features of motor rotor with NPE
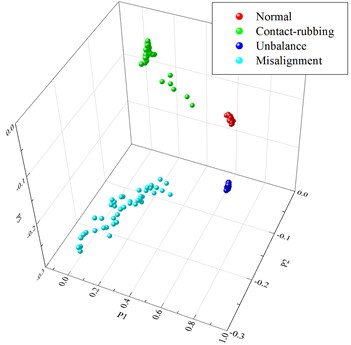
Table 1Comparison with literature [4]
Method | Minimum classification accuracy | Maximum classification accuracy | Mean |
EEMD-CC | 98 % | 100 % | 99.29 % |
this paper | 100 % | 100 % | 100 % |
3.2. Motor bearing failure data from Case Western Reserve University in the United States
The artificial fault bearing experimental device at Case Western Reserve University (CWRU) consists of a driving motor, a loading motor, a torque sensor, etc. The test bearing is installed at the driving end, and the deep groove ball bearing model is SKF6205, as shown in Fig. 7 [5]. There are three types of single point damage on bearings processed by electric discharge: rolling element failure (BF), inner ring failure (IRF), and outer ring failure (ORF). The diameter of single point damage for each fault type is shown in Table 2, which represents the degree of damage. During the signal acquisition process of normal and various bearing faults, the sampling frequency is 12 kHz and the sampling time is 1 second. Fig. 8 shows the fault signals of each rolling bearing component at the damage diameter 0.007 inches with the sampling length 2048.
Fig. 7Bearing fault test rig of CWRU [5]
![Bearing fault test rig of CWRU [5]](https://static-01.extrica.com/articles/24009/24009-img8.jpg)
Extract 50 samples of fault feature vectors for normal and various fault types of bearings in Table 2, and a total of 500 samples are obtained. The mean and the standard deviation (std) of the entropy values at each scale factor are calculated as shown in Fig. 9(a), while the mean and the std of the first three PCs of various fault characteristics of motor bearings in Table 2 after NPE dimensionality reduction are shown in Fig. 9(b). As the first three PCs shown in Fig. 10(a), it can be seen that there is a slight overlap between BF21 and ORF14, but the two can be clearly separated in the fourth to sixth PCs as shown in Fig. 10(b).
10 samples of training samples were randomly selected for the normal state and each type of fault of the motor bearings. After NPE dimensionality reduction, they were brought into the HPA for training, while the rest 40 samples were used as testing samples after NPE dimensionality reduction. Randomly select 10 training samples and repeat the above test 20 times, and the classification accuracy of each test is 100 %.
Fig. 8Vibration signals at the damage level 0.007 inch for different fault types of bearings on the condition of load 2 hp and rotating speed 1750 r/min
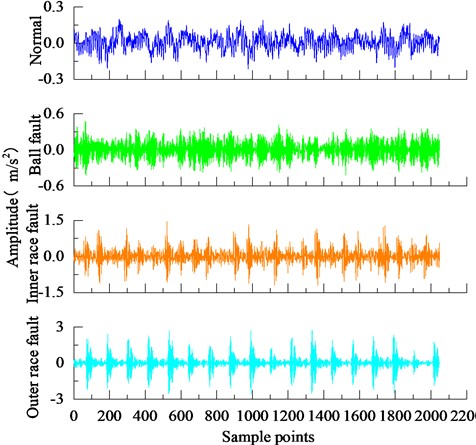
Fig. 9Statistics of motor bearing fault features
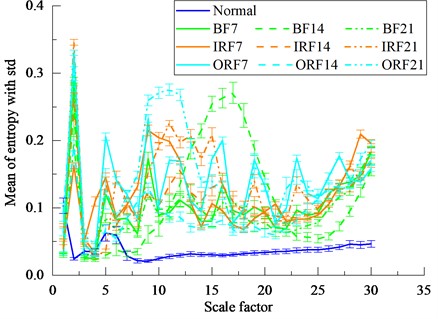
a) The mean with the corresponding std of the entropy values at each scale factor
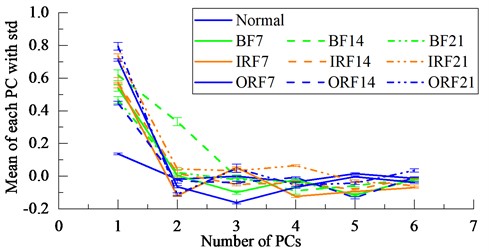
b) The mean with the corresponding std of the first three PCs
Table 2Design of test experiment schemes regarding faulty motor bearings
Working condition | Fault types | Damage diameter (inch) | Training samples | Testing samples | Label | |
Load (hp) | Speed (rpm) | |||||
2 | 1750 | normal | 0 | 10 | 40 | 1 |
2 | 1750 | RF | 0.007 | 10 | 40 | 2 |
2 | 1750 | RF | 0.014 | 10 | 40 | 3 |
2 | 1750 | RF | 0.021 | 10 | 40 | 4 |
2 | 1750 | IRF | 0.007 | 10 | 40 | 5 |
2 | 1750 | IRF | 0.014 | 10 | 40 | 6 |
2 | 1750 | IRF | 0.021 | 10 | 40 | 7 |
2 | 1750 | ORF | 0.007 | 10 | 40 | 8 |
2 | 1750 | ORF | 0.014 | 10 | 40 | 9 |
2 | 1750 | ORF | 0.021 | 10 | 40 | 10 |
Fig. 10The first six PCs of fault features of motor bearings with NPE
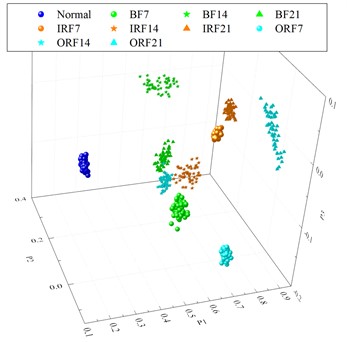
a) The first three PCs
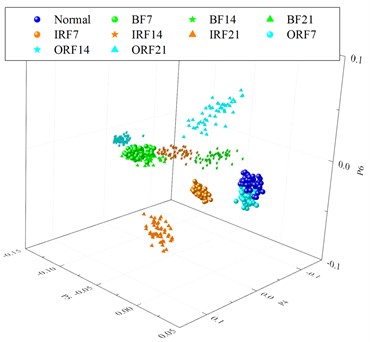
b) The fourth to sixth PCs
4. Conclusions
The CMWRSlE proposed in this article could consider the influence of the structure, multi-scale characteristics, and amplitude effects of motor fault vibration data, thereby more accurately mining fault features and noise suppression. By combining the proposed CMWRSlE with NPE for motor fault diagnosis, the fault classification accuracy of the two sets of data was 100 % after 100 and 20 random sample tests, respectively. It can be seen that CMWRSlE can accurately and stably characterize motor faults, achieve accurate positioning of motor bearing faults, and effectively identify more types of motor faults under complex working conditions.
References
-
P. Gao, X. Su, Z. Pan, M. Xiao, W. Zhang, and R. Liu, “Active disturbance rejection control for speed control of PMSM based on auxiliary model and supervisory RBF,” Applied Sciences, Vol. 12, No. 21, p. 10880, Oct. 2022, https://doi.org/10.3390/app122110880
-
W. Cai, X. Wu, M. Zhou, Y. Liang, and Y. Wang, “Review and development of electric motor systems and electric powertrains for new energy vehicles,” Automotive Innovation, Vol. 4, No. 1, pp. 3–22, Feb. 2021, https://doi.org/10.1007/s42154-021-00139-z
-
A. Choudhary, D. Goyal, S. L. Shimi, and A. Akula, “Condition monitoring and fault diagnosis of induction motors: a review,” Archives of Computational Methods in Engineering, Vol. 26, No. 4, pp. 1221–1238, Sep. 2018, https://doi.org/10.1007/s11831-018-9286-z
-
D. Liu, Z. Xiao, X. Hu, C. Zhang, and O. P. Malik, “Feature extraction of rotor fault based on EEMD and curve code,” Measurement, Vol. 135, pp. 712–724, Mar. 2019, https://doi.org/10.1016/j.measurement.2018.12.009
-
W. A. Smith and R. B. Randall, “Rolling element bearing diagnostics using the Case Western Reserve University data: a benchmark study,” Mechanical Systems and Signal Processing, Vol. 64-65, pp. 100–131, Dec. 2015, https://doi.org/10.1016/j.ymssp.2015.04.021
-
B. E. Yousfi, A. Soualhi, K. Medjaher, and F. Guillet, “Electromechanical modeling of a motor-gearbox system for local gear tooth faults detection,” Mechanical Systems and Signal Processing, Vol. 166, p. 108435, Mar. 2022, https://doi.org/10.1016/j.ymssp.2021.108435
-
M. S. Rafaq and J.-W. Jung, “A comprehensive review of state-of-the-art parameter estimation techniques for permanent magnet synchronous motors in wide speed range,” IEEE Transactions on Industrial Informatics, Vol. 16, No. 7, pp. 4747–4758, Jul. 2020, https://doi.org/10.1109/tii.2019.2944413
-
S. Gawde, S. Patil, S. Kumar, P. Kamat, K. Kotecha, and A. Abraham, “Multi-fault diagnosis of Industrial Rotating Machines using Data-driven approach: a review of two decades of research,” Engineering Applications of Artificial Intelligence, Vol. 123, p. 106139, Aug. 2023, https://doi.org/10.1016/j.engappai.2023.106139
-
S. Bi et al., “A comprehensive survey on applications of AI technologies to failure analysis of industrial systems,” Engineering Failure Analysis, Vol. 148, p. 107172, Jun. 2023, https://doi.org/10.1016/j.engfailanal.2023.107172
-
X. Xu, X. Qiao, N. Zhang, J. Feng, and X. Wang, “Review of intelligent fault diagnosis for permanent magnet synchronous motors in electric vehicles,” Advances in Mechanical Engineering, Vol. 12, No. 7, Jul. 2020, https://doi.org/10.1177/1687814020944323
-
Y. Li, X. Wang, Z. Liu, X. Liang, and S. Si, “The entropy algorithm and its variants in the fault diagnosis of rotating machinery: A review,” IEEE Access, Vol. 6, pp. 66723–66741, Jan. 2018, https://doi.org/10.1109/access.2018.2873782
-
J. Zhang, Y. Zhao, M. Liu, and L. Kong, “Bearings fault diagnosis based on adaptive local iterative filtering-multiscale permutation entropy and multinomial logistic model with group-lasso,” Advances in Mechanical Engineering, Vol. 11, No. 3, p. 168781401983631, Mar. 2019, https://doi.org/10.1177/1687814019836311
-
J. B. Zhang, T. G. Zou, M. Wang, and S. D. Chen, “Bearing fault diagnosis based on the refined composite generalized multi-scale bubble entropy,” in 2021 4th International Conference on Electron Device and Mechanical Engineering (ICEDME), pp. 172–175, Mar. 2021, https://doi.org/10.1109/icedme52809.2021.00044
-
J. B. Zhang, Z. Y. Pan, J. L. Zhang, J. X. Bian, and C. Wang, “Rolling bearing state assessment based on the composite multiscale weight slope entropy and hierarchical prototype-based approach,” Advances in Mechanical Engineering, Vol. 14, No. 11, pp. 1–11, 2022, https://doi.org/10.1177/16878
-
Xiaofei He, Deng Cai, Shuicheng Yan, and Hong-Jiang Zhang, “Neighborhood preserving embedding,” in 10th IEEE International Conference on Computer Vision (ICCV’05), Vol. 2, pp. 1208–1213, Jan. 2005, https://doi.org/10.1109/iccv.2005.167
-
X. Gu and W. Ding, “A hierarchical prototype-based approach for classification,” Information Sciences, Vol. 505, pp. 325–351, Dec. 2019, https://doi.org/10.1016/j.ins.2019.07.077
-
B. Fadlallah, B. Chen, A. Keil, and J. Príncipe, “Weighted-permutation entropy: A complexity measure for time series incorporating amplitude information,” Physical Review E, Vol. 87, No. 2, p. 02291, Feb. 2013, https://doi.org/10.1103/physreve.87.022911
-
C. Bandt, “A new kind of permutation entropy used to classify sleep stages from invisible EEG microstructure,” Entropy, Vol. 19, No. 5, p. 197, Apr. 2017, https://doi.org/10.3390/e19050197
About this article
The authors would like to acknowledge the anonymous reviewers for their valuable and constructive comments. This study was supported by the National Natural Science Foundation of China (No. 52175074).
The datasets generated during and/or analyzed during the current study are available from the corresponding author on reasonable request.
Shenlong Li: supervision, validation. Jinbao Zhang: writing-original draft preparation, software, conceptualization. Yaoheng Li: writing-review and editing. Jinle Zhang: formal analysis, funding acquisition, investigation. Bingxian Zhu: visualization.
The authors declare that they have no conflict of interest.
