Abstract
Atmospheric air pollution with fine particles PM2.5 and PM10 is one of the main environmental problems of the city. This paper presents the results of the study of quantitative and structural components of solid particles’ emissions in the city of Almaty, released during the operation of cars: by an engine with exhaust gases, by tire abrasion, by braking devices (linings) and road pavement wear. РM solid particles in the amount of 543.2 tons are released annually into the atmospheric air of Almaty by motor transport. The bulk PM10 is released totally from the tires, brakes and road – 65.4 %, from the engine – 34.6 %. On diesel buses and trucks, the bulk РM particles’ emissions are released from the exhaust gas engines. Recommendations are given to reduce PM particles emitted by motor transport.
1. Introduction
According to WHO, air pollution is one of the most serious environmental threats to human health. Reducing the level of air pollution, countries can decrease the burden of such diseases as stroke, heart disease, lung cancer and chronic or acute respiratory diseases, including asthma [1].
Among atmospheric air pollutants, a special role belongs to solid particles, including fine particles PM10 and PM2.5. PM10 solid particles are fine particles with an aerodynamic diameter less than 10 microns, and PM2.5 are fine particles with an aerodynamic diameter less than 2.5 microns. When inhaled, PM2.5 particles penetrate deep into the lungs and enter the bloodstream. The concentration of fine particles is a frequently used indirect indicator of the level of air pollution. There is convincing evidence that exposure to this pollutant negatively affects human health [1].
Serious consequences for health, such as: respiratory diseases, cardiovascular disorders, cerebrovascular diseases, cancer, reproductive health and other diseases, and increased mortality, are related to PM solid particles, [2-6].
Maximum levels of atmospheric air pollution by fine particles are observed in the cities with developed industry and heavy traffic [7]. Not only the emission sources are concentrated in cities, but the ability of pollutants to disperse into the air is limited by the physical characteristics of the urban environment [7-9]. In addition, due to the high density of the residential buildings, large number of urban populations may be adversely affected by polluted air [9].
Researchers register an increase in average annual concentrations of PM2.5 in 65 % of urban areas between 2000 and 2019 [8]. Vehicle emissions are an important source of fine particles’ entry into the atmospheric air [10-12]. Thus, according to research by Wei-Yi Pan and Hong-Yan Shen, car emissions amounted to 77 % of total PM10 emissions in the studied city [10]. According to Brazilian researchers, vehicle emissions amounted to, at least, 40 % of PM2.5 amount in the cities [13]. According to the US EPA, the transportation sector is responsible for 10 % of U.S. PM2.5 and PM10 emissions [14].
Emissions from the operation of various types of vehicles have their own specifics. Emissions of solid particles during operation of cars occur not only from the exhaust gases of the engines, but also during tire abrasion, from braking devices (linings) and road pavement wear [15-17].
Mainly carbon compounds enter the atmospheric air with exhaust gases/ Particles formed during mechanical abrasion of brakes and tires include microelements (Ba, Cu, Mn, Pb and Zn), road dust includes such elements as Al, Ca, Fe, Mn, Si and Ti [15].
Solid particles emitted during the operation of cars settle on the road, and then re-transform into the suspended status together with particles of mineral dust and road wear materials. This creates a high risk of human exposure to minerals, metalloids and heavy metals [15-17].
Atmospheric air pollution is the key environmental problem in large cities of Kazakhstan. This problem is most acute in the cities of Almaty, Astana, Ust-Kamenogorsk and Karaganda. These cities are characterized by high air pollution by harmful substances, especially PM solid particles, the content of which is several times higher than the established standards [18], [19].
The city of Almaty, where more than 2 million people live, deserves special attention. The specific geographical and meteorological conditions of the city of Almaty, low level of air exchange contribute to the accumulation of pollutants in the air and formation of smog. The main sources of air pollution in the city are coal-operated thermal power plants, heating devices of the private sector using solid fuel, as well as vehicle emissions. The latter amounts to more than 60 % of the total gross emissions in the city. The most polluted areas of the city are mainly confined to the areas with heavy traffic [20].
The average annual concentration of PM2.5 in 2018 was 53 micrograms/m3, which was 5.3 times higher than the WHO annual limit for PM2.5. The average annual concentrations of PM10 and NO2 in the air exceeded the WHO annual limits by 3.9 and 3.2 times, respectively [19]. In 2021, the average annual concentration of PM2.5 in Almaty was 35.3 micrograms/m3, which exceeded the WHO standard by 7.1 times. The average daily levels of PM2.5 in the atmospheric air were exceeded during 217 days [21].
Emissions from road transport in the city of Almaty have the priority impact on the quality of atmospheric air in the residential areas, primarily, adjacent to the roads with heavy traffic. It was found out that the increase of PM10 and PM2.5 fine particles level in the atmospheric air, as well as NO2 and CO, grows when the traffic intensity increases. During the daytime, as the traffic enhances, the concentration of PM2.5 increases above the permissible standards. The significance of the impact of road transport emissions on the atmospheric air quality in Almaty was confirmed by observations made during the Covid 19 quarantine in 2019 [19] and the January 2022 events [20].
Thus, the movement of motor vehicles is an important source of solid particles inflow into the environment. Cities around the world are working on measures to reduce emissions from motor vehicles and prevent exposure to traffic-related air pollutants [15]. The similar task is acute in the city of Almaty. The proposed measures should take into account quantitative data and the composition of solid particles and dust emitted into the city's atmospheric air by motor transport in total and separately - by the types of their formation. At the same time, there was no information on emissions from motor transport in Almaty. This was the basis for this study, the main purpose of which was to investigate the quantitative and structural components of solid particles emitted during operation of cars with the engines’ exhaust gases, from tire abrasion, braking devices (linings) and road pavement wear.
The originality and novelty of this work lies in the quantitative and qualitative analysis of PM solid particles’ emissions of motor transport released by sources of their formation, by groups of motor vehicles according to types and ecological classes as regards the municipal scale.
2. Methods
The assessment of the impact of emissions from road transport on the city’s air environment was carried out by calculating the amount of pollutants’ emissions using a methodology developed on the basis of the international EMEP/EEA Emission Inventory methodology (CORINAIR). COPERT 5.7 computer program was used to calculate emissions generated by road transport, taking into account the structure and condition of the fleet of vehicles in Almaty [22], [23].
The emissions of fine solid particles (PM10 and PM2.5) and total suspended solids (TSP) are calculated totally and separately for each source of emissions: exhaust gases of the engines, wear of brake linings and abrasion of the road pavement.
The effect of urban traffic intensity on solid particles’ emissions was carried out on the basis of emission calculations for average traffic speeds of 20 km/h and 40 km/h.
To compare specific emissions from different types of vehicles in Almaty, emissions of PM10, PM2.5 solid particles and TSP dust from passenger cars, diesel trucks and diesel buses were determined.
3. The results of the study
The status of the atmospheric air in Almaty is under constant control of the environmental service and the akimat of the city. Decisions are being made and a wide range of diverse activities are being carried out aimed at reducing the negative environmental impact of road transport, industrial enterprises and private sector. Constant monitoring of the air condition is carried out at KazHydromet monitoring posts on the level of atmospheric air pollution, at the environmental posts of ECOSERVICE-S and others. However, despite the measures taken, the levels of air pollution in the city remain increased today.
For example, continuous measurements at ecological post No. 2 ECOSERVICE-C on Shevchenko Street during the day (February 6, 2024) confirm an increased level of fine particles in the atmospheric air. It was found out that the average daily concentration of PM10 (0.082 mg/m3) exceeds the maximum permissible concentration (MPC.c. 0.06 mg/m3) by 1.37 times, the maximum concentration (0.140 mg/m3) by 2,3 times. The average daily concentration of PM2.5 (0.058 mg/m3) exceeds maximum permissible concentration (MPC.c. 0.035 mg/m3) by 1.7 times, maximum concentration (0.10 mg/m3) by 2.8 times. The exceedance of the concentration of PM solid particles above standard values is observed in the daytime and in the evening, which is associated with emissions from moving vehicles.
As per August 2023, 585354 motor vehicles were registered in the city of Almaty. The amount of emissions of pollutants from road transport is 65964.7 tons per year. Including: carbon monoxide (CO) emissions amount to 46490.3 tons (70.5 % of the emissions of all pollutants), hydrocarbons (CH) – 5509.6 tons (8.4 %), nitrogen oxides (NOx) – 7371.7 tons (11.3 %), sulfur oxides (SO2) – 146.7 tons (0.3 %), non-methane hydrocarbons (NMVOC) – 5260.1 tons (8.1%), PM10 and PM2.5 solid particles – 543.2 tons (0.8 %).
As it was noted earlier, PM solid particles during the operation of cars in the city are emitted not only from the exhaust gases of the engines, but also from tire abrasion, brake wear and abrasion of the road pavement. The results of calculations of solid particles’ emissions (PM10 and PM2.5) and total suspended particles (TSP) in total and separately for each source of vehicle emissions in the city of Almaty are given in Table 1.
Emissions of PM10 particles from motor vehicles amount to 543.2 tons per year. Including, 187.6 tons (34.6 % of all PM10 emissions), are emitted by engines, 84.5 tons (15.5 %) – due to tire abrasion, 188.8 tons (34.8 %) – due to brakes wear and 87.1 tons (15.1 %) – due to road pavement wear. PM10 bulk is emitted totally due to the abrasion of tires, brakes and roads – 65.4 %, the engine – 34.6 %.
Emissions of PM2.5 particles amount to 366.6 tons per year. Including: 187.6 tons (51.3 % of all PM2.5 emissions) are emitted by the engines, 59.1 tons (16.1 %) – due to tire abrasion, 75.1 tons (20.5 %) – due to brake wear and 44.1 tons (12.1 %) – due to road pavement wear. The main part of PM2.5 is emitted by the engines – 51.3 %, the rest – due to tires, brakes and the road wear (48.7 %).
Table 1Emissions of PM10, PM2.5 solid particles and TSP dust from motor vehicles in Almaty
Name | Emissions under average speed of 20 km/h | Emissions under average speed of 40 km/h | Relation of emissions under speed of 40 km/h to emissions under speed of 20 km/h, % | ||||
Tons | % | Tons | % | ||||
Solid particles РМ | РМ10 emissions, tons/year | Engines | 187.6 | 34.6 | 118.0 | 24.8 | 62.9 |
Tires | 84.5 | 15.5 | 84.5 | 17.7 | 100.0 | ||
Brakes | 188.8 | 34.8 | 188.8 | 39.8 | 100.0 | ||
Roads | 81.7 | 15.1 | 81.7 | 17.7 | 100.0 | ||
Total | 543.2 | 100.0/59.7 | 473.6 | 100.0/61.5 | 87.2 | ||
РМ2.5 emissions, tons/year | Engines | 187.6 | 51.3 | 118.0 | 39.8 | 62.9 | |
Tires | 59.1 | 16.1 | 59.1 | 19.9 | 100.0 | ||
Brakes | 75.1 | 20.5 | 75.1 | 25.4 | 100.0 | ||
Roads | 44.1 | 12.1 | 44.1 | 14.9 | 100.0 | ||
Total | 366.6 | 100.0/40.3 | 297.0 | 100.0/38.5 | 81.1 | ||
Total dust TSP | Total dust TSP emissions, tons/year | Engines | 187.6 | 27.4 | 118.0 | 19.2 | 62.9 |
Tires | 140.8 | 20.6 | 140.8 | 22.9 | 100.0 | ||
Brakes | 192.6 | 28.2 | 192.6 | 31.4 | 100.0 | ||
Roads | 163.4 | 23.8 | 163.4 | 26.5 | 100.0 | ||
Total | 685.0 | 100.0 | 615.4 | 100.0 | 89.8 | ||
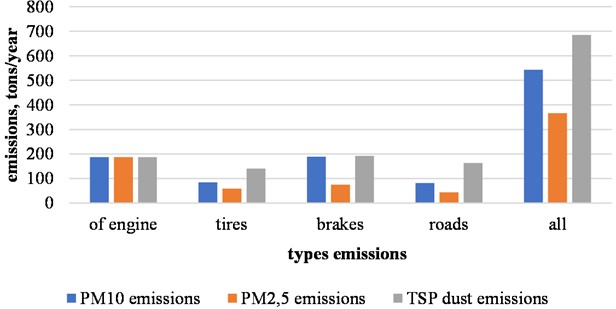
Total TSP dusts are emitted in the amount of 685.0 tons per year, including: by the engines -187.6 tons (27.4 % of all TSP emissions), due to tire abrasion – 140.8 tons (20.6 %), due to brake wear – 192.6 tons (28.2 %) and due to road pavement wear – 163.4 tons (12.1 %). Total TSP dust emissions include 79.3 % of PM10 and PM2.5 emissions. The distribution of solid particles’ emissions by the types of their formation is presented in Fig. 1.
Fig. 1Emissions of solid particles from motor vehicles by different types of formation
With an increase of the average speed of traffic in the city from 20 km/h to 40 km/h, emissions of PM particles and TSP dust from engines’ exhaust gases alone decrease by 37.1%. Emissions due to abrasion of tires, brakes and roads do not change (Table 1).
To compare emissions from different types of vehicles in Almaty, emissions of solid particles PM10, PM2.5 and TSP dust from passenger cars, diesel trucks and diesel buses were determined (Table 2).
Emissions of PM10 particles by passenger cars amounted to 296.7 tons per year (54.7 % of all PM10 emissions). Including, 29.3 tons (15.7 % of PM10 emissions) are emitted by engines, 66.6 tons (79.3 %) – due to tire abrasion, 145.3 tons (77.3 %) – due to brake wear and 54.8 tons (67.0 %) – due to road pavement wear. Emissions of PM2.5 particles amount to 164.0 tons per year and to 44.8 % of all emissions of PM2.5. The distribution of emissions of PM2.5 by type of formation is approximately the same as for PM10. Total TSP dust from passenger cars is emitted in the amount of 398.9 tons per year and 58.2 % of all TSP emissions.
Table 2Comparative emissions of PM10, PM2.5 solid particles and TSP dust from passenger cars, diesel trucks and diesel buses in Almaty
Name | All vehicles | Passenger cars | Trucks, diesel | Buses, diesel | ||||
Number of vehicles, units | 570330 | 519167 | 29339 | 3547 | ||||
Solid particles | Emissions | Emissions | Emissions | Emissions | ||||
Tons | Tons | % | Tons | % | Tons | % | ||
PM10 emissions, tons/year | Engine | 187.6 | 29.3 | 15.7 | 50.1 | 28.8 | 103.5 | 55.3 |
Tires | 84.5 | 66.6 | 79.3 | 5.5 | 6.5 | 6.8 | 8.1 | |
Brakes | 188.8 | 145.3 | 77.3 | 12.8 | 6.8 | 19.3 | 10.2 | |
Roads | 81.7 | 54.8 | 67.0 | 8.9 | 10.9 | 13.5 | 16.6 | |
Total | 543.2 | 296.7 | 54.7 | 77.3 | 14.2 | 143.1 | 26.3 | |
PM2.5 emissions, tons/year | Engine | 187.6 | 29.3 | 15.6 | 50.1 | 26.8 | 103.5 | 55.3 |
Tires | 59.1 | 46.6 | 78.9 | 3.9 | 6.6 | 4.8 | 8.1 | |
Brakes | 75.1 | 57.8 | 77.0 | 5.1 | 8.6 | 7.7 | 13.0 | |
Roads | 44.1 | 29.6 | 67.2 | 4.8 | 10.9 | 7.3 | 16.6 | |
Total | 366.6 | 164.0 | 44.8 | 63.8 | 17.4 | 123.2 | 33.7 | |
Emissionsof total dustTSP, tons/year | Engine | 187.6 | 29.3 | 15.6 | 50.1 | 26.8 | 103.5 | 55.3 |
Tires | 140.8 | 111.0 | 78.7 | 9.2 | 6.6 | 11.4 | 8.1 | |
Brakes | 192.6 | 148.3 | 77.2 | 13.0 | 6.8 | 19.7 | 10.3 | |
Roads | 163.4 | 109.7 | 67.3 | 17.8 | 10.9 | 27.0 | 16.5 | |
Total | 685.0 | 398.9 | 58.2 | 90.1 | 13.1 | 161.5 | 23.6 | |
PM10 emissions, kg / car | 0.95 | 0.57 | 2.63 | 40.34 | ||||
PM2.5 emissions, kg / car | 0.64 | 0.31 | 2.17 | 34.73 | – | |||
Note: the percentages indicate the share of emissions depending on the car type in total amount of emissions from all motor vehicles | ||||||||
PM10 77.3 tons per year (14.2 %), PM2.5 – 63.8 tons (17.4 %) and TSP – 90.1 tons (13.1 %) are emitted by diesel trucks. By diesel buses: PM10 – 143.1 tons per year (26.3 %), PM2.5 – 123.2 tons (33.7 %) and TSP – 161.5 tons (23. 6%) are emitted.
It is typical that PM particles’ bulk emissions from diesel buses and trucks occur because of the exhaust gases of the engine. Thus, PM10 emissions from the bus engine amount to 55.3% of total emissions, the remaining emissions (due to abrasion of tires, brakes and roads) – 44.7 % (Table 2).
Fig. 2Solid particles’ emissions by motor vehicles types
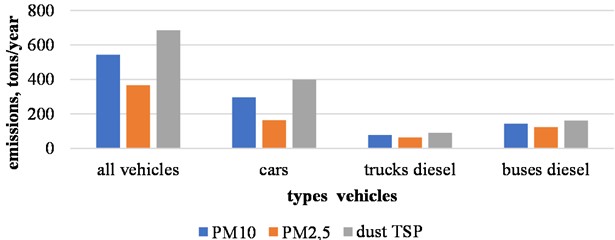
Emissions of PM10 (including PM2.5) from passenger cars amount to 296.7 tons per year (54.7 % of all PM emissions), from diesel trucks – 77.3 tons (14.3 %) and diesel buses – 143.1 tons (26.4 %). It should be noted that diesel buses have the highest specific emission of PM particles equal to 40.34 kg per car per year, whereas passenger cars – 0.57 kg and diesel trucks – 2.63 kg. The distribution of the solid particles’ emissions by types of motor vehicles is presented on Fig. 2.
Euro 2 eco-class diesel buses in Almaty emit PM10 particles, in average, 27.45 kg per year per bus, of which 15.68 kg per year – with exhaust gases from the engine. The Euro 5 eco-class diesel bus emits RM10 18,13 kg per year, with exhaust gases from the engine – 7.2 kg. The Euro eco-class diesel bus emits PM10 11.77 kg per year, with exhaust gases from the engine – 0.7 kg. The total emissions of PM10 particles from Euro 5 and Euro 6 eco-class diesel buses are 1.3 and 2.3 times less than the Euro 2 buses, respectively, and engine emissions are 2.2 and 22.4 times less. This also regards to emissions of PM2.5.
4. Conclusions
1) Despite the measures taken to reduce emissions of pollutants from road transport, from industrial enterprises and in the private sector, the levels of air pollution in Almaty remain increased today.
2) Solid particles PM10 in the amount of 543.2 tons per year, PM2.5 – 366.6 tons per year and total dust TSP – 685.0 tons per year are emitted into the atmospheric air of Almaty from motor transport. In total emissions, emissions of PM10 solid particles amount to 79.3 %, and PM2.5 – 53.0 %.
3) PM solid particles during the operation of cars in the city are emitted not only by the exhaust gases of the engines, but also due to tire abrasion, brake wear and wear of the road pavement.
4) PM10 bulk is emitted totally by the abrasion of tires, brakes and roads – 65.4 %, from the engine – 34.6 %. The main part of PM2.5 is emitted from the engine – 51.3 %, the rest – due to the abrasion of tires, brakes and the road – 48.7 %.
5) With an increase in the average speed of traffic in the city from 20 km/h to 40 km/h, emissions of PM solid particles and TSP dust from engines’ exhaust gases only decrease by 62.9 %. Emissions due to wear of tires, brakes and roads do not change.
6) The bulk of PM particles emitted by diesel buses and trucks occur due to the engines’ exhaust gases. Diesel buses have the highest emission of PM particulate matter equal to 40.34 kg per vehicle per year, whereas passenger cars – 0.57 kg and diesel trucks – 2.63 kg.
7) The total emissions of PM10 solid particles produced by Euro 5 and Euro 6 eco-class diesel buses are 1.3 and 2.3 times less than Euro 2 buses, respectively, and engine emissions are 2.2 and 22.4 times less. This also regards to emissions of PM2.5.
8) The following measures are recommended in order to reduce PM solid particles emitted by motor road transport:
– Replacement of diesel buses with electric buses and buses operated by compressed natural gas CNG.
– The use of diesel buses of ecological classes Euro 5 and Euro 6.
– Increase in the average speed of traffic in the city.
References
-
“Ambient (outdoor) air pollution,” https://www.who.int/ru/news-room/fact-sheets/detail/ambient- (accessed 2022).
-
W. Peng, H. Li, L. Peng, Y. Wang, and W. Wang, “Effects of particulate matter on hospital admissions for respiratory diseases: an ecological study based on 12.5 years of time series data in Shanghai,” Environmental Health, Vol. 21, No. 1, pp. 1–12, Jan. 2022, https://doi.org/10.1186/s12940-021-00828-6
-
J. Chen et al., “Long-term exposure to fine particle elemental components and natural and cause-specific mortality-a pooled analysis of eight European cohorts within the ELAPSE project,” Environmental Health Perspectives, Vol. 129, No. 4, p. 8368, Apr. 2021, https://doi.org/10.1289/ehp8368
-
W. Wu et al., “Association between ambient particulate matter exposure and semen quality in fertile men,” Environmental Health, Vol. 21, No. 1, pp. 1–12, Jan. 2022, https://doi.org/10.1186/s12940-022-00831-5
-
J. Shin, J. Oh, I.-S. Kang, E. Ha, and W.-B. Pyun, “Effect of short-term exposure to fine particulate matter and temperature on acute myocardial infarction in Korea,” International Journal of Environmental Research and Public Health, Vol. 18, No. 9, p. 4822, Apr. 2021, https://doi.org/10.3390/ijerph18094822
-
M. Leung et al., “Exposure to PM2.5 during pregnancy and fetal growth in eastern Massachusetts, USA,” Environmental Health Perspectives, Vol. 130, No. 1, p. 9824, Jan. 2022, https://doi.org/10.1289/ehp9824
-
M. E. Goodsite and O. Hertel, “Urban air quality: sources and concentrations,” Encyclopedia of Sustainability Science and Technology, pp. 11291–11311, Jan. 2012, https://doi.org/10.1007/978-1-4419-0851-3_321
-
P. Sicard, E. Agathokleous, S. C. Anenberg, A. de Marco, E. Paoletti, and V. Calatayud, “Trends in urban air pollution over the last two decades: A global perspective,” Science of The Total Environment, Vol. 858, p. 160064, Feb. 2023, https://doi.org/10.1016/j.scitotenv.2022.160064
-
“About Urban Air Toxics.” Hazardous Air Pollutants, EPA, https://www.epa.gov/haps/about-urban-air-toxics
-
W.-Y. Pan and H.-Y. Shen, “Correlation analysis between motor vehicle types and air pollution in Shijiazhuang City,” in IOP Conference Series: Earth and Environmental Science, Vol. 153, p. 062005, Jun. 2018, https://doi.org/10.1088/1755-1315/153/6/062005
-
B. Wang, Y. Li, Z. Tang, N. Cai, and H. Niu, “Effects of vehicle emissions on the PM2.5 dispersion and intake fraction in urban street canyons,” Journal of Cleaner Production, Vol. 324, p. 129212, Nov. 2021, https://doi.org/10.1016/j.jclepro.2021.129212
-
I. Kheirbek, J. Haney, S. Douglas, K. Ito, and T. Matte, “The contribution of motor vehicle emissions to ambient fine particulate matter public health impacts in New York City: a health burden assessment,” Environmental Health, Vol. 15, No. 1, pp. 1–14, Aug. 2016, https://doi.org/10.1186/s12940-016-0172-6
-
M. F. Andrade et al., “Vehicle emissions and PM2.5 mass concentrations in six Brazilian cities,” Air Quality, Atmosphere and Health, Vol. 5, No. 1, pp. 79–88, Nov. 2010, https://doi.org/10.1007/s11869-010-0104-5
-
“Transportation, Air Pollution and Climate Change.” Hazardous Air Pollutants, EPA, https://www.epa.gov/transportation-air-pollution-and-climate-change/smog-soot-and-other-air-pollution-transportation
-
S. M. Almeida et al., “Ambient particulate matter source apportionment using receptor modelling in European and Central Asia urban areas,” Environmental Pollution, Vol. 266, p. 115199, Nov. 2020, https://doi.org/10.1016/j.envpol.2020.115199
-
F. Amato et al., “Quantifying road dust resuspension in urban environment by multilinear engine: a comparison with PMF2,” Atmospheric Environment, Vol. 43, No. 17, pp. 2770–2780, Jun. 2009, https://doi.org/10.1016/j.atmosenv.2009.02.039
-
C. Correia et al., “Particle exposure and inhaled dose while commuting in Lisbon,” Environmental Pollution, Vol. 257, p. 113547, Feb. 2020, https://doi.org/10.1016/j.envpol.2019.113547
-
A. Kerimray, B. Kenessov, and F. Karaca, “Retracted article: trends and health impacts of major urban air pollutants in Kazakhstan,” Journal of the Air and Waste Management Association, Vol. 69, No. 11, pp. 1331–1347, Nov. 2019, https://doi.org/10.1080/10962247.2019.1668873
-
A. Kerimray et al., “Assessing air quality changes in large cities during COVID-19 lockdowns: The impacts of traffic-free urban conditions in Almaty, Kazakhstan,” Science of The Total Environment, Vol. 730, p. 139179, Aug. 2020, https://doi.org/10.1016/j.scitotenv.2020.139179
-
Y. A. Jailaubekov, G. D. Berkinbaev, N. A. Yakovleva, and V. S. Kosach, “Monitoring of air pollutant emissions from motor vehicles in Almaty city,” International Review of Mechanical Engineering (IREME), Vol. 15, No. 6, p. 301, Jun. 2021, https://doi.org/10.15866/ireme.v15i6.21121
-
R. Mukhtarov et al., “An episode-based assessment for the adverse effects of air mass trajectories on PM2.5 levels in Astana and Almaty, Kazakhstan,” Urban Climate, Vol. 49, p. 101541, May 2023, https://doi.org/10.1016/j.uclim.2023.101541
-
“A computer program for calculating emissions generated by road transport COPERT 5.”. https://copert.emisia.com
-
Y. A. Jailaubekov, “Calculation and analysis of emissions of harmful pollutants by motor vehicles into the atmospheric air in the Republic of Kazakhstan,” (in Russian), KazATC, Almaty, 2010.
About this article

The authors have not disclosed any funding.
The datasets generated during and/or analyzed during the current study are available from the corresponding author on reasonable request.
The authors declare that they have no conflict of interest.
