Abstract
In order to fully extract the fault characteristics of different cavitation fault states of centrifugal pumps, reduce the influence of hyperparameter settings on the identification and classification results of machine learning algorithms, this paper designs a network model based on the rime optimization algorithm (RIME) to improve the stacked denoising autoencoder (SDAE) network, which is named as RIME-SDAE. First of all, Singular Value Decomposition (SVD) is used to denoise the , and signals of the triaxial vibration sensor, and time-domain, frequency-domain and time-frequency features are extracted to construct a signal feature set. Secondly, the three-dimensional feature indicators are analyzed and selected to be merged into the input dataset, and SDAE is trained with the RIME is used to determine the model parameters of SDAE synchronously. The feasibility of the proposed method is verified by the signals collected in the actual test, and the test results show that the accuracy on the test set reaches more than 98 %.
Highlights
- Analysis of centrifugal pump cavitation characteristic curve, to find the difference between different cavitation state of the head drop point.
- Extract the vibration signal multi-domain characteristic indexes to find the indexes that can reflect the change of the cavitation state of the centrifugal pump.
- Optimization of SDAE hyperparameters using the RIME algorithm improves the correct rate of centrifugal pump cavitation state identification.
1. Introduction
Centrifugal pumps, as a kind of rotating machinery with strong versatility, are widely used in various fields because of their advantages of simple structure, low cost and stable performance [1-2]. Cavitation as one of the common failures of centrifugal pumps, cavitation phenomenon produces air bubbles will lead to the centrifugal pump head, operating efficiency and other performance parameters are reduced [3-4]. Because the vibration signal detection is non-invasive, it is of great significance to analyze the vibration signal of centrifugal pump cavitation [5], extract the characteristics of the vibration signal and carry out fault diagnosis.
Qing Biao [6] numerically simulated the cavitation inception point of centrifugal pump, and then collected noise signals experimentally and extracted the signal characteristics of centrifugal pump cavitation inception by empirical mode decomposition algorithm. Cao Yuliang [7] collected vibration signals of four kinds of cavitation states under three working conditions of centrifugal pump, and trained the constructed deep learning network by using improved frequency doubling and time-frequency characteristic matrix. The comparison proves that the deep learning network is more effective than BP neural network for cavitation fault detection. However, the network model parameters rely on manual calibration, which is subjective, inefficient and unreliable.
In order to solve the above problems, this paper extracts and screens the multi-domain features of triaxial vibration acceleration signals, combines the good learning ability of SDAE optimized by RIME for high-dimensional and nonlinear samples, and avoids the blindness and human factors in parameter selection, and puts forward a centrifugal pump cavitation fault diagnosis method based on the rime optimization algorithm to improve the stacked denoising autoencoder (SDAE) network, and finally verifies its effectiveness and reliability through experiments.
2. Data preparation
2.1. Data collection
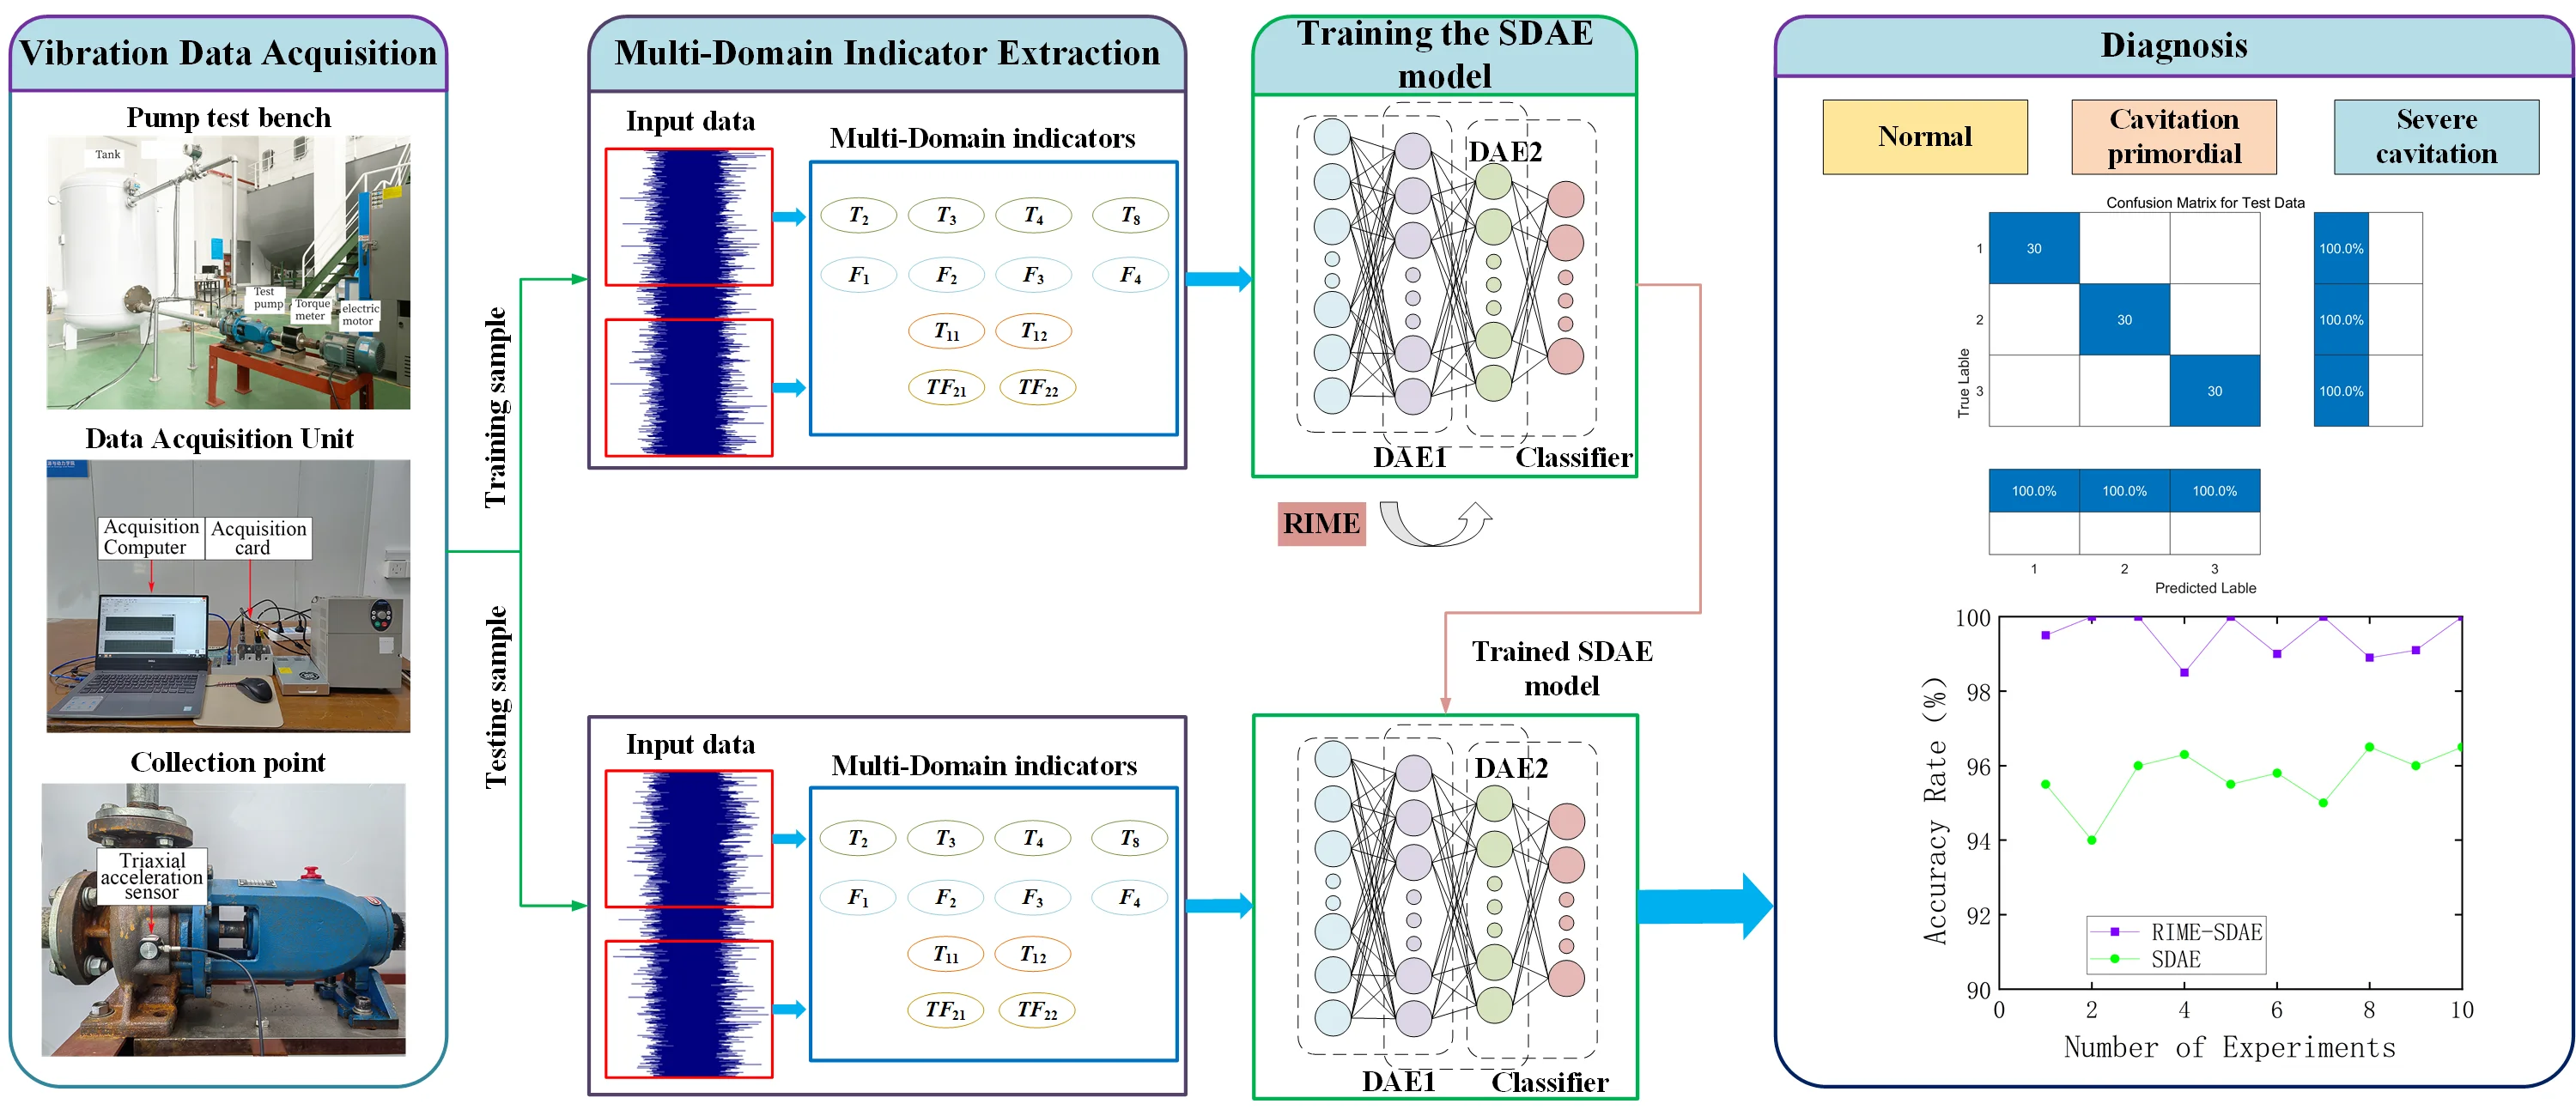
According to the requirements of the standard “GB3216-2016 rotary power pump hydraulic performance acceptance test”, the test bench is built and IS-65-50-160 single-stage centrifugal pump is selected for the test. Some of the design parameters of the pump include: rated flow rate of 50m3/h, rotational speed of 2930 r/min, design head 38m, and the number of vanes 6. Other equipment on the test stand includes electric motors, torque meters, and data acquisition equipment. The schematic diagram of the test system loop is shown in Fig. 1, and the data acquisition equipment is shown in Fig. 2.
Fig. 1Test system loop
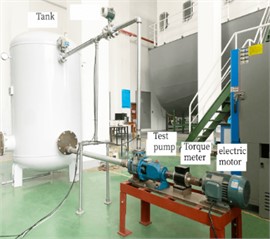
Fig. 2Data acquisition equipment
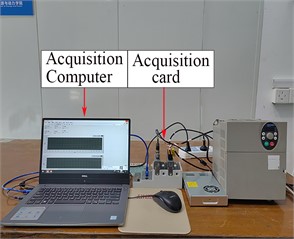
After the test pump is started and operated normally, the tank is evacuated and cavitated by gradually reducing the pump inlet pressure. Record the relationship between the effective cavitation margin (NPSHa) and the head drop during the pumping process, and collect the vibration signals from the measurement points of the pump body when the centrifugal pump operates under different NPSHa. The position of the vibration sensor and the cavitation characteristic curve of the centrifugal pump are shown in Fig. 3 and Fig. 4.
Fig. 3Position of the vibration sensor
Fig. 4Cavitation characteristic curve of pump
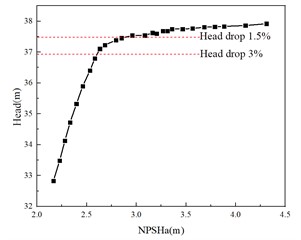
As shown in Fig. 4, with the decrease of NPSHa, the pump head firstly decreases slowly, and after an inflection point, the head decreases sharply, which can be regarded as the cavitation incipient point, corresponding to a 1.5 % decrease in head [8]. At the same time, the engineering generally will be declined by 3 % of the point of head as the point of cavitation occurs. Therefore, the collection of head down 0 %, 1.5 % and 3 % of the point of the vibration signal, used to represent the centrifugal pump is not cavitation, cavitation incipient and severe cavitation state.
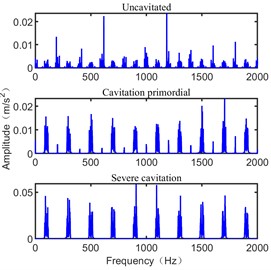
Taking the vibration signal in the Z-direction of the sensor as an example, some of its time-domain and frequency-domain plots under different cavitation states are shown in Figs. 5 and 6.
Fig. 5Time domain graph
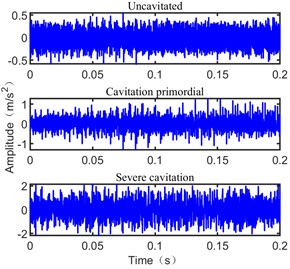
Fig. 6Frequency domain graph
2.2. Construction of feature vectors
In order to reveal the fault information contained in vibration signals more accurately and comprehensively, multiple data indicators should be extracted from the multi-domain perspective to represent the fault information [9]. It is worth mentioning that energy value and sample entropy are the characteristics of the first eight IMF components obtained by Ensemble Empirical Mode Decomposition, which represent the energy distribution and time complexity of IMF components. Let the signal be , 1,2, …, is the number of data points of the signal. Table 1 lists 14 commonly used signaling indicators. As shown in Table 1.
Table 1Data indicators
Parameter | Expression | Parameter | Expression |
Mean value | Root mean square value | ||
Square root amplitude | Absolute value average | ||
Skewness | Kurtosis | ||
Variance | Peak value | ||
Mean frequency | Frequency standard deviation | ||
Frequency center | Root mean square frequency | ||
Energy value | Sample entropy |
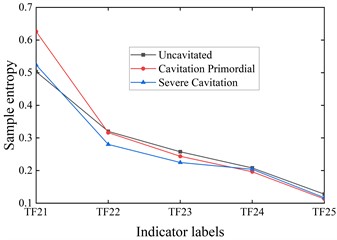
Table 1 shows the commonly used signal characteristic indicators, but not all of these signal indicators are related to the centrifugal pump cavitation fault, in order to eliminate redundant indicators, analyze the changes of each indicator in different cavitation states, and find out the indicators that best reflect the changes in the cavitation state of the centrifugal pump for subsequent machine learning identification and classification. Taking the sensor -direction vibration signal as an example, the changes of its time domain, frequency domain and time frequency indicators with the development of cavitation are shown in Fig. 7, Fig. 8, Fig. 8 and Fig. 10.
Combined with Figs. 5-10, it can be seen that the centrifugal pump cavitation development process, the time domain and frequency domain signal amplitude are increasing, in which the frequency of the frequency domain signal is mainly distributed in the shaft frequency and lobe frequency, with the deepening of the degree of cavitation, the frequency distribution is becoming more and more centralized and more amplitude increase at high frequency, showing the increase in vibration energy. Therefore, the time-domain indicators T2, T3, T4 and T8 reflecting the change of vibration amplitude gradually increase with the development of cavitation, while the time-domain indicators T1, T5, T6 and T7 reflecting the shape of the signal have no significant change; the frequency-domain features F1, F2, F3 and F4 reflecting the spectral distribution gradually increase with the development of cavitation, reflecting the high-frequency component brought by cavitation; the energy value of the IMF component reflecting the vibration energy and complexity is similar to that of the sample entropy feature in the first 2 years. Sample entropy features gradually increase with cavitation development in the first 2-order components, but the difference is not significant in the last 3-order components, indicating that the higher-order components after EEMD decomposition can no longer reflect the characteristics of the original signal. Therefore, the time-domain indicators T2, T3, T4, T8, the frequency-domain indicators F1, F2, F3, F4, and the time-frequency indicators TF11, TF12, TF21, TF22 are selected for the subsequent identification of the cavitation state.
Fig. 7Time domain index
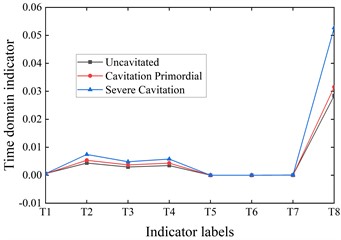
Fig. 8Frequency domain index
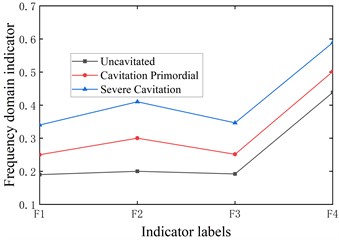
Fig. 9Energy value
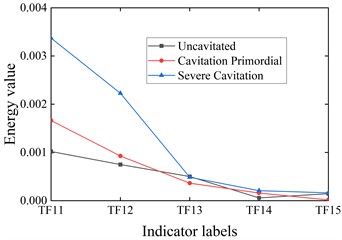
Fig. 10Sample entropy
3. The basic model
3.1. Stacked denoising autoencoder
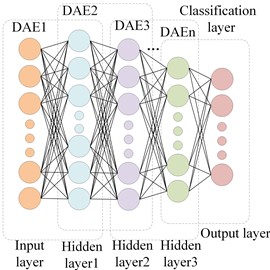
Self-encoder (AE) is a typical deep learning network including input layer (), hidden layer () and output layer (), which realizes the reconstruction of the input signal by encoding and decoding, and realizes the feature extraction of the signal by minimizing the reconstruction error, and its structure is shown in Fig. 11. Noise-reducing auto-encoder (DAE) is an improved form of AE, which randomly sets the input layer to zero according to a certain ratio p through a certain random distribution to obtain a noise-containing data, and then reconstructs the noise-containing data and adjusts the model parameters through AE. By stacking several DAEs, the SDAE can be obtained, and its structure is shown in Fig. 12.
Fig. 11Auto-Encoder network structure
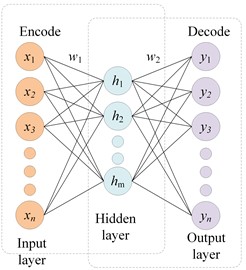
Fig. 12Training of SDAE
3.2. Rime optimization algorithm
The rime optimization algorithm is the latest meta-heuristic algorithm based on natural phenomena, inspired by the growth behavior of rime in nature [10]. The process of RIME is as follows:
1. Soft-rime search strategy, which simulates the movement of soft-rime particles in gray ice and puts forward a soft-rime search strategy.
2. Hard-rime puncture mechanism, which is inspired by the piercing phenomenon during the growth of rime strong wind.
3. Positive greedy selection mechanism, this way of working can effectively filter out the bad solutions in the population, while introducing suboptimal solutions by changing the choice of optimal solutions.
4. Result analysis
This paper proposes a new method named RIME-SDAE algorithm. The realization steps of the centrifugal pump cavitation fault diagnosis algorithm proposed in this paper are shown in Fig. 13.
Fig. 13Diagnostic process of cavitation fault of centrifugal pump
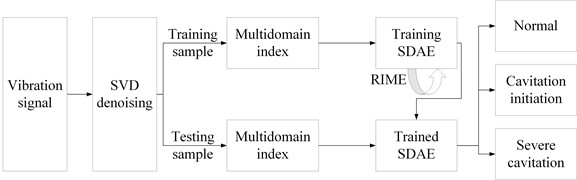
After signal denoising of the original vibration signals of the three cavitation states, the vibration signals of any one direction are selected for the division of data samples, and the length of each sample is positioned at 1000, which goes to a total of 100 samples. The vibration signals in other directions are also sampled in the same way, and a total of 300 samples can be obtained. The feature set is obtained by extracting multi-domain indicators of data. Where is a 4-dimensional time domain vector, is a 4-dimensional frequency domain vector, and are 4-dimensional time-frequency vectors. Similarly, the characteristics of vibration signals in and directions are extracted to get and . The three centrifugal pump cavitation state feature matrices in three directions are combined and reconstructed into a feature dataset of dimension 300×36. Then, the dataset matrix of size 300×36 is obtained after feature extraction, and the training dataset is divided into training dataset and testing dataset in the ratio of 7:3. Then, Next, the number of hidden layers of SDAE is set to 3 and training is started, during which RIME is used to find the optimal model parameters for SDAE. Involving the counts of points in two hidden layers (, , ), participation rate and iterations . The optimal parameters for SDAE can be found in Table 2.
Table 2Optimized SDAE model parameters
Parameter | Symbol | Value |
Counts of neurons in the input layer | – | 79 |
Counts of neurons in the first hidden layer | 53 | |
Counts of neurons in the second hidden layer | 50 | |
Counts of neurons in the third hidden layer | 84 | |
Counts of neurons in output layer | – | 3 |
Counts of DAE | – | 3 |
Participation rate | 0.8 | |
Iterations | 0.6 |
The identification accuracy of centrifugal pump cavitation faults can be obtained by using the test samples as inputs to the trained RIME-SDAE model. and the classification accuracy of test samples is shown in Fig. 14. To show the importance of parameter optimization, the classification performance of SDAE with and without parameter optimization is compared. Fig. 15 demonstrates the average classification accuracy of RIME-SDAE versus standard SDAE over 10 experiments.
Fig. 14Correct classification rate of testing set
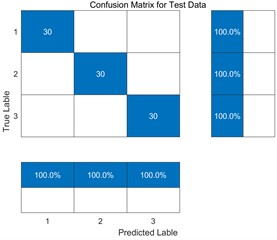
Fig. 15Comparison of classification accuracy
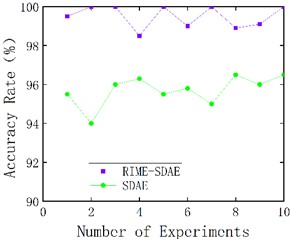
As shown in the Fig. 14, the SDAE optimized by RIME parameters performs well in the test set, and the diagnostic accuracy rate reaches 100 %, which verifies the feasibility of this method for cavitation fault diagnosis of centrifugal pumps. As can be seen from Fig. 15, RIME-SDAE performs better than the parameter-free optimized SDAE in centrifugal pump cavitation fault identification. Among them, the average correct rate of ten experiments of RIME-SDAE reaches more than 98, which is significantly higher than that of SDAE without parameter optimization, indicating that the method proposed in this paper can significantly improve the correct rate of centrifugal pump cavitation fault identification.
5. Conclusions
In this paper, a cavitation fault diagnosis method based on RIME-SDAE is proposed. By comparing the experimental results, it is known that:
1) Calculating the multi-domain indexes of the , and vibration signals of a single triaxial acceleration sensor and constructing a feature data set can not only reduce the complexity of experiment and signal analysis, but also more comprehensively characterize the inherent characteristics submerged by noise.
2) Through the fault mechanism analysis to filter out the features that better characterize the fault information, reduce the impact of redundant features on the subsequent calculations, and improve the computation efficiency.
3) After optimizing the parameters of SDAE model with RIME algorithm, the accuracy of fault classification is improved, and the randomness and arbitrariness of parameter selection of traditional deep learning model are avoided.
References
-
T. Tavari, M. Nazari, S. Meamardoost, A. Tamayol, and M. Samandari, “A systematic overview of electrode configuration in electric‐driven micropumps,” Electrophoresis, Vol. 43, No. 13-14, pp. 1476–1520, May 2022, https://doi.org/10.1002/elps.202100317
-
M. Stan, I. Pana, M. Minescu, A. Ichim, and C. Teodoriu, “Centrifugal pump monitoring and determination of pump characteristic curves using experimental and analytical solutions,” Processes, Vol. 6, No. 2, p. 18, Feb. 2018, https://doi.org/10.3390/pr6020018
-
C. Dai, S. Hu, Y. Zhang, Z. Chen, and L. Dong, “Cavitation state identification of centrifugal pump based on CEEMD-DRSN,” Nuclear Engineering and Technology, Vol. 55, No. 4, pp. 1507–1517, Apr. 2023, https://doi.org/10.1016/j.net.2023.01.009
-
P. C. Pennings, J. Westerweel, and T. J. C. van Terwisga, “Flow field measurement around vortex cavitation,” Experiments in Fluids, Vol. 56, No. 11, pp. 1–13, Nov. 2015, https://doi.org/10.1007/s00348-015-2073-9
-
U. Dorji and R. Ghomashchi, “Hydro turbine failure mechanisms: An overview,” Engineering Failure Analysis, Vol. 44, pp. 136–147, Sep. 2014, https://doi.org/10.1016/j.engfailanal.2014.04.013
-
Qing Biao, Ren Jianjun, and Song Xiaofei, “Study on cavitation inception of centrifugal pump based on EMD,” Journal of Hydroelectric Power, Vol. 35, No. 5, pp. 102–109, 2016.
-
Cao Yuliang, Ming Tingfeng, He Guo, and Su Yongsheng, “Cavitation state identification of centrifugal pump based on deep learning,” Journal of Xi ’an Jiaotong University, Vol. 51, No. 11, pp. 165–172, 2017.
-
G. R. S. Assi, J. R. Meneghini, J. A. P. Aranha, P. W. Bearman, and E. Casaprima, “Experimental investigation of flow-induced vibration interference between two circular cylinders,” Journal of Fluids and Structures, Vol. 22, No. 6-7, pp. 819–827, Aug. 2006, https://doi.org/10.1016/j.jfluidstructs.2006.04.013
-
Song, Honghui, and Chen Ning, “Cavitation fault diagnosis of centrifugal pump based on WOA-SDAE”.
-
H. Su et al., “RIME: A physics-based optimization,” Neurocomputing, Vol. 532, pp. 183–214, May 2023, https://doi.org/10.1016/j.neucom.2023.02.010
Cited by
About this article

The authors have not disclosed any funding.
The datasets generated during and/or analyzed during the current study are available from the corresponding author on reasonable request.
The authors declare that they have no conflict of interest.
