Abstract
The scientific article presents a methodology for assessing the level of development and efficiency of traffic management systems, taking into account environmental factors. The order and algorithms for all calculations to assess the level of effectiveness for road traffic management systems of motor transport, while taking into account the impact of environmental factors, are provided. The methodology for assessing the current state of the traffic management system relies on the degree of deviation of each individual indicator from its target value. The resulting value of the composite indicator for the system’s condition is then compared to its standard value, and an estimated overall state for the system is determined. According to some indicators, there has been an increase in emissions of toxic substances in the city's streets and roads, which are assessed as “poor”. To improve the state of the environment, an immediate set of organizational and technical measures has been proposed for the rational development of the traffic management system.
Highlights
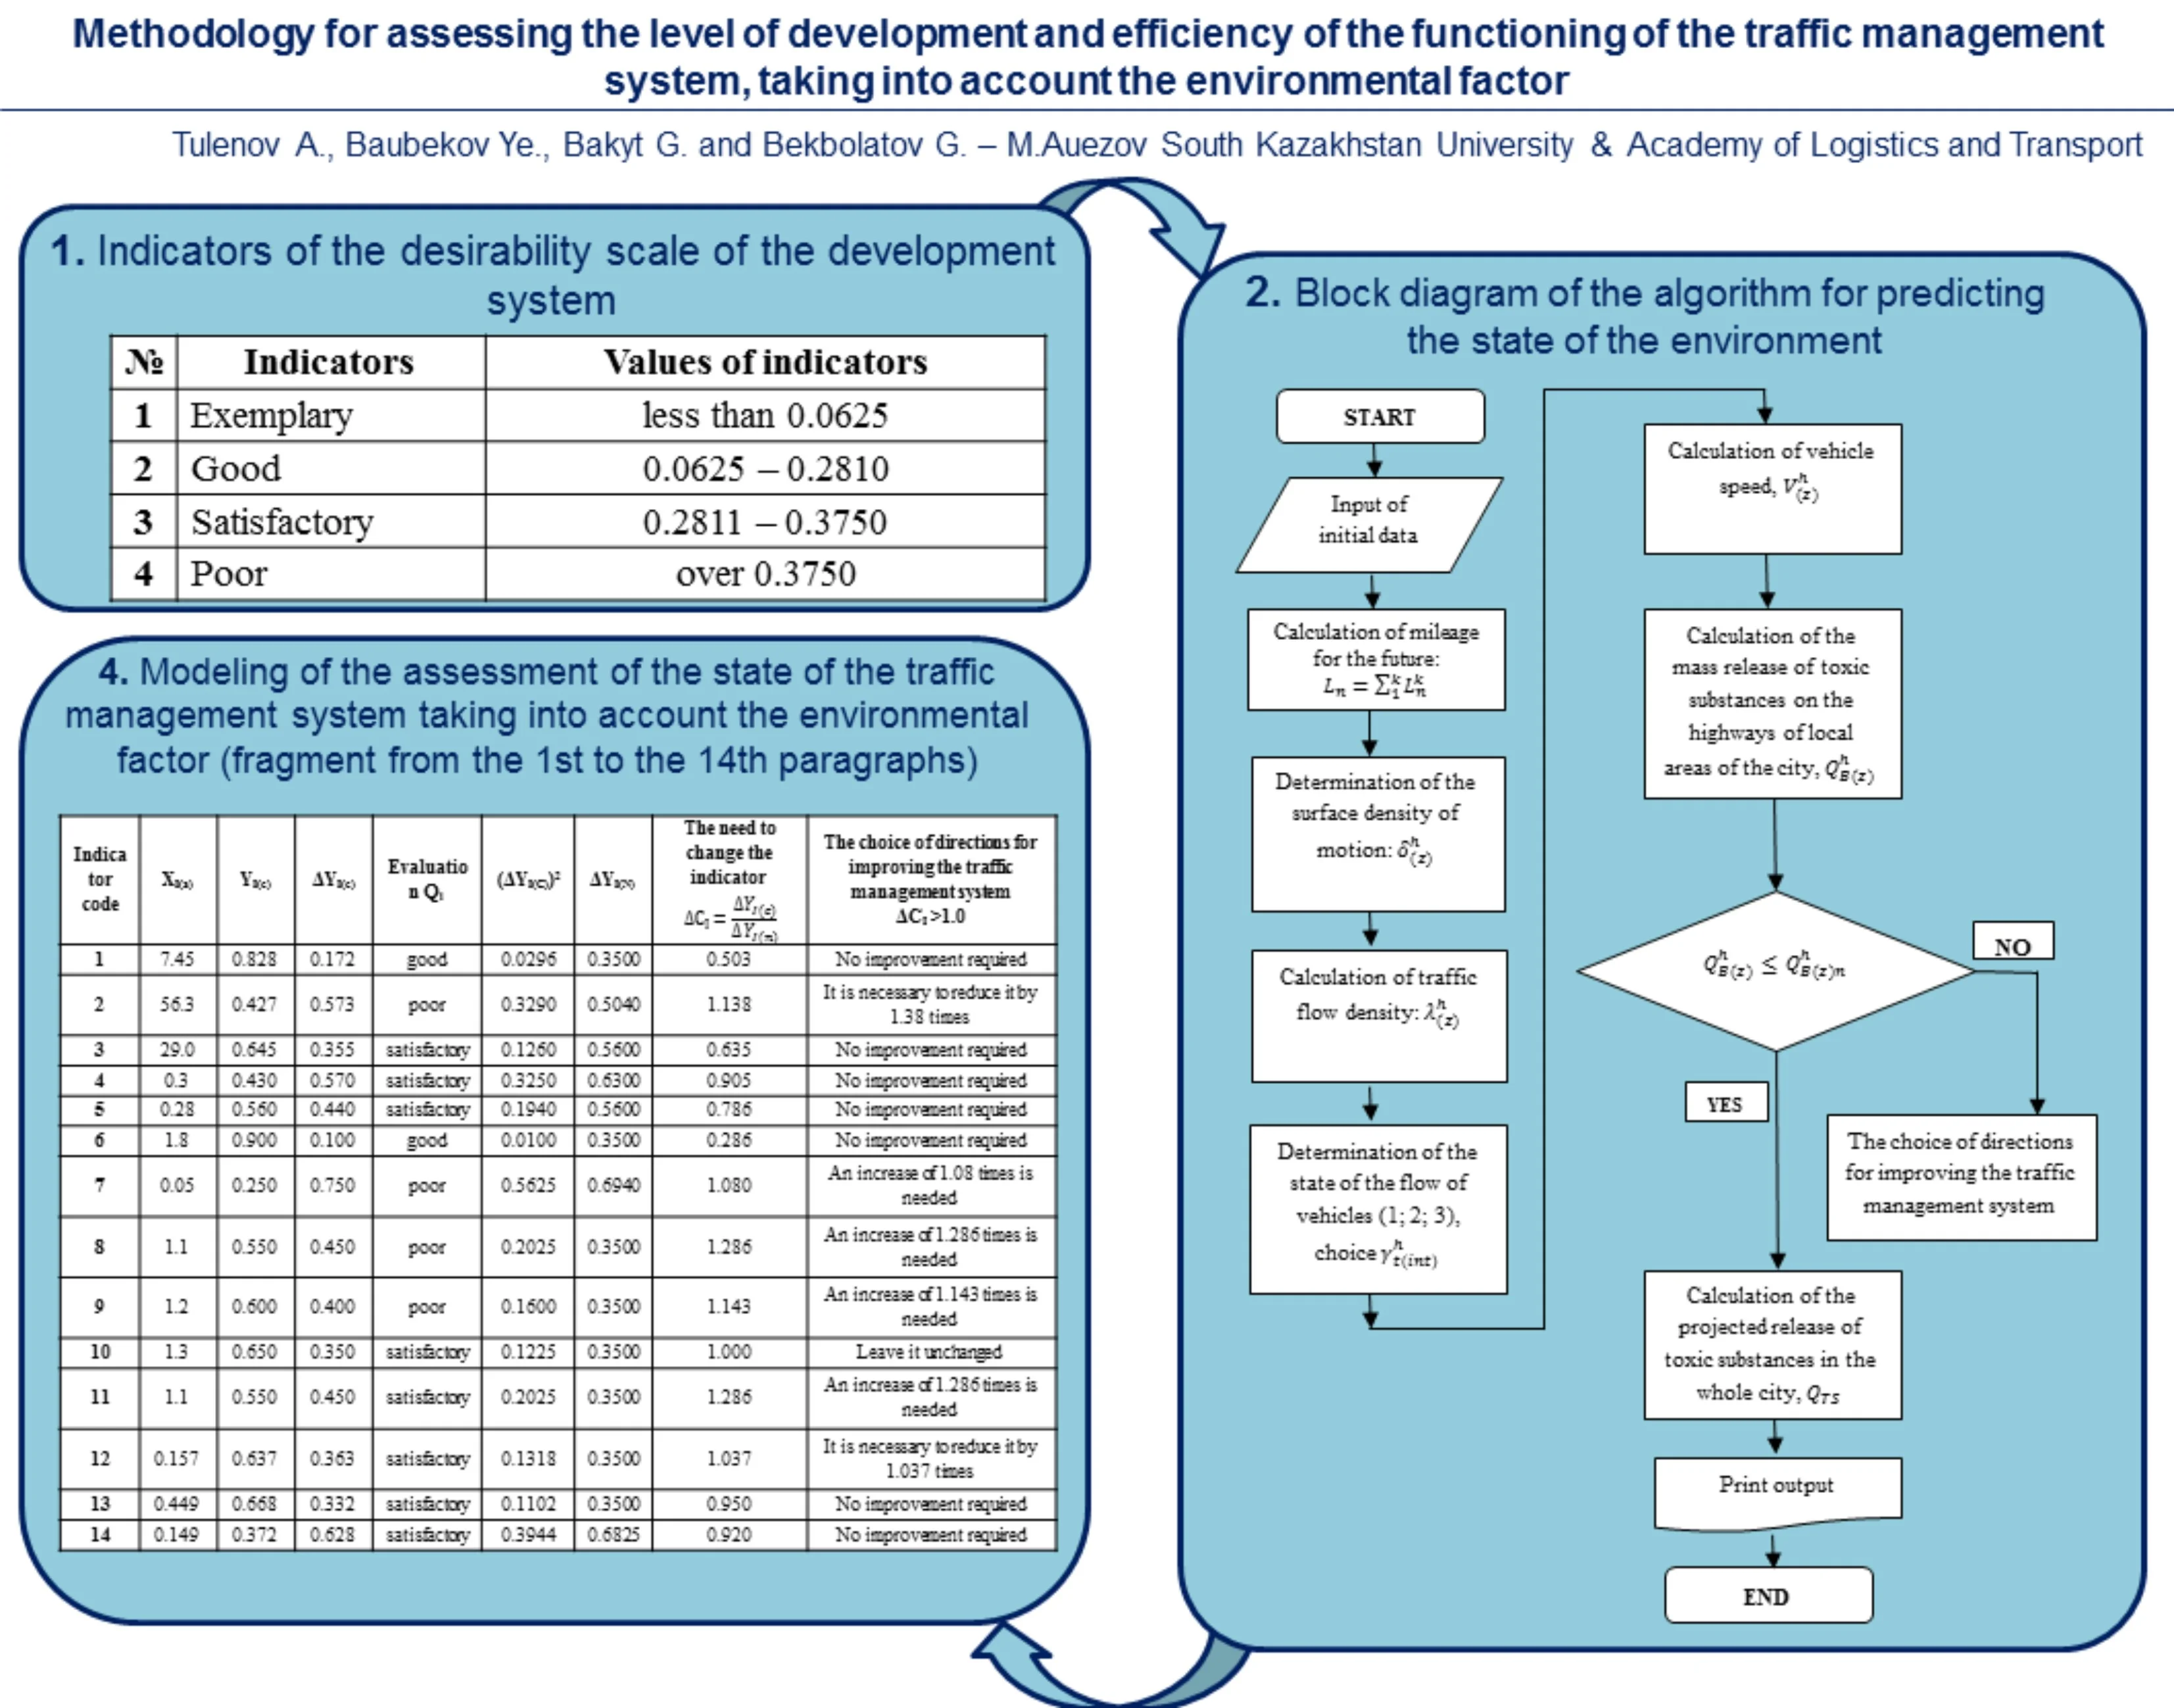
- As a result of the analysis, the main indicators of the desirability scale of the developed system are determined and established.
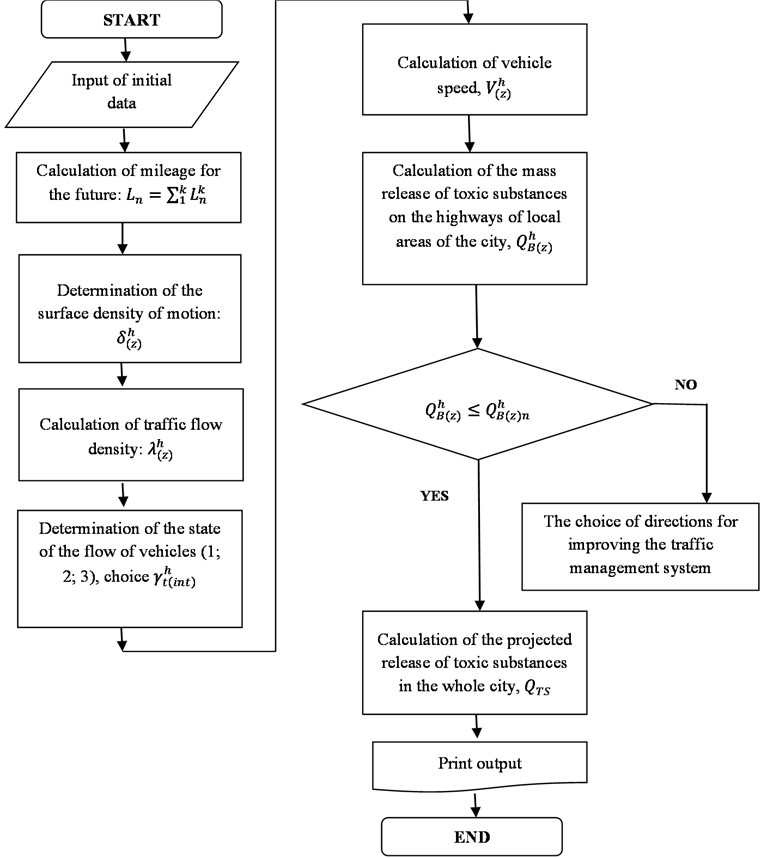
- An adapted flowchart of an algorithm for predicting the state of the environment has been developed.
- The results of the assessment of the state of the traffic management system, taking into account the environmental factor, are modeled.
- As a result of the study, it was found that the level of development and efficiency of the functioning of the traffic management system, taking into account the state of the environment, has a "satisfactory" evaluation solution.
1. Introduction
It is possible to improve the effectiveness of environmental protection against the harmful effects of road transport by implementing technical measures to enhance the transport system, as well as a range of urban planning measures and improvements to the means and methods of traffic management. In particular, in the context of increasing motorization and intensive growth of traffic in cities, as well as a significant lag in implementing measures to improve transportation systems, it is essential to conduct a comprehensive study on optimizing methods and means for organizing road transportation, taking into consideration its impact on the environment. Therefore, the problem of optimizing the system for organizing the movement of motor vehicles in cities, taking into account environmental factors, is urgent and its timely resolution is important [1].
2. Materials and methods
The initial data for analyzing the effectiveness and reliability of the functioning of the traffic management system are indicators of its development and compliance of this development with environmental protection requirements.
The complexity of assessing the level of development of the traffic management system lies in creating a generalized (single) feature that quantifies the functioning of a system with many output values, with which, as with a standard, each particular and complex parameter of it could be compared. At the same time, each resulting parameter has its own physical meaning and dimension, and therefore, for a generalized feature, it is necessary to introduce an artificial metric that is uniform for all parameters. As such a metric, we can recommend the construction of the Harrington “desirability” function [1, 2]. One of the most convenient methods for assessing the state of the system according to a generalized criterion is proposed in [1, 3]. Thus, the scientific novelty of this study can be considered the construction of the desirability function as the most optimal method for assessing the state of any system according to a generalized criterion for an th number of parameters having different physical meaning and dimension.
To assess the level of development of the road traffic management system, taking into account the environmental factor, the following indicators are calculated:
a) the coefficient of differentiation of the road network [4]:
where – the indicator of differentiation of the structure of the road network, the proportion of units; – the indicator of the sufficiency of the development of the road network by zones, the proportion of units; – the indicator of the development of highways of various types, the proportion of units; , , , , – the actual density of the network, respectively, of expressways, highways of citywide significance, highways of regional significance, local streets, special roads, km/km2; , , , , – normative values of network density, respectively, of expressways, highways of citywide significance, highways of district significance, local streets, special roads, km/km2; , , , – the density of the road network, respectively, the actual and normative values in the central, middle and peripheral zones, km/km2.
b) an indicator of the presence of bypasses of the city and its central part [4]:
where – the indicator of the presence of bypasses of the city and its central part, units; , – the actual number of highways for transit traffic to bypass, respectively, the city as a whole and its central district, units; , – the maximum number of highways to allow transit traffic to bypass the city and the center, respectively (for a closed loop 4), units.
c) an indicator of the linear density of intersections at different levels [4]:
where – linear density of intersections at different levels, units/km; – the number of intersections at different levels on highways of citywide significance, units; – the length of the network of highways of citywide importance.
The methodology for assessing the state of development of the traffic management system is based on the value of the relative deviation of each particular feature (indicator) from its nominal value. Due to the fact that the value of the relative deviation of any th indicator in ideal conditions is 0, then the assessment of the state of each th indicator in the th time period will be the higher, the smaller the value of the relative deviation.
It should be noted that based on the normative estimated values of relative deviations of indicators characterizing the level of development of the traffic management system, taking into account the environmental factor, it is possible to calculate the absolute values of the estimated standards using the following dependencies [4]:
where – the absolute normative estimated values of the th indicators, respectively, when and ; – normative estimated values of the th relative indicators; – normative estimated values of th relative deviations.
The target formulation of the mathematical model for assessing the state of the system is the following conditions [4]:
3. Results and discussion
It is known that each particular indicator of the considered development system has its own physical indicator and its own dimension. To combine the above indicators, the following indicators are introduced as “exemplary”, “good”, “satisfactory”, “poor” condition. The desirability scale shown in Table 1 is used to represent the result obtained. For example, if we consider the following indicators, such as: the density of the highway network, the indicator of the availability of bypasses of the city and the center for transit traffic, the indicator of the presence of one-way streets, the indicator of restriction or prohibition of entry into zones, the indicator of the use of adaptive local traffic management systems, the indicator of the use of adaptive coordinated traffic management systems, the proportion of car operating time in idle mode, the specific weight of the operating time of cars in acceleration mode corresponds to the values [5]. The indicators listed in Table 1 are set that meet the criteria of “good”, “satisfactory” or “poor” condition of the system.
Table 1Indicators of the desirability scale of the development system
No. | Indicators | Values of indicators |
1 | Exemplary | Less than 0.0625 |
2 | Good | 0.0625-0.2810 |
3 | Satisfactory | 0.2811-0.3750 |
4 | Poor | over 0.3750 |
To obtain full-scale results of the assessment of the state of the traffic management system, taking into account the environmental factor, the following parameters (Table 2) are considered (indicator codes): 1 – density of the highway network; 2 – density of traffic flows; 3 – average speed of cars; 4 – reserves of highway capacity; 5 – coefficient of differentiation of the street and road network; 6 – indicator of the availability of bypasses of the city and the center for transit traffic; 7 – linear density of intersections at different levels; 8 – indicator the presence of one-way streets; 9 – an indicator of restriction or prohibition of entry into zones; 10 – an indicator of the use of adaptive local traffic management systems; 11 – indicator of the use of adaptive coordinated traffic control systems; 12 – specific gravity of the time of operation of cars in idle mode; 13 – specific gravity of the time of operation of cars in acceleration mode; 14 – specific gravity of the time of operation of cars in steady motion mode; 15 – specific gravity of the time of operation of cars in braking mode; 16 – indicator fuel consumption; 17 – indicator of the emission of toxic substances from vehicles; 18 – indicator of the level of road accidents; 19 – indicator of the noise level.
The order and sequence of all calculations for assessing the level of development to the effectiveness of the functioning of the road traffic management system in road transport, taking into account the environmental factor, are shown in the flowchart in Fig. 1 [4, 6].
The initial data are the actual and calculated values of all th indicators and a matrix of normative estimated values of relative deviations of these indicators.
The procedure for assessing the state of the traffic management system using the example of the Shymkent transport system (modeling process) is shown in Table 2.
The algorithm of the decision on the assessment of the effectiveness of the functioning of the traffic management system [6]:
– according to the actual and calculated values of the th indicators, their relative values and relative deviations are determined, while it is necessary to take into account whether the indicator is minimized or maximized in the limit ( or );
– the state of the system is assessed for each th particular feature by comparing the values of calculated relative deviations () with their normative values () calculated in Table 2.
– an estimated solution of the state of the system is determined for each particular feature of “exemplary”, “good”, “satisfactory”, “bad” condition;
– the value of the complex indicator of the level of development of the system as a whole is calculated () ;
– the assessment of the level of development of the system as a whole is carried out by comparing the calculated value of the complex indicator of the state of the system with its normative value (Table 2), and the evaluation solution is determined: “exemplary”, “good”, “satisfactory”, “poor” state of the system as a whole;
– to select the directions for improving the functioning of the traffic management system, taking into account the environmental factor, the ratio is calculated , and the analysis is performed ; if , then, for the th indicator, measures to improve it are determined; if , then there is no need to improve the th indicator;
– based on evaluation decisions and indicators the system status is being analyzed.
For example, we consider the calculations of several of the following parameters. Calculation of the coefficient of differentiation of the road network: 2.1 + 1.8 = 3.9, where: 2.1 fractions of units the highest indicator of the sufficiency of the development of the street and road network by zones for large cities is accepted; 1.8 fractions of units the indicator of the development of highways of various types for large cities is of the greatest importance.
Calculation of the linear density index for the placement of intersections at different levels: units/km, where: for large cities like Shymkent and Almaty, the number of intersections is accepted 14 units.
The length of the network of highways of citywide importance for the cities of Shymkent and Almaty is accepted 25 km.
Thus, the remaining parameters are calculated using the values obtained as a result of field experiments. The remaining values obtained by calculations and experiments are shown in Table 2.
Fig. 1Block diagram of the algorithm for predicting the state of the environment
The sufficiency of the development of the road network, the effectiveness of means and methods of organizing road traffic and characteristics of the quality of the environment are analyzed. Based on the standards of relative deviations of indicators, it is possible to assess the effectiveness of the functioning of the road traffic management system of motor transport, taking into account compliance with environmental protection requirements. We will assess the state of the traffic management system depending on the development of the transport system for 2023 for the conditions of Shymkent (Table 2) [7]. The current state of the traffic management system, taking into account the environmental factor, is characterized by the actual values of the indicators (). A fairly high density of the development of the road network (7.45km/km2, Table 2) allows you to evaluate the state of the system according to this indicator as “good” (Table 1).
Table 2Modeling of the assessment of the state of the traffic management system taking into account the environmental factor
Indicator code | Evaluation | The need to change the indicator | The choice of directions for improving the traffic management system 1.0 | |||||
1 | 7.45 | 0.828 | 0.172 | Good | 0.0296 | 0.3500 | 0.503 | No improvement required |
2 | 56.3 | 0.427 | 0.573 | Bad | 0.3290 | 0.5040 | 1.138 | It is necessary to reduce it by 1.38 times |
3 | 29.0 | 0.645 | 0.355 | Satisfactory | 0.1260 | 0.5600 | 0.635 | No improvement required |
4 | 0.3 | 0.430 | 0.570 | Satisfactory | 0.3250 | 0.6300 | 0.905 | No improvement required |
5 | 0.28 | 0.560 | 0.440 | Satisfactory | 0.1940 | 0.5600 | 0.786 | No improvement required |
6 | 1.8 | 0.900 | 0.100 | Good | 0.0100 | 0.3500 | 0.286 | No improvement required |
7 | 0.05 | 0.250 | 0.750 | Bad | 0.5625 | 0.6940 | 1.080 | An increase of 1.08 times is needed |
8 | 1.1 | 0.550 | 0.450 | Bad | 0.2025 | 0.3500 | 1.286 | An increase of 1.286 times is needed |
9 | 1.2 | 0.600 | 0.400 | Bad | 0.1600 | 0.3500 | 1.143 | An increase of 1.143 times is needed |
10 | 1.3 | 0.650 | 0.350 | Satisfactory | 0.1225 | 0.3500 | 1.000 | Leave it unchanged |
11 | 1.1 | 0.550 | 0.450 | Satisfactory | 0.2025 | 0.3500 | 1.286 | An increase of 1.286 times is needed |
12 | 0.157 | 0.637 | 0.363 | Satisfactory | 0.1318 | 0.3500 | 1.037 | It is necessary to reduce it by 1.037 times |
13 | 0.449 | 0.668 | 0.332 | Satisfactory | 0.1102 | 0.3500 | 0.950 | No improvement required |
14 | 0.149 | 0.372 | 0.628 | Satisfactory | 0.3944 | 0.6825 | 0.920 | No improvement required |
15 | 0.245 | 0.571 | 0.429 | Satisfactory | 0.1840 | 0.4200 | 1.021 | It is necessary to reduce it by 1.021 times |
16 | 9.3 | 0.296 | 0.731 | Bad | 0.5344 | 0.5950 | 1.228 | It is necessary to reduce it by 1.228 times |
17 | 7.4 | 0.257 | 0.743 | Bad | 0.5520 | 0.6055 | 1.227 | It is necessary to reduce it by 1.227 times |
18 | 10.0 | 0.300 | 0.700 | Bad | 0.4900 | 0.6300 | 1.111 | It is necessary to reduce it by 1.111 times |
19 | 4.0 | 0.250 | 0.750 | Bad | 0.5625 | 0.6650 | 1.128 | It is necessary to reduce it by 1.128 times |
Satisfactory | 5.2229 | |||||||
However, too high unevenness of traffic in the zones and highways of the city characterizes the state of the system in terms of traffic density (= 56.3 car/km, Table 2), as “bad”, which requires immediate measures to eliminate the “bad” state of the system. Availability of differentiated multi-lane highways of citywide importance for passing transit traffic flows bypassing the city center (Almaty highway, Turkestan Street, Zhidelibaysyn Street, Zhibek Zholy Avenue, Lengerskoe Highway) allows you to distribute traffic along radial highways to exit the city; Tamerlanovskoye Highway, Republic Avenue, Kapal Batyr Street, Baydybek bi Avenue, Almaty highway, K.Tulemetov Street, Sairamskaya Street, as well as the availability of a bypass highway of the city along the international highway “Western Europe – Western China” made it possible to obtain a functionally differentiated highway system, which is assessed by the indicators of differentiation of the structure of the street and road network and the reserve capacity of highways as “satisfactory”, and by the indicators of the availability of bypasses of the city and the center and the average speed of movement as a “good” condition of the system [7]. The presence of a large number of intersections in the city at the same level, causing frequent stops, acceleration and braking of motor transport, led to an assessment of the state of the system by 12, 13, 14 and 15 indicators at the border of the level from “satisfactory” to “bad”; and by indicators of specific fuel consumption and emissions of toxic substances, which are the most environmental pollution is fully characterized as “bad”. The effectiveness of the functioning of the traffic management system is not characterized in the best way, and according to such indicators as the level of road accidents and traffic noise, the “poor” state of the system [9].
4. Conclusions
In general, the level of development and efficiency of the functioning of the traffic management system, taking into account the state of the environment, has a “satisfactory” evaluation solution. However, the state of the system according to such indicators as: concentration of traffic density in the central zone of the city, reserves of highway capacity, an indicator of the use of streets for one-way traffic, an indicator of restriction and prohibition of traffic on individual highways and in city zones, a high proportion of the operating time of cars in idle modes, acceleration-braking, causing significant fuel consumption and increased emissions of toxic substances are characterized by an assessment – “bad”, which requires the immediate implementation of a set of organizational and technical measures to improve the traffic management system.
References
-
R. Varella, B. Giechaskiel, L. Sousa, and G. Duarte, “Comparison of portable emissions measurement systems (PEMS) with laboratory grade equipment,” Applied Sciences, Vol. 8, No. 9, p. 1633, Sep. 2018, https://doi.org/10.3390/app8091633
-
M. Gis, “Assessment of exhaust emissions from vehicles in real traffic conditions,” in IOP Conference Series: Earth and Environmental Science, Vol. 214, p. 012035, Jan. 2019, https://doi.org/10.1088/1755-1315/214/1/012035
-
M. O. Mussabekov, G. B. Bakyt, A. M. Omirbek, E. Brumerčíková, and B. Buková, “Shunting Locomotives Fuel and Power Resources Decrease,” MATEC Web of Conferences, Vol. 134, p. 00041, Nov. 2017, https://doi.org/10.1051/matecconf/201713400041
-
J. H. Lim et al., “Emission factor of hazardous air pollutants in gas-phase from light commersial vehicle using PEMS on real-road driving,” Journal of Korean Society for Atmospheric Environment, Vol. 34, No. 2, pp. 191–206, Apr. 2018, https://doi.org/10.5572/kosae.2018.34.2.191
-
L. V. Bulavina, “Design and evaluation of the transport network and route system in cities: educational and methodical manual,” Ural Federal University, 2013.
-
N. S. Sifat and Y. Haseli, “A critical review of CO2 capture technologies and prospects for clean power generation,” Energies, Vol. 12, No. 21, p. 4143, Oct. 2019, https://doi.org/10.3390/en12214143
-
O. Bazaluk et al., “Methodology for assessing the risk of incidents during passenger road transportation using the functional resonance analysis method,” Heliyon, Vol. 8, No. 11, p. e11814, Nov. 2022, https://doi.org/10.1016/j.heliyon.2022.e11814
-
G. Bakyt, Y. Jailaubekov, S. Abdullayev, G. Ashirbayev, and I. Ashirbayeva, “Assessment of carbon dioxide emissions in road transport, using exhaust gas cleaning technology, in the Republic of Kazakhstan,” Vibroengineering Procedia, Vol. 48, pp. 87–92, Feb. 2023, https://doi.org/10.21595/vp.2023.23163
-
S. V. Shelmakov and T. U. Grigoreva, “Methodology and examples for assessing the environmental performance of certain road traffic management measures,” IOP Conference Series: Materials Science and Engineering, Vol. 1159, No. 1, p. 012039, Jun. 2021, https://doi.org/10.1088/1757-899x/1159/1/012039
About this article

The authors have not disclosed any funding.
The datasets generated during and/or analyzed during the current study are available from the corresponding author on reasonable request.
The authors declare that they have no conflict of interest.
