Abstract
The paper discusses problems of sustainable development of transport systems with special attention paid to noise pollution and emission of harmful compounds of exhaust gases. It presents traffic flow model for a transport network, which can be applied for estimation of external costs of transport resulting from congestion and congestion-related effects like noise and harmful emission. Model includes structure of vehicle stock, segmentation of transport, characteristics of roads and elements of surroundings. It allows for computational experiments with traffic distribution into transport network and traffic management and, in consequence, estimation of environmental effects of traffic flow. Formal model was supported by numerical example for transport network of Mazowieckie voivodeship in Poland. The example is based on noise pollution and its external costs. The model was developed on the base of EMITRANSYS model for Mazowieckie in 2016.
1. Introduction
Transport related environmental pollution has many faces, but two of them are especially onerous: emission of harmful compounds of exhaust gases and vibroacoustic effects with particular significance of noise. Effective counteracting to these nuisances requires tools supporting decision making in designing sustainable transport systems, especially in the area of predicting and managing traffic flows.
The assessment of environmental efficiency of transport system in terms of pollution and noise should take into account external costs of preventing and eliminating harmful effects of transport activities. In general, the efficiency of transport system is a mix of two elements: effective realization of its main objectives and the costs of counteracting negative effects of its operations. The level of objectives implementation can be described as the effects of the system, while the inputs correspond to the resources involved to achieve the objectives – including reduction of the negative impact of transport on the environment [1, 2].
Unwanted effects of transport operation are environment and health degradation. For example, community noise, including traffic noise, is already recognized as a serious public health problem by the World Health Organization. Most important in this context is the road transport sector, due to the fact that it is responsible for the majority of external costs of transport in total [3]. Over 210 million people in EU is exposed to harmful traffic noise which has a variety of adverse impacts on human health. Noise-induced health effects include: disturbance on sleep, activities, performance and concentration, annoyance and stress, biological risk factors, cardiovascular diseases and psychiatric disorders [4]. It also influences natural environment by scaring and disorientating animals and birds and interrupting natural biological processes. Noise reduction, as well as exhaust emission reduction, is one of the fundamental trends toward cleaner, safer and more user-friendly transport in Europe.
Detrimental effects of transport on the environment and health entails significant indirect costs (arising in the design, manufacture, consumption and utilization of transport means and infrastructure) and direct costs (accidents, noise, vibration). Although effects of this impact are difficult to estimate, but it must be done for proper decision making in traffic management and according to law requirements. The inclusion of costs of negative influence of transport (internalisation), especially in road mode, is postulated as a factor in the development of transport systems in conformity with environmental and health aspects.
Instruments of internalization of transport external costs are presented in Table 1. The instruments can be considered from the point of view of inter-branch interaction and branch transport policy. The best example of an intergovernmental policy instrument is the fuel (energy) tax. This fee is a particularly effective tool in counteracting environmental degradation and improving energy efficiency, and indirectly contributes to reducing other consequences such as noise, accidents, air pollution.
Table 1Instruments of internalization of transport external costs
Types of external effects | Instruments | ||
Road transport | Railway transport | ||
Heavy goods vehicles and buses | Passenger cars | ||
Infrastructure: Variable costs (maintenance) | - fuel tax - distance-dependent tax (differential on weight and number of axles) | -fuel tax | - adjusting service charges depending on the day of the week and the time of day - increase in tariffs following an increase in road charges - free access to the transport network infrastructural payments; |
Infrastructure: Fixed costs (throughput) | - regular vehicle tax - fuel tax - distance tax - road tariffs | ||
Accidents | - differentiation of insurance rates and covering - full costs - speed limits - safety standards and programs | - full and mandatory responsibility - security and monitoring programs - safety standards for vehicles and infrastructure | |
Noise | - emission allowances: when buying a vehicle and regular vehicle tax - road tariffs - noise emission standards - low speed zones - passive noise control - parking space management - high-traffic lanes | - emission standards and active noise control (rolling stock improvement) - passive noise control noise-related fees for operators | |
Air pollution | - fuel / energy tax - fuel / energy tax differentiated according to emissions | ||
- emission-related vehicle registration tax - road tariffs - emission standards | - emission standards for diesel locomotives | ||
- distance-based emission tax | - using low emission vehicles - speed management - parking space management | ||
Source: own work on the base of [5] | |||
Undoubtedly a heavy traffic congestion, especially in urban agglomerations, is a big hindrance and disadvantage. Traffic congestion significantly increases external costs related to time loose [6]. It has a negative impact on health. Due to the increased travel time the stress increases, as well as the arterial pressure. Driver's ability to respond properly decreases, and in consequence safety [7-9]. Although the effects of congestion resulting from excessive traffic, poor traffic management and drivers’ errors are difficult to measure, efforts are made to improve traffic flow, especially in urban areas [10]. Congestion is a result of improper traffic management and objective over-capacity [1, 11-13]. It is also a strong determinant of pollution dispersion and air pollution levels [1, 14-16].
The impact of noise on the lives of the inhabitants in the city is widely discussed [8, 17, 18]. The research is mainly concerned with the impact of noise on health, as well as the ways of measuring or noise levels depending on road conditions. As indicated in works [19-22] often damaged or overload vehicles not only cause vibration and destruction of neighbouring facilities, but also destroy transport infrastructure. Another researches are focused on interweaving environmental, social and economic planes of sustainable development of transport on the ground of mobility [23]. In [24] authors point road transport as a main source of exhaust and noise pollution and define urban mobility assessment indicators in the perspective of environmental protection including formulations of noise-related indicators.
The environmental friendly transport system should primarily be characterized by minimal negative impacts while meeting the essential transport functions and ensuring cost-effective accessibility and mobility for users. In terms of sustainable economy, efficiency means minimizing external costs with the least possible increase in direct transport costs. Reducing external costs means cutting noise and fumes emission. The paper proposes eco-efficiency indicators for the transport performance of a given transport sub-system concerning external costs of pollutant emissions, noise and congestion.
2. Negative influence of transport-related noise on health and environment
2.1. Noise pollution
Valuing the health effects of traffic noise requires methods to express noise effects in monetary values. It is difficult, since noise doesn’t cause direct loses but, through indirect impacts, causes problems spread out over time. The amount of money people is willing to pay to avoid traffic noise provides a good estimate of the loss of well-being people experience (people’s willingness to pay – WTP [4]). Rough estimation of the social costs of traffic noise above 55 dB(A) in the EU in 2007 amount to at least 38 (30-46) billion Euro per year. For rail transport, estimates of social costs due to noise are about 2,4 (2,3-2,5) billion Euro per year. These numbers probably underestimate the actual costs [4]. Another measurement of social costs of traffic noise is based on evaluation of number of disability-adjusted life years. This represents total number of years of life lost due to premature death and of years lived with a reduced level of health, weighted by the seriousness of the health impairment suffered [25]. Actual calculations for both methods are roughly comparable. Finally, it turns out that noise related costs are almost 1/3 of costs of traffic accidents (Fig. 1).
Fig. 1Social costs of traffic noise in the EU27 compared to costs of traffic accidents (2006 price level in billions euro). Source: [4] on the base of INFRAS/IWW (2004), OECD/INFRAS/Herry (2002)
![Social costs of traffic noise in the EU27 compared to costs of traffic accidents (2006 price level in billions euro). Source: [4] on the base of INFRAS/IWW (2004), OECD/INFRAS/Herry (2002)](https://static-01.extrica.com/articles/19371/19371-img1.jpg)
About 90 % of noises-related costs are caused by passenger cars and heavy goods vehicles. This is due to the large number of vehicles and kilometers driven on European roads and dominant role of road transport [4]. Fig. 2 presents distribution of social costs due to traffic noise over transport modes.
Fig. 2Distribution of social costs due to traffic noise in EU over transport modes (2006 price levels in billions euro). Source: [4] on the base of INFRAS/IWW (2004), OECD/INFRAS/Herry (2002)
![Distribution of social costs due to traffic noise in EU over transport modes (2006 price levels in billions euro). Source: [4] on the base of INFRAS/IWW (2004), OECD/INFRAS/Herry (2002)](https://static-01.extrica.com/articles/19371/19371-img2.jpg)
Counting noise-related costs of road transport requires combining noise exposure data with the cost factors for different noise bands. These cost factors are taken from HEATCO (2006 – [26]). In example, the total noise costs for German motorways (outside agglomerations) amount to 250 million Euro per year [3]. When distributed across different vehicle categories using the traffic flow data from TREMOVE model [27], this corresponds to the unit costs in Table 2.
Table 2Illustrative average noise costs for German motorways, Euro (2010) per vkm
Vehicle type | Unit cost |
Car | 0,15 |
Motorcycle | 0,61 |
LCV | 0,18 |
Bus | 0,48 |
HGV < 16 t | 0,44 |
HGV > 16 t | 0,61 |
Source: [3], page 52 | |
A substantial noise reduction requires a fundamental redesign of the vehicles (engines, gas flow and mechanics, tires), pavements, as well as reducing traffic speed, isolating noise sources and moving them away from recipients. Reducing speed and intensity of traffic can be done through proper traffic distribution into transport network combined with consequent infrastructure development.
Limiting speed reduces noise, especially between 50 and 80 km/h (Fig. 3). Two main sources of noise in road transport are vehicle driveline and tyre-to-pavement contact. The general relation between speed and noise level is presented in Fig. 3.
Fig. 3Correlation between velocity and noise emitted by car. Source: [4]
![Correlation between velocity and noise emitted by car. Source: [4]](https://static-01.extrica.com/articles/19371/19371-img3.jpg)
Speed limiting doesn’t need investment expenditures and has a direct effect, but the costs associated with travel time losses may be significant. The effects of speed limit changes on noise reduction are presented in Fig. 4.
Traffic distribution also has an effect on the number of vehicles. Fig. 5 shows noise reduction caused by a reduced traffic volume under assumption of no changes in either speed or percentage of heavy goods vehicles [4].
Fig. 4Effects of speed limit changes on noise reduction (10% of heavy traffic) in dB(A). Source: [28]
![Effects of speed limit changes on noise reduction (10% of heavy traffic) in dB(A). Source: [28]](https://static-01.extrica.com/articles/19371/19371-img4.jpg)
Fig. 5Effects of traffic reduction on noise reduction in dB(A). Source: [28]
![Effects of traffic reduction on noise reduction in dB(A). Source: [28]](https://static-01.extrica.com/articles/19371/19371-img5.jpg)
The European Environment Agency requires policymakers to identify effective measures to reduce noise at source. Currently, many potential measures are already available [29]:
– Improvements to vehicles and aircraft construction, including low noise tyres, train wheels, brake-blocks, and landing gears.
– Improvements to infrastructure, like low noise road surfaces and rail tracks.
– Urban planning that limits settlement close to busy roads, railways or airports, rules on the location, layout and acoustic quality of buildings.
– Traffic management, like traffic calming, controlling the speed, low noise operational procedures for aircraft.
– Restricting access for the noisiest vehicles and aircraft.
– Noise barriers and improved soundproofing of dwellings.
Proper traffic distribution and management have a positive impact not only on noise levels but also on air quality and safety. Reductions in traffic volumes can be done through intensification of public transport usage, promoting cycling and walking on short distances, parking management, and banned access to the selected areas for heavy trucks (see [30]). Other ways to reduce traffic is route designation and bypassing traffic around protected areas [4]. Noise reduction can be achieved also by calming traffic flow through Intelligent Transport System for traffic control. Selected effects of traffic management are presented in Table 3.
Table 3Selected effects of traffic management measures on noise reduction
Traffic management method | Potential noise reduction () |
Traffic calming | Up to 4 dB(A) |
30 km/h zones | Up to 2 dB(A) |
Roundabouts | Up to 4 dB(A) |
Round-top/circle-top road humps | Up to 2 dB(A) |
Speed limits combined with signs about noise disturbance | 1-4 dB(A) |
Night time restrictions on heavy vehicles | Up to 7 dB(A) at night time |
Noise barriers and insulation of dwellings | 3-6 dB(A) |
Source: [4] on the base of Traffic Management and Noise Reducing Pavements: Recommendations on Additional Noise Reducing Measures, Silvia project deliverable, 2005 | |
2.2. Environmental noise directive: the legal framework
The problem of noise pollution is discussed and regulated since increasing transport activity become a nuisance to the environment. Noise pollution in European Union is subjected to END – Environmental Noise Directive 2002/49/EC [30] which provides guidelines to the assessment and management of environmental noise and to identify noise pollution levels, including transport-related noise. The END focuses, among others, on determination of exposure to noise, preventing and reducing environmental noise and preserving environmental noise quality. The END requires Member States to prepare noise maps and noise management action plans for agglomerations with more than 100 000 inhabitants and major roads (more than 3 million vehicles/year). It relates also to railways and airports but these are not included into the paper.
The noise estimation can be done computationally or by measurement. For predictions and development plans only computation is applicable. Member States can use own methods for the determination of long-term noise indicators if these methods are adapted to the general requirements provided by END. Those Members which have no own computation methods for road noise can use NMPB-Routes-96 (SETRA-CERTU-LCPCCSTB) method for road traffic noise as recommended in EDC [30] (like Polish GDDKiA).
Traffic noise is also one of the impacts to be documented during the environmental impact assessment (EIA) of transport infrastructure projects. Guidelines for weighting noise during the decision-making process are set out in European directives 85/337/EEC and 97/11/EC [4].
In 2011, the European Commission adopted a proposal for a new regulation to tighten noise emissions standards in road transport. The proposal foresees a 4 dB reduction in noise emissions from cars and a 3 dB reduction from heavy vehicles. These tightened standards will enter into force five years after the regulation receives final approval, i.e. not before 2017.
The END requires using (day-evening-night noise indicator) in decibels (dB) as a noise indicator for overall annoyance. It is defined by the following formula [30]:
where: , and are the A-weighted long-term average sound levels as defined in ISO 1996-2: 1987, determined respectively over all the day, evening and night periods of a year.
Detailed guidelines for assessing these indicators can be found in literature, like [32].
European legislation addresses railway noise at-source through directives on railway interoperability for high-speed rail (Council Directive 96/48/EC) and conventional rail (Directive 2001/16/EC). Under this legislation, Technical Specifications for Interoperability (TSIs) are established, which include noise limits. Within the operability framework, emission limits regarding the noise of high speed trains (2002) and conventional trains (2005) have been set. These limits apply to new or upgraded rolling stock. A reduction of the limit values by 2-5 dB(A) is foreseen for 2016/18 [4].
The END obligates State Members to make noise maps and provide noise management actions. Noise mapping aims to determine the level of environmental noise pollution throughout measurement, assessment and mapping of sound levels from different sources, including road traffic and railroad transport. Sound levels need to be monitored at different areas and are used for planning activities. Monitoring noise sources is possible at existing transport systems, but planning and designing requires tools supporting traffic distribution and management like EMITRANSYS [11].
3. Criteria for assessing the ecological efficiency of transport system development due to noise and exhaust emissions
3.1. General assumptions
Decision-making problems in transport systems development cover relations between transport tasks, the potential of transport system and the cost of carrying out these tasks (see [16, 33, 34]). Modernization and expansion of transport network, and the adaptation of vehicles to specific requirements must not be based solely on the process of creation of transport network and increasing its capacity. It is important, but it must go hand in hand with improved safety and environmental protection, and must stay in line with legal requirements as it was discussed by many authors [1, 35].
Assessing the level of sustainability alignment is a difficult task. This is mainly due to a number of economic, social and environmental factors that must be taken into account. Sustainable transport development should meet the social needs for mobility and freight transport and at the same time prevent detrimental impact of transport on the environment. Shaping the environmentally friendly transport system must take into account the relationship between structure of transport network, its parameters and the impact of transport activities on the environment.
Assuming that demand for transport is satisfied (not discussed in this paper), ecological efficiency of transport system development can be expressed by set of criteria basing on external costs of transport activity related to noise and exhaust pollution, accidents and congestion. Indexes to assess those effects must use hard data for unit costs and emission standards of different types and data about traffic distribution and management.
4. The indicators of ecological efficiency of transport system related to pollutant and noise emissions
On the ground of environmental and social influence, indicators for assessing ecological efficiency of transport system related to external costs should embrace effects of [5]:
– congestion,
– emission of harmful compounds of exhaust gases
– noise emission,
– accidents – not discussed in the paper,
– water and soil pollution – not discussed in the paper.
For the purposes of formalizing the indicators of ecological efficiency of transport system, the following markings are introduced:
– set of transport subsystems , where 1 is for passenger transport, and 2 for freight transport,
– set of time periods ,
– set of traffic types (transport segments) ,
– set of modes of transport ,
– set of transport node numbers ,
– set of edges (sections) of transport network of -th mode of transport , ,
– set of types of vehicles ,
– set of types of vehicles used by -th mode of transport and -th transport subsystem , , ,
– set of types of engines used in vehicles – see [26],
– set of types of engines in vehicles used in -th mode of transport , ,
– set of emission standards for vehicles ,
– set of emission standards for vehicles used in -th mode of transport , ,
– set of paths in transport relation , ,
– set of pollutants emitted by vehicles ,
– set of transport relations ,
– operation cost of a -th transport subsystem of -th mode of transport in -th time period [PLN], , ,
– distance between people exposed to noise and the axis of the road [m],
– unit emission of -th pollutant from -th type vehicle used in -th transport subsystem of -th mode of transport, equipped with -th type engine meeting -th emission standard and moving on the -th section of transport network in [mg/s/veh], , , , , , , ,
– noise reduction function dependent on location of road segment relative to the observation point for -th segment of transport network of -th mode of transport [–], the segment of a road is limited by angles and [dB], , ,
– length of -th segment of transport network of -th mode of transport [km], , ,
– share of -th type vehicles with -th type engines meeting -th emission standard operating on -th segment of transport network of -th mode of transport in -th transport subsystem, which in -th period carried out work on -th path in relation [%], , , , , , , , , ,
– velocity of free flow on -th segment of transport network of -th mode of transport for -th type vehicles used in -th transport subsystem [km/h], , , , ,
– velocity on -th segment of transport network of -th mode of transport for -th type vehicles used in -th transport subsystem under -th workload in -th period [km/h], , , , , ,
– level of transport services provided in -th period by -th transport subsystem of -th mode of transport by -th type vehicles [t, pas], , , , ,
– traffic load of vehicles of -th type operating on -th segment of transport network in -th transport subsystem of -th mode of transport in -th period [veh], , , , , ,
– traffic load of vehicles of -th mode operating on -th segment of transport network in -th transport subsystem of -th mode of transport which carried out work on -th path in relation [veh], , , , , , , ,
– average content of -th type traffic for vehicle of -th type operating on -th segment of transport network in -th transport subsystem of -th mode of transport in -th period [t/veh, pas/veh], , , , , , ,
– coefficient of noise emission related to the surroundings of road, including presence of sound-proof screens and other objects and roadside management on -th segment of transport network of -th mode of transport [–], , ,
, – parameters of the average noise emission level for the -th type vehicles in -th transport subsystem of -th mode of transport [–], , , ,
– indicator of the effect of distance on emission of -th type pollutant by vehicles of -th type with -th type engines meeting -th emission standard, operating in -th transport subsystem of -th mode of transport set for -th path in relation [–], , , , , , , , ,
– weight of transition time of -th type traffic for vehicle of -th type in -th transport subsystem of -th mode of transport [PLN/t, PLN/pas], , , , ,
– economic efficiency of transport performed by -th transport subsystem in -th period [t/PLN, pas/PLN], , ,
– weighted lengthening of driving time in intense traffic for -th transport subsystem in -th period [PLN], , ,
– emission of -th pollutant from -th transport subsystem in -th period [kg], , , .
Congestion lengthens passengers and freight transport over the time for unloaded network (free flow). This means that passengers are overloading their time for transport instead of leisure or production. Analogously, shipped goods can’t be used for production. Formally, for evaluation of congestion effects, it is important to distinguish between the type of transport and the motivation of the journey or group of goods. Lengthening of transport time due to congestion can be expressed as follows:
Another negative environmental impact of transport is the emission of harmful compounds of exhaust gases. The level of emission depends on traffic velocity conditioned by its intensity, type of vehicle and its engine – including the compliant emission standard and distance (shortest trips generate higher emission). According to that, pollutant emission is defined as follows:
In line with previous observations, external costs of transport embrace costs resulting from noise emission. They are directly related to the noise emitted and to the number of people exposed to noise and their sensitivity to noise. According to the results of the studies, the percentage of people irritated by noise is strongly dependent on noise levels. It should be noted that the problem of estimating traffic noise is extremely complex and depends on a number of factors, including: traffic intensity, traffic structure, traffic flow velocity, distance from roadways, sound and noise barriers, and the angle in which the observation is conducted. Taking into above, sound intensity of vehicles of a given type is determined according to the following (FHWA model, [37]):
However, the total noise level along the sections of transport network is calculated as follows:
In addition, one should remember to include to the analysis both directions of movement.
It was assumed that services realized by transport system are its effects. On the other hand, the expenditure necessary for transport system functioning are manifested by the use of technical means and other resources, and are the cost of its operation. As a consequence, the basic indicator of transport efficiency is the quotient of transport output expressed in provided transport services and the costs of operation (direct only). If operating costs of transport system can be decomposed to the costs of the passenger subsystem and freight subsystem, the analytical form of the economic efficiency index of the transport is as follows:
5. A case study on the impact of transport noise and emission on the environment
The approach to assess environmental impact of transport system presented in the paper was used to evaluate the road transport system of Mazowieckie voivodeship (35 579 km²) in Poland due to traffic congestion and noise emission. The analyses are based on traffic model developed in 2015, and historical data for 2016, for morning and afternoon peaks.
The model of transport system developed in PTV VISUM consists of a network model and a demand model. The network model maps the infrastructure and describes system users’ accessibility to transport network. The demand model provides information on the transport needs identified for the traffic flow units included in the model. The model mainly operates on comodality of road and rail modes. Vehicles for passenger road transport are grouped into following categories: motorbikes, cars, minibuses (6-9 passengers), buses (10-15 passengers), buses (16-45) and vehicles with more than 45 seats. Heavy goods vehicles were divided into light vehicles with (up to 3,5 t) and heavy trucks (up to 24 tons). PTV VISUM model was used for scenario analyses of traffic distribution to determine traffic on particular sections of transport network, and then use that data for estimating noise emissions (see [15] or [33]).
Total time lost in passenger and freight transport are summarized in Table 4, while the structure of transport network according to noise level for selected distances from the road axle are gathered in Tables 5 and 6.
Table 4Loss of time in suburban road traffic in Mazowieckie voivodeship in passenger-hours and tonne-hours
Type of vehicle | Morning peak | Afternoon peak |
Passengers of individual communication | 70 422,9 | 59 091,9 |
Freights carried by delivery vehicles | 6 984,3 | 5 951,2 |
Freights carried by heavy goods vehicles | 23 472,5 | 24 470,6 |
Table 5Noise emission in Mazowieckie voivodeship by suburban traffic according to noise level and distance from the axis of the roadway in the morning peak [%]
Noise dB | Distance from the axis of the road (D) | |||||
5 m | 10 m | 15 m | 20 m | 25 m | 30 m | |
< 50 | 7,1 % | 15,3 % | 24,0 % | 31,9 % | 39,7 % | 47,2 % |
[50-55) | 9,2 % | 19,2 % | 26,7 % | 32,1 % | 33,7 % | 32,1 % |
[55-60) | 20,4 % | 32,9 % | 30,4 % | 21,9 % | 15,0 % | 11,5 % |
[60-65) | 33,9 % | 19,3 % | 11,6 % | 11,1 % | 9,9 % | 7,8 % |
[65-70) | 16,8 % | 10,7 % | 6,3 % | 2,5 % | 1,6 % | 1,3 % |
[70-75) | 10,7 % | 2,2 % | 0,9 % | 0,4 % | 0,1 % | 0,0 % |
[75-80) | 1,7 % | 0,3 % | 0,0 % | 0,0 % | 0,0 % | 0,0 % |
[80-85) | 0,3 % | 0,0 % | 0,0 % | 0,0 % | 0,0 % | 0,0 % |
>= 85 | 0,0 % | 0,0 % | 0,0 % | 0,0 % | 0,0 % | 0,0 % |
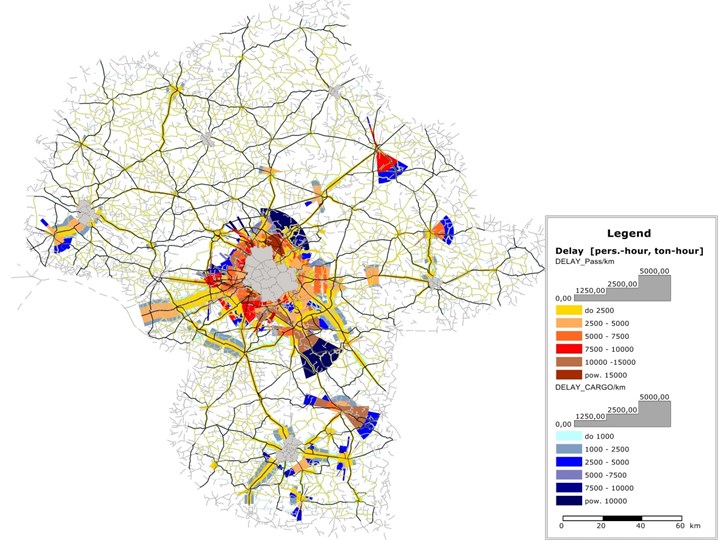
As shown in Table 4, the total loss of time in both passenger and freight transport in suburban traffic in Mazowieckie voivodeship is high. In passenger traffic, during morning peak (two hours) and the afternoon peak (two hours) total loss of time exceeds respectively 70 thousand hours and 59 thousand. hours. These losses are mainly attributable to access roads to larger urban centres (Figs. 6 and 7).
Fig. 6Loss of time per km of the road network of the Mazowieckie voivodeship in 2016 for passenger and freight transport during morning peak
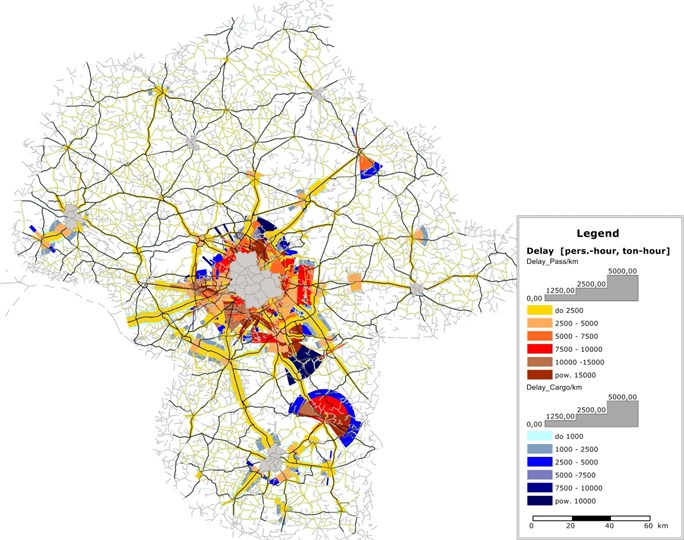
Fig. 7Loss of time per km of the road network of the Mazowieckie voivodeship in 2016 for passenger and freight transport during afternoon peak
According to Tables 5 and 6 traffic congestion may cause adverse health effects and irritability of people within 15 meters of the roadway axis (reference distance) along approximately 50 % of the sections of the Mazowieckie voivodship road network. A traffic noise neutral to health and comfort is less than 55 dB. Noise of not less than 60 dB is on about 30 % of the sections, noise not less than 65 dB on about 11 % of the sections, noise not less than 70 dB on about 6 % of the sections during morning peak and about 8 % of the sections during afternoon peak. Noise in the range of 70 to 75 dB occurs in about 1 % of the sections.
Table 6Noise emission in Mazowieckie voivodeship by suburban traffic according to noise level and distance from the axis of the roadway in the afternoon peak [ %]
Noise dB | Distance from the axis of the road (D) | |||||
5 m | 10 m | 15 m | 20 m | 25 m | 30 m | |
< 50 | 6,3 % | 14,3 % | 22,5 % | 31,4 % | 39,1 % | 46,6 % |
[50-55) | 9,5 % | 19,0 % | 27,4 % | 31,5 % | 33,5 % | 31,4 % |
[55-60) | 20,1 % | 32,2 % | 29,6 % | 21,8 % | 15,0 % | 11,6 % |
[60-65) | 32,8 % | 20,3 % | 11,1 % | 11,1 % | 10,0 % | 9,3 % |
[65-70) | 18,1 % | 10,7 % | 8,3 % | 3,7 % | 2,1 % | 1,2 % |
[70-75) | 10,2 % | 3,0 % | 1,0 % | 0,5 % | 0,2 % | 0,0 % |
[75-80) | 2,6 % | 0,5 % | 0,0 % | 0,0 % | 0,0 % | 0,0 % |
[80-85) | 0,4 % | 0,0 % | 0,0 % | 0,0 % | 0,0 % | 0,0 % |
>= 85 | 0,0 % | 0,0 % | 0,0 % | 0,0 % | 0,0 % | 0,0 % |
Obviously, with increasing distance from the road axis, the noise intensity decreases gradually. For the distance of 30 m negative effects on health and irritability of people may occur along 21-22 % of the suburban sections of the road network of Mazowieckie voivodship.
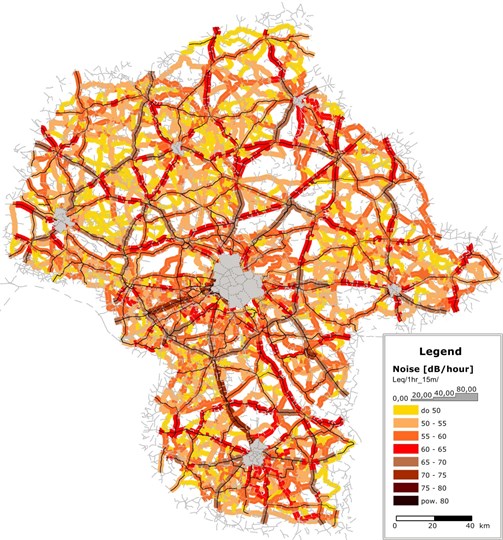
The highest noise emissions occur on main roads with high traffic loads (Figs. 8 and 9).
Fig. 8Noise emission along the suburban segments of the Mazowieckie voivodeship road network in 2016 during morning peak
Total emission of harmful compounds of exhaust gases from road mode in evaluated transport system is presented in Table 7. Graphical representation of emission volumes is presented in Figs. 10 and 11 for morning and afternoon peak respectively. The structure of vehicle stock is adapted as in HBEFA module.
Fig. 9Noise emission along the suburban segments of the Mazowieckie voivodeship road network in 2016 during afternoon peak
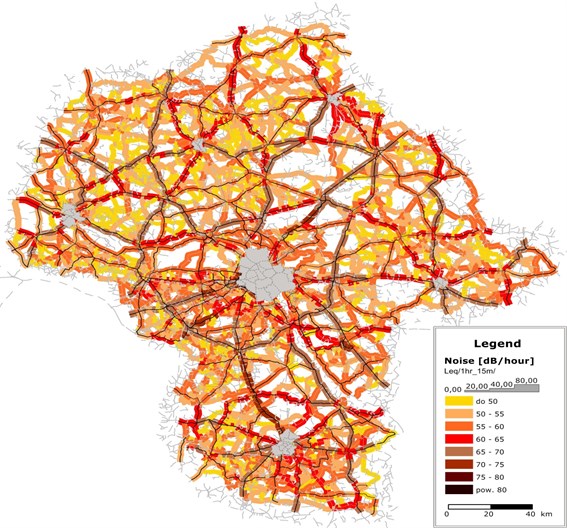
Fig. 10Pollutant emission along the suburban segments of the Mazowieckie voivodeship road network in 2016 during morning peak
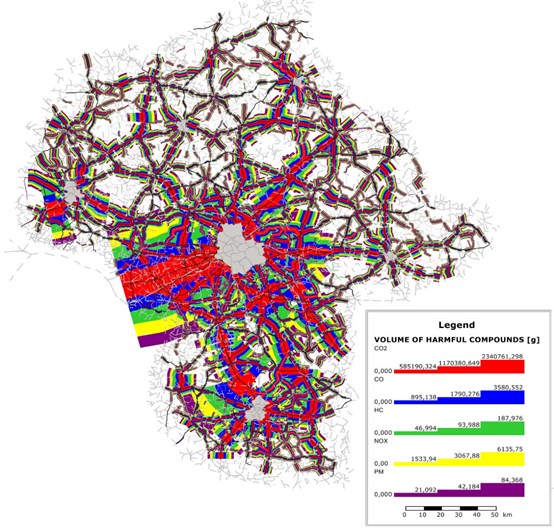
Fig. 11Pollutant emission along the suburban segments of the Mazowieckie voivodeship road network in 2016 during afternoon peak
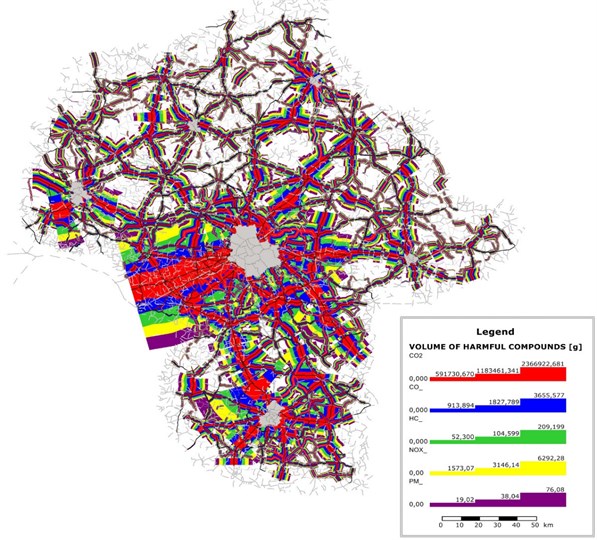
Table 7Pollutant emission in Mazowieckie voivodeship by suburban traffic [g]
Vehicles | Pollutants | Morning peak emission | Afternoon peak emission |
Passenger cars | CO2 | 675 675 718 | 665 027 067 |
CO | 910 430 | 890 421 | |
HC | 69 967 | 68 669 | |
NOx | 1 169 922 | 1148 284 | |
PM | 16 650 | 16 385 | |
VANs | CO2 | 64 967 641 | 59 524 593 |
CO | 58 025 | 52 973 | |
HC | 9 485 | 8 687 | |
NOx | 252 133 | 230 737 | |
PM | 11 609 | 10 640 | |
Heavy goods vehicles | CO2 | 290 531 185 | 327 836 725 |
CO | 492 500 | 555 740 | |
HC | 15 922 | 17 958 | |
NOx | 892 176 | 1 006 319 | |
PM | 7 778 | 8 737 |
6. Conclusions
The development of an ecologically efficient transport system aims to reduce the environmental degradation caused by transport-related noise and pollution. The awareness of the dangers posed by harmful emissions and noise resulting from traffic volumes caused by rapid development of motorization increases since 70’ of XX century. European Union regulations are meaningful and strict in that area and tends are to tighten up the rules. Therefore, when planning the development of transport system, total cost of transport activities must be supplemented by external costs of negative environmental effects. Internalization of external costs of transport must be a fundament of transport policies. With the help of tools for traffic modelling and prediction, like EMITRANSYS, and methods for estimation of harmful emissions and noise, the assessment of environmental impact of transport can be included into investment and planning processes.
The FHWA method applied to predict a noise generated by constant speed highway traffic on the base of traffic distribution in Mazovieckie voivodeship transport network is an example of that combination. The FHWA method incorporates three classes of vehicles – automobiles, medium trucks, and heavy trucks. Adjustments for absorptive ground covers and finite length barriers are also included. These are simple assumptions ready for use in large-scale transport system like analysed transport network. The methodology has proven its usefulness, and when combined with air pollution estimation will provide a complex tool for planning proecological transport systems.
References
-
Jacyna M., Lewczuk K., Szczepański E., Gołębiowski P., Jachimowski R., Kłodawski M., Pyza D., Sivets O., Wasiak M., Zak J., Jacyna Golda I. Effectiveness of national transport system according to costs of emission of pollutants. Safety and Reliability: Methodology and Applications, 2015, p. 567-559.
-
Burdzik R., Konieczny Ł. Research on structure, propagation and exposure to general vibration in passenger car for different damping parameters. Journal of Vibroengineering, Vol. 15, Issue 4, 2013, p. 1680-1688.
-
Korzhenevych A., Dehnen N., Bröcker J., Holtkamp M., Meier H., Gibson G., Varma A., Cox V. Update of the Handbook on External Costs of Transport. Final Report. Report for the European Commission: DG MOVE Ricardo-AEA/R/ ED57769, 2014.
-
Den Boer L. C., Schroten A. Traffic Noise Reduction in Europe CE Report. Delft, 2007.
-
CE Delft, Infras, Fraunhofer ISI. External Costs of Transport in Europe. Update Study for 2008 Delft, CE Delft, 2011.
-
De Palma A., Lindsey R. Traffic congestion pricing methodologies and technologies. Transportation Research Part C: Emerging Technologies, Vol. 19, Issue 6, 2011, p. 1377-1399.
-
Levy J. I., Buonocore J. J., Von Stackelberg K. Evaluation of the public health impacts of traffic congestion: a health risk assessment. Environmental Health, Vol. 9, Issue 65, 2010, p. 1-12.
-
Fuks K., et al. Long-term urban particulate air pollution, traffic noise, and arterial blood pressure. Environmental Health Perspectives, Vol. 119, Issue 12, 2011, p. 1706-1711.
-
Stokols D., Novaco R. W., Stokols J., Campbell J. Traffic congestion, Type A behavior, and stress. Journal of Applied Psychology, Vol. 63, Issue 4, 1978, p. 467-480.
-
Qingyu L. U. O., Zhicai J. U. A. N., Baofeng S. U. N., Hongfei J. I. A. Method research on measuring the external costs of urban traffic congestion. Journal of Transportation Systems Engineering and Information Technology, Vol. 7, Issue 5, 2007, p. 9-12.
-
Jacyna Gołda I., Żak J., Gołębiowski P. Models of traffic flow distribution for various scenarios of the development of proecological transport system. Archives of Transport, Vol. 4, Issue 32, 2014, p. 17-28.
-
Jacyna Gołda I., Lewczuk K., Szczepański E., Gołębiowski P. Distribution of Traffic in the Transport Network Using the Emitransys Model in the Context of Transport System Development Scenarios. Publishing House of the Warsaw University of Technology, Warsaw, 2014.
-
Wasiak M., Kłodawski M., Lewczuk K., Jachimowski R., Szczepański E. Chosen aspects of simulation model to designing proecological transport system. Journal of Kones Powertrain and Transport, Vol. 21, Issue 4, 2014, p. 525-532.
-
Vaitiekūnas P., Banaitytė R. Modeling of motor transport exhaust pollutant dispersion. Journal of Environmental Engineering and Landscape Management, Vol. 14, Issue 1, 2007, p. 39-46.
-
Jacyna M., Ambroziak T., Merkisz Guranowska A., Pielecha J., Jacyna Gołda I., Lewczuk K., Pyza D., Wasiak M., Szczepański E., Żak J. The influence of road transport on emission of toxic substances in Poland against the EU countries. Journal of Kones Powertrain and Transport, Vol. 21, Issue 3, 2014, p. 133-140.
-
Jacyna M., Wasiak M., Lewczuk K., Kłodawski M. Simulation model of transport system of Poland as a tool for developing sustainable transport. Archives of Transport, Vol. 3, Issue 31, 2014, p. 23-35.
-
Galilea P., De Dios Ortuzar J. Valuing noise level reductions in a residential location context. Transportation Research Part D: Transport and Environment, Vol. 10, Issue 4, 2005, p. 305-322.
-
Jakovljevic B., Paunovic K., Belojevic G. Road-traffic noise and factors influencing noise annoyance in an urban population. Environment International, Vol. 35, Issue 3, 2009, p. 552-556.
-
Korzeb J., Chudzikiewicz A. Evaluation of the vibration impacts in the transport infrastructure environment. Archive of Applied Mechanics, Vol. 85, Issues 9-10, 2015, p. 1331-1342.
-
Hunaidi O. Traffic Vibrations in Buildings. Institute for Research in Construction, National Research Council of Canada, 2000.
-
Pais J., Amorim S., Minhoto M. Impact of traffic overload on road pavement performance. Journal of Transportation Engineering, Vol. 139, Issue 9, 2013, p. 873-879.
-
Sivilevicius H., Sukevicius S. Dynamics of vehicle loads on the asphalt pavement of European roads which cross Lithuania. Baltic Journal of Road and Bridge Engineering, Vol. 2, Issue 4, 2007, p. 147-154.
-
Chamier Gliszczyński N., Bohdal T. Mobility in urban areas in environment protection. Rocznik Ochrona Środowiska/Annual set The Environment Protection, Vol. 18, 2016, p. 387-399.
-
Chamier Gliszczyński N., Bohdal T. Urban mobility assessment indicators in the perspective of the environment protection. Rocznik Ochrona Środowiska/Annual set The Environment Protection, Vol. 18, 2016, p. 670-681.
-
Monetisation of the Health Impact Due to Traffic Noise. Swiss Agency for the Environment, Forests and Landscape, Bern, 2003.
-
Bickel et al. P. Proposal for Harmonised Guidelines. Deliverable D5 of HEATCO Project, including Annexes A-E. IER – University of Stuttgart, Stuttgart, 2006.
-
Proost S. Tremove 2 Service contract for the further development and application of the Tremove transport model – Lot 3: Final Report Part 2: Description of the baseline. European Commission, Directorate General of the Environment, Brussels, 2006.
-
Traffic Management and Noise Reducing Pavements: Recommendations on Additional Noise Reducing Measures. Danish Road Institute, Ministry of Transport and Energy, Copenhagen, 2004.
-
Turn Down the Noise - Softening the Impact of Excess Transport Noise. European Environment Agency Articles, 2009, www.eea.europa.eu/articles/turn-down-the-noise-2013-67-million-europeans-endure-high-transport-noise-exposure.
-
Ambroziak T., Jachimowski R., Pyza D., Szczepański E. Analysis of the traffic stream distribution in terms of identification of areas with the highest exhaust pollution. Archives of Transport, Vol. 4, Issue 32, 2014, p. 7-16.
-
Directive 2002/49/EC of The European Parliament and of the Council of 25 June 2002 Relating to the Assessment and Management of Environmental Noise. Official Journal of the European Communities.
-
Makarewicz R., Gołębiewski R. Estimation of the long term average sound level from hourly average sound levels. Applied Acoustics, Vol. 111, 2016, p. 116-120.
-
Jacyna M., Merkisz J. Proecological approach to modelling traffic organization in national transport system. Archives of Transport, Vol. 2, Issue 30, 2014, p. 43-56.
-
Zieja M., Smoliński H., Gołda P. Information systems as a tool for supporting the management of aircraft flight safety. Archives of Transport, Vol. 36, Issue 4, 2015, p. 67-76.
-
Merkisz J., Pielecha J., Radzimirski S. New trends in emission control in the European Union. Springer Tracts on Transportation and Traffic, Vol. 4, 2014.
-
Merkisz J., Jacyna M., Merkisz Guranowska A., Pielecha J. The parameters of passenger cars engine in terms of real drive emission test. Archives of Transport, Vol. 4, Issue 32, 2014, p. 43-50.
-
U.S. Department of Transportation. Fedral Highvay Administration. FHWA Highway Traffic Noise Prediction Model, 1978.
Cited by
About this article

