Abstract
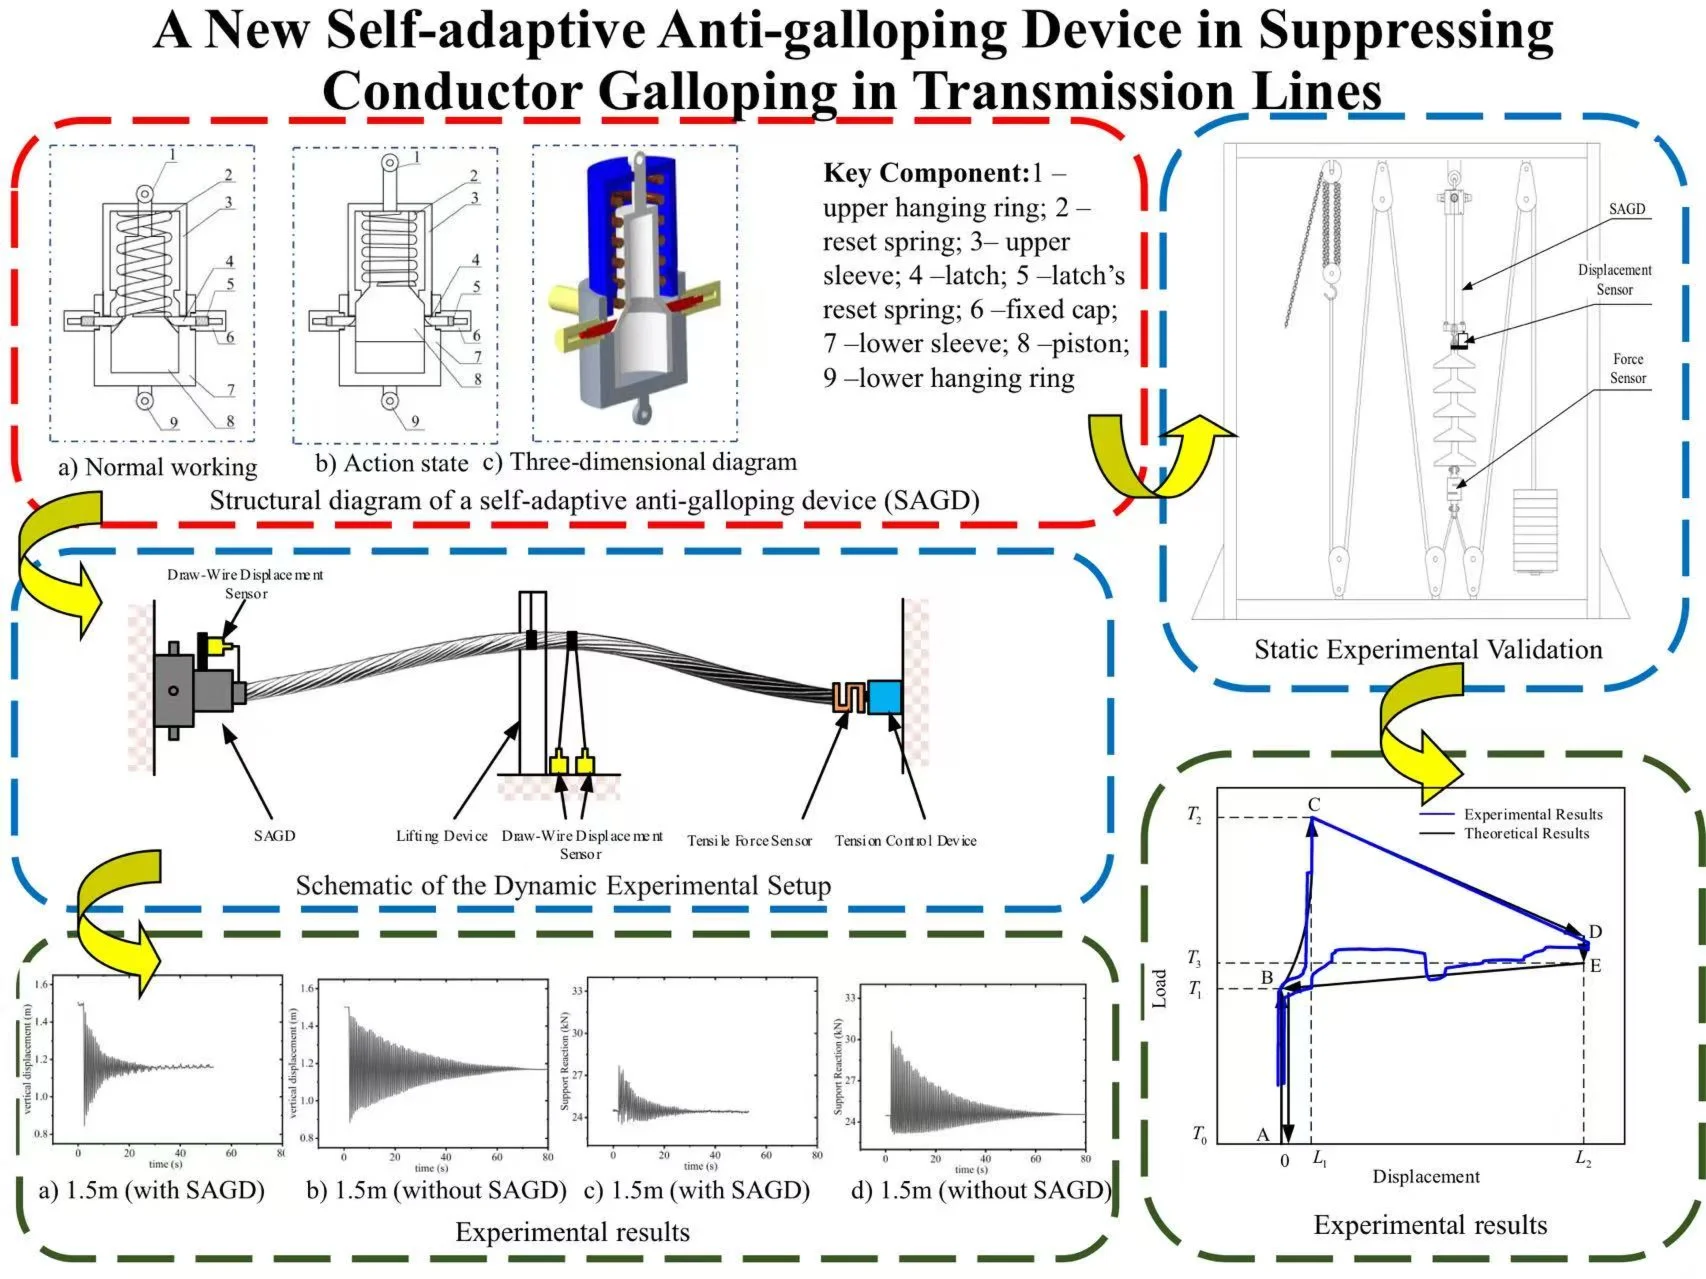
Conductor galloping is a serious threat to transmission line integrity, inducing excessive conductor tension that may lead to catastrophic failures including conductor breakage and tower collapse. This study proposes a novel self-adaptive anti-galloping device (SAGD) to mitigate galloping amplitudes and reduce associated risks. In this paper a novel self-adaptive anti-galloping device (SAGD) to mitigate galloping amplitudes and reduce associated risks was proposed. The structural design scheme of the device is provided, and its operation sequence was verified through static loading experiments. Conductor free-falling experiments validated the SAGD's vibration control performance, with test results demonstrating its practical applicability for transmission line protection. A finite element model for the conductor-SAGD system was developed, enabling numerical simulation of galloping displacement time history and analysis of endpoint support reaction dynamics. The device's galloping suppression effectiveness is systematically evaluated under varying stroke lengths and threshold conditions.
Highlights
- A novel self-adaptive anti-galloping device (SAGD) is proposed, which dynamically activates upon exceeding a preset tension threshold to dissipate energy and alter the conductor's natural frequency, then automatically resets for repeated intervention.
- Experimental validation confirms the SAGD's effectiveness, showing a 9.5% reduction in peak support reaction force and a 55.9% decrease in vibration attenuation time compared to an unprotected conductor in free-fall tests.
- A comprehensive finite element model of the conductor-SAGD system is developed using ANSYS, incorporating aerodynamic loads and nonlinear dynamics to accurately simulate galloping behavior and device interaction.
- Parameter analysis reveals optimal SAGD configuration: a motion stroke of 0.25 m and a trigger threshold of 50 kN provide superior galloping suppression, balancing performance with structural safety and device longevity.
- The SAGD significantly suppresses galloping amplitudes and support reactions, with simulations showing reductions of up to 84.5% in horizontal displacement and 25.2% in endpoint reaction force under optimal parameters.
1. Introduction
The rapid expansion of power grid infrastructure and the increased frequency of severe weather events since the 21st century have led to a significant rise in conductor galloping incidents on overhead lines, along with heightened damage severity [1-3]. Conductor galloping occurs annually on a large scale, causing substantial social and economic impacts. This phenomenon poses risks to power networks, potentially leading to flashovers, tripping, and loosening of tower bolts. In extreme cases, it can result in insulator failures, line breakages, and structural collapses [4-6].
In order to mitigate the secondary disasters caused by conductor galloping, a variety of devices are utilized in engineering projects. These include interphase spacer bars, line clamp rotary spacer bars, double swing anti-galloping devices, detuned pendulums, and eccentric weights [7-9]. Yan et al. developed a method to prevent transmission line galloping by applying shock loads, demonstrating the viability of this technique [10]. Similarly, Huang et al. introduced a strategy to reduce vibration energy by installing a damper near the conductor on the tower, effectively curtailing galloping [11]. In a simulation study concerning 500 kV transmission lines, Lu et al. explored anti-galloping interventions using horizontally arranged ground spacers [12].
Current anti-galloping strategies primarily consist of deploying various devices that are customized based on local meteorological conditions, structural characteristics of the lines, and their orientation [13-15]. However, most existing anti-galloping devices are directly attached to the conductor, potentially leading to fatigue damage [16-18]. Moreover, the performance of these devices can vary due to local weather conditions and they generally lack adaptive capabilities to dynamically counteract galloping.
To enhance the efficiency and applicability of galloping suppression, a new self-adaptive anti-galloping device (SAGD) that dynamically responds to changes in support reactions to improve the suppression of conductor galloping was introduced in this paper. The device activates automatically when the support reaction surpasses a predefined threshold, dissipating vibrational energy and altering the system's natural frequency, thus restraining the amplitude of conductor galloping and reducing conductor tension. As the tension in the conductor decreases, the device automatically resets, allowing for multiple interventions to effectively achieve adaptive galloping prevention.
2. Construction and working principle of the SAGD
When a transmission line experiences galloping, the tension in the conductor significantly increases and displays periodic fluctuations. Studies have demonstrated that modifying the conductor’s natural frequency and dissipating the galloping energy can effectively mitigate the galloping phenomenon and decrease the tension at the conductor's suspension points on tension towers [19-21].
2.1. Structural diagram
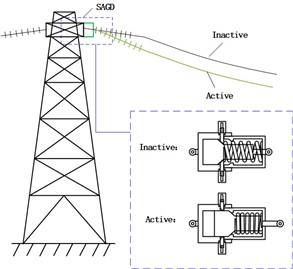
As shown in Fig. 1(a), Fig. 1(b) and Fig. 1(c), the structural diagram of the self-adaptive anti-galloping device (SAGD) is proposed. The SAGD consists of three main components: the start-up assembly, reset assembly, and installation assembly. The start-up assembly sets the device's activation threshold. The reset assembly establishes the reset spring preload to enable device reset. The installation assembly mounts the device on the grid.
The start-up assembly includes latch 4, latch reset spring 5, and fixed cap 6. The reset assembly consists of reset spring 2, upper sleeve 3, lower sleeve 7, and piston 8. Device control is primarily achieved through the preload of reset springs 2 and 5.
Fig. 1Structural diagram of a self-adaptive anti-galloping device (SAGD): 1 – upper hanging ring; 2 – reset spring; 3 – upper sleeve; 4 – latch; 5 – latch’s reset spring; 6 – fixed cap; 7 – lower sleeve; 8 – piston; 9 – lower hanging ring
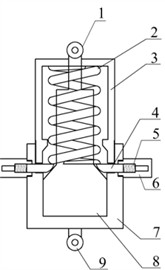
a) Normal working
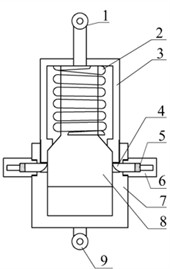
b) Action state
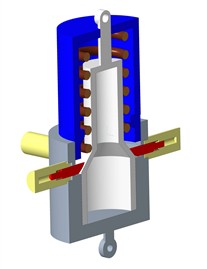
c) Three-dimensional diagram
d) Schematic diagram of SAGD actuation principle
Prior to assembly, the activation threshold is coarsely set by adjusting the preload of reset spring 2. Once assembled, reset spring 2 becomes non-adjustable. During operation, precise threshold tuning is accomplished by adjusting fixed cap 6. The activation threshold is accurately determined by measuring the thread engagement depth of fixed cap 6.
The installation assembly includes hanging rings 1 and 9. The device is securely mounted on a bracket using a high-strength bolt connected to the strain tower’s cross arm. The upper hanging ring attaches to the insulator string end.
The operational threshold of SAGD depends on the vertical component of contact force between latch 4 and piston 8’s inclined plane. When tension at the strain tower's hanging point exceeds this threshold, piston 8’s bevel forces latch 4 back into fixed cap 6. Subsequently, piston 8 moves within the sleeve toward upper sleeve 3’s brake bevel, causing SAGD extension. This extension dissipates energy and alters the system’s natural frequency, reducing both conductor galloping amplitude and conductor tension. These effects enhance transmission line protection, significantly lower conductor breakage risk, and minimize grid-related accident losses. The picture of SAGD before the test is shown in Fig. 2.
As can be seen in Fig. 1(d), the SAGD is mounted on the cross-arm of a strain tower and functions as a power line fitting by connecting in series between the conductor and the tower structure. Unlike conventional anti-galloping devices, which are predominantly connected in parallel within power systems and may exacerbate conductor fatigue damage, the SAGD offers two significant advancements: first, the activation threshold can be precisely calibrated on-site by adjusting the fixed cap 6 to accommodate specific line conditions; second, the device provides real-time modulation of conductor tension, effectively suppressing energy accumulation during galloping.
Fig. 2Picture of SAGD
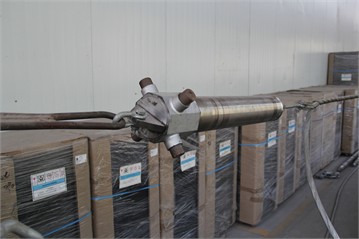
a) Front view
b) Back view
2.2. Action sequence and experimental verification
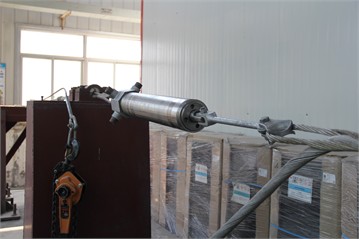
To demonstrate the SAGD actuation sequence, the static experimental setup and device are shown in Fig. 3(a) and Fig. 3(b). The elongation of the SAGD is tested using a Stem-type displacement sensor, and the force from the manual chain hoist is tested with a force sensor. Fig. 3(c) presents the action sequence diagram and the experimental results of the SAGD, where the black solid line denotes the relationship between tension and displacement.
As shown in Fig. 3(c), Point A characterizes the state under initial tension at the hanging point. Segment A-B depicts the tension increase in the SAGD while displacement at the suspension point remains zero. Segment B-C illustrates the latch being pushed back to the fixed cap by the contact slope, representing the threshold for latch actuation initiation. Point C denotes the maximum pulling force during device operation. Segment C-D is the device extension phase, where the load on the SAGD decreases and the hanging point extends to maximum stroke . Segment D-E represents the force decrease. Following the extension of the SAGD, the tension at the hanging point decreases but may remain above the reset tension of the reset spring. The section E-B marks the reset stage of the SAGD, where the reset force is provided by the reset spring upon reaching the maximum stroke. Finally, the segment B-A indicates the gradual stabilization of the system.
Fig. 3Time sequence diagram of SAGD
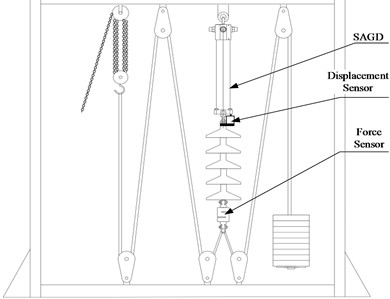
a) Experimental setup
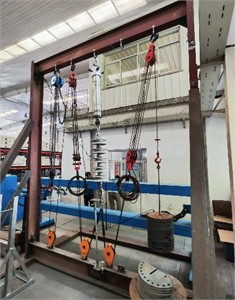
b) Experimental site
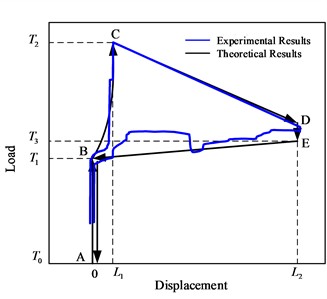
c) Experimental results
2.3. Dynamic process test verification
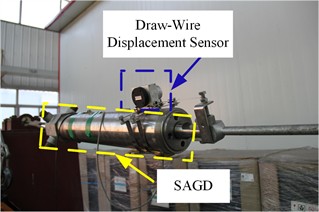
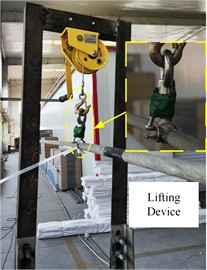
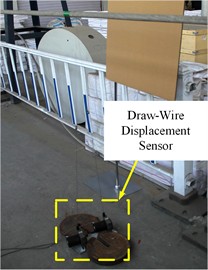
In order to validate the effectiveness of the SAGD under dynamic load, the conductor free-falling experiments were conducted in the laboratory. As shown in Fig. 4 and Fig. 5, the SAGD is installed at the suspension point of a 50 m isolated single-conductor span in the laboratory, and the trigger load is set at 26 kN. A draw-wire displacement sensor (DS) is mounted on the SAGD to monitor its elongation. On the opposite suspension point, a hydraulic cylinder and a tensile force sensor (TFS) are connected in series, enabling real-time tension adjustment and monitoring. A lifting device is positioned at the midpoint of the span, using a winch to hoist the conductor secured by a U-bolt. The conductor is released by removing the U-bolt. Since the free-falling conductor vibrates perpendicular to its axial direction, two draw-wire displacement sensors are installed 2 meters from the midpoint (ground-fixed, aligned perpendicular to the conductor) to cancel out measurement interferences.
In this experiment, the conductor midpoint is raised to a predetermined height and released to simulate large-amplitude vibrations. Energy input is controlled by adjusting lift height. The effects with/without SAGD are determined by locking or releasing the start-up assembly, enabling comparison of test results to quantify SAGD influence.
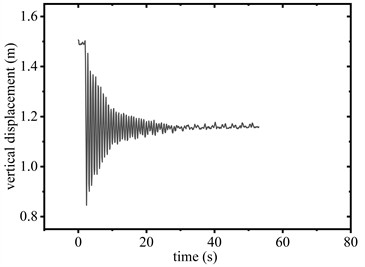
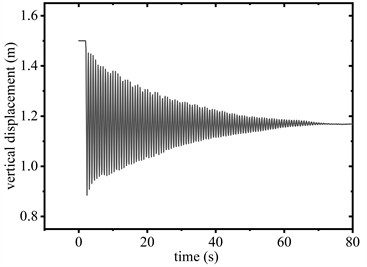
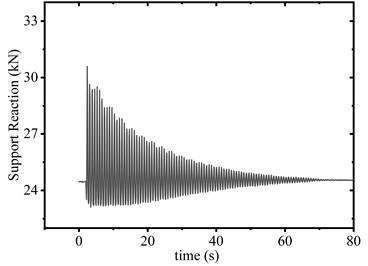
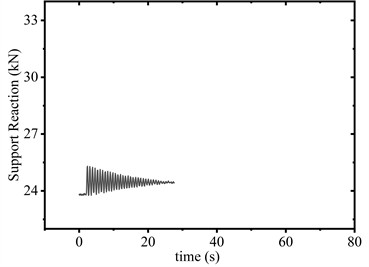
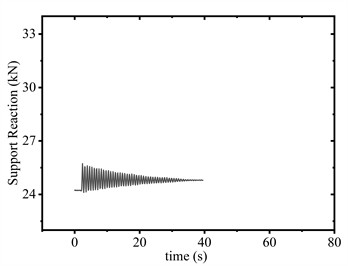
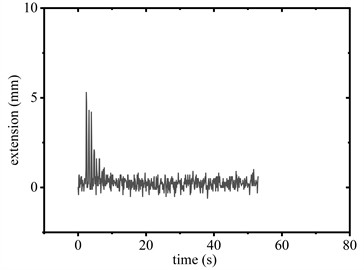
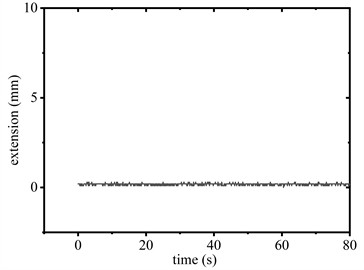
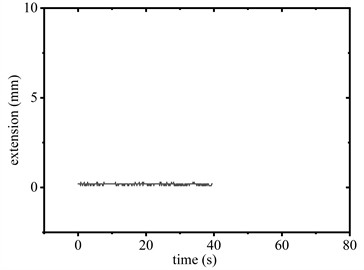
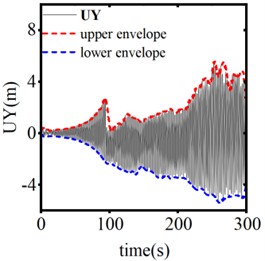
Fig. 6 compares the vertical displacement responses of the conductor elevated to heights of 1.5 m and 1.2 m above the sensor with and without the SAGD respectively. Fig. 7 shows the corresponding time-history diagrams of support reaction forces at the span’s termination. Fig. 8 shows the elongation of SAGD during the free-falling of the conductor.
Fig. 4Schematic diagram of the experimental setup
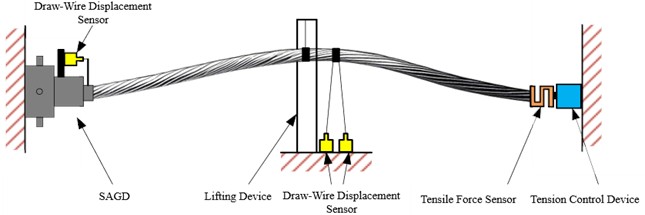
Fig. 5Test site layout diagram
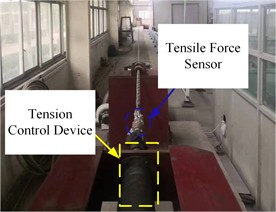
a) hydraulic cylinder and tensile force sensor
b) SAGD and draw-wire displacement sensor
c) Lifting device
d) Draw-wire displacement sensor
As can be seen in Fig. 6(a) and Fig. 6(b), when the conductor is released from 1.5 m elevation with SAGD installed, the device activation was triggered (see Fig. 8(a)). The peak support reaction force at the suspension point measured 27.7kN (see Fig. 7(a)), with both reaction forces and vibration displacements stabilizing after 31.3s. In the control configuration (without SAGD), the peak reaction force reached 30.6 kN (see Fig.7(b)) at the suspension point, requiring 70.9 s for stabilization. Comparative analysis shows SAGD implementation achieved a 9.5 % peak force reduction and a 55.9 % attenuation duration decrease.
When the conductor was elevated to 1.2 m, the SAGD did not reach its trigger load of 26 kN. As shown in Fig. 8(c) and Fig. 8(d), the device exhibited limited reciprocating motion within the 0 to range during operation. Support reaction forces remained below the activation threshold, resulting in no significant peak force suppression. Despite this, vibration attenuation duration decreased from 35.6 s to 25.9 s, representing a 27.3 % reduction compared to baseline conditions.
Therefore, it can be concluded during conductor galloping, as amplitude increases the tension at the hanging point rises correspondingly. When tension reaches the SAGD's threshold, the trigger mechanism automatically activates. This alters conductor tension, reduces its natural frequency, and dissipates galloping energy, thereby effectively suppressing galloping and ensuring transmission line safety.
Fig. 6Vertical displacement of conductor midpoint
a) 1.5 m (with SAGD)
b) 1.5 m (without SAGD)
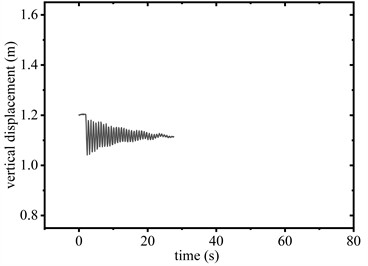
c) 1.2 m (with SAGD)
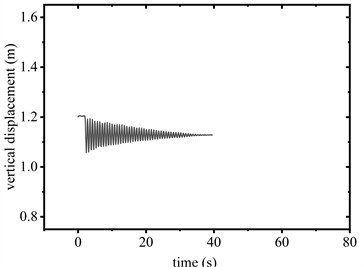
d) 1.2 m (without SAGD)
Fig. 7Supporting reaction force of conductor
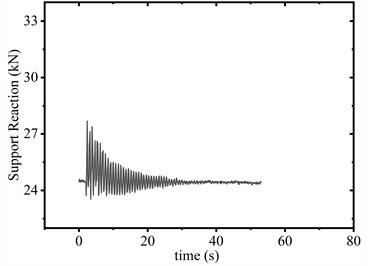
a) 1.5 m (with SAGD)
b) 1.5 m (without SAGD)
c) 1.2 m (with SAGD)
d) 1.2 m (without SAGD)
Fig. 8Elongation of SAGD
a) 1.5 m (with SAGD)
b) 1.5 m (without SAGD)
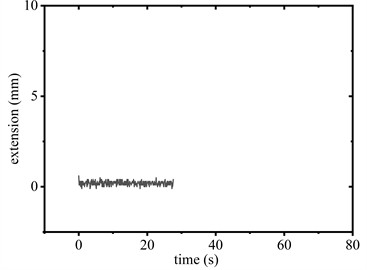
c) 1.2 m (with SAGD)
d) 1.2 m (without SAGD)
2.4. Modeling of the conductor-SAGD system
The simulation of the anti-galloping process for the conductor-SAGD system involves calculating aerodynamic loads, optimizing wire shape, and simulating device motion dynamics. Given that ANSYS supports the use of APDL for determining wire shape and calculating aerodynamic loads, this study utilizes ANSYS to simulate the anti-galloping process [22-24].
Table 1Conductor-SAGD system model parameters
Item | Parameter |
Conductor type | LGJ-240/30 |
Cross-sectional area (mm2) | 275.96 |
Outside diameter (mm) | 21.6 |
Weight (kg/km) | 922.2 |
Rated tensile strength (N) | 75620 |
Elastic coefficient (MPa) | 73000 |
Horizontal tension (N) | 17100 |
Linear expansion coefficient (1/℃) | 19.6×10⁻⁶ |
Span (m) | 420 |
Wind speed (m/s) | 15 |
Initial angle of attack (°) | 70 |
Ice thickness (mm) | 10 |
Ice shape | Crescent-shape |
This study focuses on the section from pole No. 122 to tower No. 123 of the 220 kV transmission line, extending from Yuzhuang Station to Luqiao Station in Hebei Province, to serve as the test conditions for the SAGD simulation. The model parameters for the conductor-SAGD system are detailed in Table 1.
2.5. Aerodynamic model of ice-covered conductor
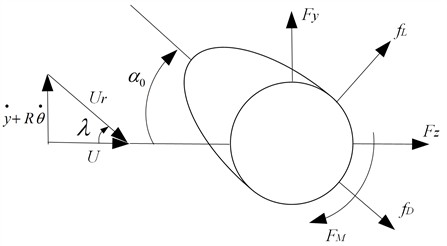
Cangzhou, located in Hebei Province, is situated near the sea and experiences strong winds and high humidity. Consequently, power lines in this region are susceptible to ice accumulation and galloping. Notably, wires situated within the secondary galloping zone face heightened risks of ice formation and galloping, making this area an optimal observation point for conductor galloping. In this region, the ice-covered wires typically take on a crescent shape. This paper presents the calculation and analysis of aerodynamic loads on crescent-shaped ice-covered wires. As illustrated in Fig. 9, the resistance () acts in the direction of the relative wind speed, while the lift () is oriented perpendicular to this direction [25]. represents the initial value of the wind attack angle of the conductor, and denotes the additional influence of transverse wind vibration and torsional vibration on the wind attack angle. and correspond to wind speed and relative wind speed [26-27].Additionally, , and denote the vibration velocities of the wire in the transverse, downwind, and torsional directions. represents the radius of the wire.
As illustrated in Fig. 9, the expression for the additional influence of wire movement on the wind attack angle is as follows:
The wind attack angle of the ice-covered wire can be expressed as follows:
where is the torsion angle of the ice-covered wire in Eq. (2).
Since the drag coefficient (), lift coefficient (), and torque coefficient () are all functions of the wind attack angle, a cubic polynomial is typically employed to model the aerodynamic coefficients [28]:
where includes the drag coefficient, lift coefficient and torque coefficient in Eq. (3).
Based on the aerodynamic coefficients, the aerodynamic drag (), aerodynamic lift (), and torque () of the wire per unit length can be calculated as follows:
Transform the lift (), drag (), and torque () illustrated in Fig. 9 to align with the axis direction as follows [29]:
3. Initial shape of conductor
The overhead line represents a typical suspension cable structure. Due to external loads, the significant displacements of the relaxed wire make accurate calculations and analyses based just on relaxed wire’s loading impractical. The initial shape finding of the overhead line can establish the self-equilibrium state under the influence of self-weight and prestress, providing the stress and displacement parameters in the initial state [30]. Once the initial configuration of the conductor is determined, various accurate static and dynamic analyses can be performed on the wire.
Fig. 9Schematic diagram of aerodynamic model of ice-covered traverse section
Since the horizontal component of the axial tension at each point along the overhead line is uniform, it corresponds to the horizontal tension at the lowest point of the line [31]. Therefore, the lowest axial tension of the sag is utilized as the convergence condition to determine the initial shape of the conductor. A geometric model was developed to represent the wire connecting the two supports, actual material properties and constants were incorporated. Additionally, the initial strain and gravitational acceleration were applied to the wire, while geometric nonlinearity and stress stiffness options were enabled. The Newton-Raphson method was employed to iterate the process until the configuration and stress of the wire satisfied the convergence conditions [32].
The theoretical values and simulation results of some parameters for the overhead conductor are listed in Table 2. It can be seen from the data in the table that the theoretical calculations of the mid-span sag and maximum tension parameters exhibit minimal discrepancies compared with the software analysis results, with a maximum error of only 0.89 % [33].
Table 2Comparison between simulation results and theoretical results
Simulation results | Theoretical results | Error value (%) | |
Mid-span sag (m) | 3.33 | 3.36 | 0.89 |
Maximum tension (kN) | 16.99 | 17.10 | 0.64 |
4. Galloping simulation
As illustrated in Fig. 9, the ice-covered wire of the transmission line primarily experiences three aerodynamic forces in the wind field: drag, lift, and torque. Due to the low flexural stiffness of the conductor, the Beam188 element, which allows for the release of bending freedom, is employed to model the overhead line in this paper. The bending freedom around the and axes of the Beam188 element is released, allowing the wire unit to move along the , , directions and twist around the axis. Following the completion of shape finding, the overhead line is subjected to loading to facilitate static and dynamic analysis.
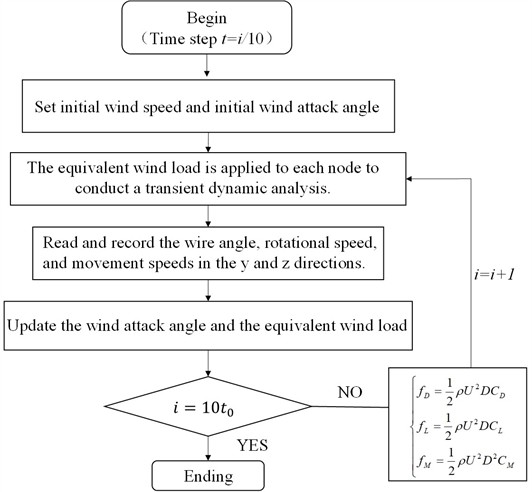
Fig. 10 illustrates the flow chart of aerodynamic load loading process for the conductor. Prior to conducting the conductor galloping simulation, it is essential to consider ice loading. A secondary shape-finding process is performed for the system, followed by the conductor galloping simulation. Due to the large deformations inherent in conductor galloping, the full transient dynamic analysis method was employed during the simulation [34]. The load step is set to 0.1 seconds in this study, during which the coordinates of each node of the wire, the displacement velocities in the and directions, as well as the torsion angle and torsion velocity of the wire around the axis, are recorded at intervals of 0.1 seconds. The wire parameters obtained from the preceding load step are substituted into Eq. (2) to calculate the wind attack angle for the current load step. The wind attack angle is then used in Eq. (5) to determine the equivalent wind load on each node. Finally, each node is reloaded, completing the cyclic loading calculations within the designated time frame.
Fig. 10Flow chart of aerodynamic load loading process for the conductor
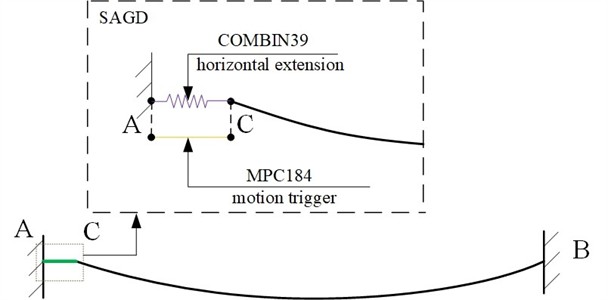
The conductor-SAGD system is simulated to validate SAGD effectiveness. The finite element model is shown in Fig. 11, where a SAGD is installed in the AC section. Point A of the device is fixed to the strain tower's crossarm, while Point C is fixed to the conductor. A horizontal COMBIN39 unit simulates the return spring and motion stop card slot in the AC-section SAGD, whereas an MPC184 unit simulates the motion trigger. When horizontal tension at the strain tower’s hanging point exceeds the threshold, the MPC184 unit is deactivated, and the COMBIN39 unit engages with the system to undergo extension.
4.1. Analysis of parameter influence and results
This paper investigates the influence of the motion stroke and trigger threshold of the SAGD on conductor galloping. The horizontal reaction force at the span-end conductor suspension point is employed as the criterion for detecting galloping. The test span conductor, LGJ-240/30, has a calculated breaking strength of 75,620 N, while the initial tensile force of the ice-covered conductor is 32,080 N. In this study, the safety factor for the operational tension of the conductor is set at 1.5. If the activation threshold is set too low, galloping cannot be reliably detected; conversely, if set too high, the conductor may not be sufficiently protected from dynamic overload. Three thresholds (40 kN, 45 kN, and 50 kN) are systematically evaluated in galloping simulation analyses to balance detection sensitivity and protection effectiveness. Considering the load-bearing capacity of the cross arm, it is necessary to minimize the weight of the SAGD. When the SAGD is at its maximum stroke, it is imperative to prevent the wire hanging point from exceeding the original hanging point by too great a margin, as this would increase the sag of the line and pose safety risks. This study sets the SAGD stroke at 0.25 m and 0.3 m to balance the need for equipment lightweight design and safety, while ensuring effective suppression of galloping. This study examines the displacement response and stopping end support reaction of the conductor under motion strokes of 0.25 m and 0.3 m, as well as trigger thresholds of 40 kN, 45 kN, and 50 kN.
Fig. 11Finite element model of conductor-SAGD system
5. Influence of the stroke
When the trigger threshold of the SAGD is set at 45 kN, Fig. 12 illustrates the conductor galloping trajectory of the center of the span under three working conditions: no SAGD action, motion strokes of 0.25 m and 0.3 m. The figure indicates that the peak-to-peak values of vertical displacement under the three working conditions are 11.54 m, 10.15 m, and 6.47 m, respectively, while the peak-to-peak values of horizontal displacement are 11.09 m, 4.12 m, and 1.72 m, respectively. With a motion stroke of 0.25 m, the amplitudes of vertical and horizontal motion decrease by 12.05 % and 62.85 %, respectively. When the motion stroke is increased to 0.3 m, the amplitudes of galloping decrease by 43.93 % and 84.49 %, respectively. These results demonstrate that the horizontal and vertical displacements associated with conductor galloping are effectively suppressed after SAGD action, and that the anti-galloping effect is significantly enhanced with increasing motion stroke.
Fig. 12Conductor galloping trajectory of the center of the span
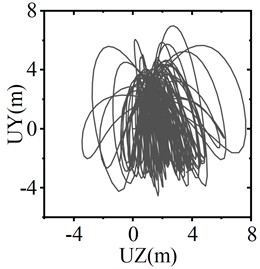
a) Device inactive
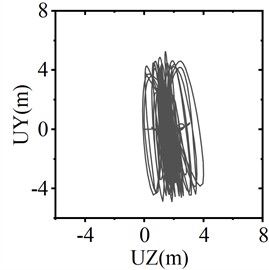
b) Motion stroke 0.25 m
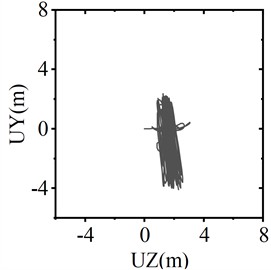
c) Motion stroke 0.3 m
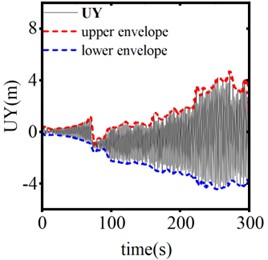
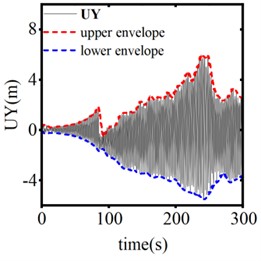
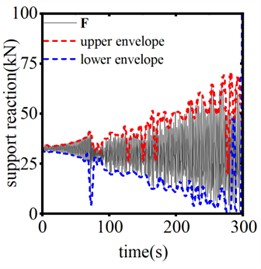
Fig. 13 illustrates the vertical displacement response from the center of the span when the device is inactive, as well as during operation with stroke lengths of 0.25 m and 0.3 m, under a trigger threshold of 50 kN for the SAGD. Fig. 14 presents the time history curve of the end support reaction. According to these figures, in the absence of SAGD, the conductor galloping amplitude stabilizes after 96 seconds of loading, achieving a maximum amplitude of 6.15 m and a maximum support reaction force of 67.69 kN. When the SAGD, with a threshold of 50 kN, is installed and operated with stroke lengths of 0.25 m and 0.3 m, the vertical displacement amplitudes at the center of the span decrease by 53.11 % and 57.51 %, respectively, within 5 seconds after activation. The end support reactions decrease by 23.22 % and 25.22 %, respectively. These results demonstrate that the installation of the SAGD significantly reduces both the amplitude of conductor galloping at the center of the span and the support reactions at the strain tower. However, due to the continuous influence of wind load, the conductor galloping remains disturbed but does not cease.
Fig. 13Response of vertical displacement of conductor midpoint of different motion strokes
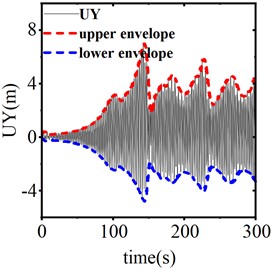
a) Device inactive
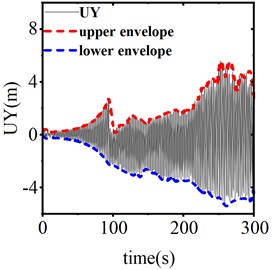
b) Motion stroke 0.25m
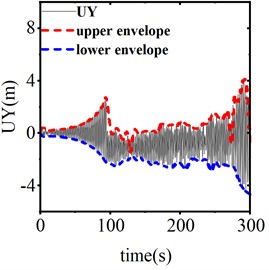
c) Motion stroke 0.3 m
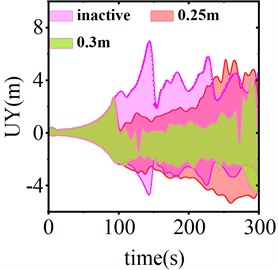
d) Comparison of different strokes
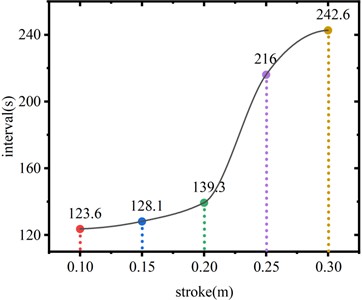
Due to the nonlinear characteristics of the transmission line, the suppression effect on conductor galloping is also nonlinear. The SAGD dissipates energy and inhibits galloping through multiple movements. To further evaluate the anti-galloping performance of the SAGD, the time interval of these movements is proposed as a performance evaluation index. A short operational interval may cause excessive heating of the device, affecting its service life. Therefore, it is essential to maximize the operational interval while maintaining a limited operation stroke. In simulating the initial action of the device, this study identifies the time node when the tension at the system’s hanging point reaches the threshold for the second time as the second action time. The two identified time nodes are then compared to determine the first and second action intervals for different stroke lengths, as illustrated in Fig. 15.
As shown in the figure, when the motion stroke is 0.2 m, the interval time between the first and second movements of the system is 43.3 s. When the stroke length is increased to 0.25 m, the interval time rises to 120.0 s, representing an increase of 177.14 % compared to the 0.2 m stroke. Furthermore, with a stroke length of 0.3 m, the interval time increases to 146.6 s, which is 22.17 % greater than the interval for a 0.25 m stroke. This indicates that when the motion stroke is less than 0.2 m, the device’s motion suppression effect is weak, resulting in negligible improvements in interval time. Conversely, when the motion stroke exceeds 0.2 m, the motion suppression effect of the device shows significant enhancement. Given the challenges in increasing the travel of the reset spring during the device’s design and manufacturing processes, a stroke length of 0.25 m is optimal for suppressing galloping.
Fig. 14Time history curve of end reaction for different motion strokes
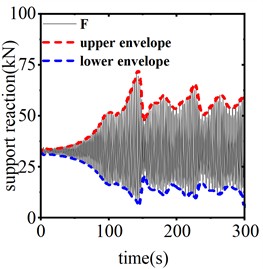
a) Device inactive
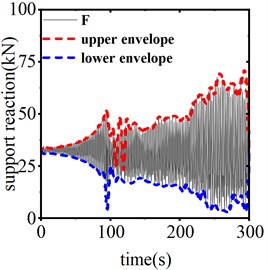
b) Motion stroke 0.25 m
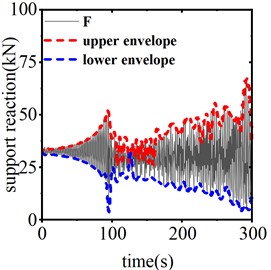
c) Motion stroke 0.3 m
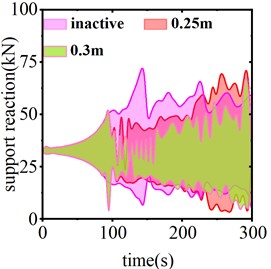
d) Comparison of different strokes
Fig. 15The interval between the first and second movements of the device
6. Influence of the threshold
The trigger threshold of the SAGD plays a crucial role in suppressing conductor galloping. Fig. 16 illustrates the vertical displacement response from the center of the span when the SAGD’s stroke is set at 0.25 m and the thresholds are 40 kN, 45 kN, and 50 kN, respectively. Fig. 17 presents the time-history curve of the end-support reaction of the system for device thresholds of 40 kN, 45 kN, and 50 kN. As shown in the figures, when using the SAGD with a stroke of 0.25 m and threshold values of 40 kN, 45 kN, and 50 kN, the interval times for the first and second operations of the system are 30.3 s, 37.8 s, and 120.0 s, respectively. Among these, the device with a threshold of 50 kN demonstrates the most effective galloping inhibition. Considering that the static tension of the ice-covered wire reaches 32.40 kN, the galloping amplitude of the test wire stabilizes when the horizontal tension is approximately 50 kN. It becomes challenging to distinguish the galloping state of the conductor when selecting SAGD with a lower threshold. Concurrently, the rated tensile strength (RTS) of LGJ-240/30 is 75,620 N, and the 50 kN threshold accounts for 66.12 % of the RTS, which ensures safe operation of the system. When the threshold exceeds 50 kN and continues to rise, the line’s factor of safety will be markedly reduced. Therefore, setting the trigger threshold of the device at 50 kN is justified in this paper.
Fig. 16The vertical displacement response of conductor midpoint at different operating thresholds
a) 40 kN
b) 45 kN
c) 50 kN
Fig. 17The system end support reaction of different action thresholds
a) 40 kN
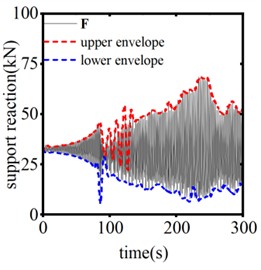
b) 45 kN
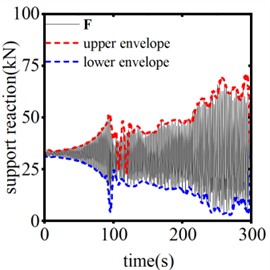
c) 50 kN
7. Conclusions
This paper introduces a novel self-adaptive anti-galloping device (SAGD) for mitigating overhead transmission line galloping. A finite element model simulates galloping dynamics over time. Device efficacy was evaluated through oscillation amplitudes and strain tower reaction forces. The following conclusions are listed:
1) The SAGD reduces the galloping displacements, significantly lowering end-support reaction forces, and greatly decreases attenuation duration
2) Anti-galloping performance improves with increasing motion stroke. Strokes below 0.2 m produce minimal effect, while those exceeding 0.2 m markedly enhance performance.
3) Optimal suppression requires precise SAGD threshold calibration. A 50 kN threshold effectively suppresses galloping while accurately detecting conductor galloping states, avoiding insufficient protection (threshold too high) or missed detection (threshold too low).
References
-
J. Si, X. Rui, B. Liu, L. Zhou, and S. Liu, “Study on a new combined anti-galloping device for UHV overhead transmission lines,” IEEE Transactions on Power Delivery, Vol. 34, No. 6, pp. 2070–2078, Dec. 2019, https://doi.org/10.1109/tpwrd.2019.2911894
-
J. Si, X. Rui, L. Bin, L. Zhou, and S. Liu, “Development of a wind spoiler anti-galloping device for bundle conductors of UHV overhead transmission lines,” IEEE Transactions on Power Delivery, Vol. 35, No. 3, pp. 1348–1356, Jun. 2020, https://doi.org/10.1109/tpwrd.2019.2943383
-
M. A. Baenziger, W. D. James, B. Wouters, and L. Li, “Dynamic loads on transmission line structures due to galloping conductors,” IEEE Transactions on Power Delivery, Vol. 9, No. 1, pp. 40–49, Jan. 1994, https://doi.org/10.1109/61.277678
-
W.-Q. Jiang, Y.-P. Liu, S.-L. Chan, and Z.-Q. Wang, “Direct analysis of an ultrahigh-voltage lattice transmission tower considering joint effects,” Journal of Structural Engineering, Vol. 143, No. 5, May 2017, https://doi.org/10.1061/(asce)st.1943-541x.0001736
-
S. Kurokawa, J. Pissolatofilho, M. C. Tavares, C. M. Portela, and A. J. Prado, “Behavior of overhead transmission line parameters on the presence of ground wires,” IEEE Transactions on Power Delivery, Vol. 20, No. 2, pp. 1669–1676, Apr. 2005, https://doi.org/10.1109/tpwrd.2004.833916
-
Y. Liu, B. Wang, X. Zheng, D. Lu, M. Fu, and N. Tai, “Fault location algorithm for non-homogeneous transmission lines considering line asymmetry,” IEEE Transactions on Power Delivery, Vol. 35, No. 5, pp. 2425–2437, Oct. 2020, https://doi.org/10.1109/tpwrd.2020.2968191
-
Q. Zhang, N. Popplewell, and A. H. Shah, “Galloping of bundle conductor,” Journal of Sound and Vibration, Vol. 234, No. 1, pp. 115–134, Jun. 2000, https://doi.org/10.1006/jsvi.1999.2858
-
D. P. Mishra and P. Ray, “Fault detection, location and classification of a transmission line,” Neural Computing and Applications, Vol. 30, No. 5, pp. 1377–1424, Dec. 2017, https://doi.org/10.1007/s00521-017-3295-y
-
N. Prasad Rao, G. M. Samuel Knight, S. J. Mohan, and N. Lakshmanan, “Studies on failure of transmission line towers in testing,” Engineering Structures, Vol. 35, pp. 55–70, Feb. 2012, https://doi.org/10.1016/j.engstruct.2011.10.017
-
X. Yan, B. Li, and Y. He, “Research on the anti-galloping of transmission lines based on the influence of impact load,” (in Chinese), Computer Simulation, Vol. 35, No. 12, pp. 77–80, Dec. 2018.
-
C. Huang, W. Lou, and H. Xu, “Research on parameter analysis and design of transmission line anti-galloping damper system,” (in Chinese), Engineering Mechanics, Vol. 39, No. 12, pp. 87–97, Dec. 2022.
-
M. Lu, Y. Ren, and L. Xiang, “Simulation of phase-to-ground spacer for anti-galloping of 500 kV horizontal arranged transmission lines,” (in Chinese), High Voltage Engineering, Vol. 43, No. 7, pp. 2349–2354, Jul. 2017.
-
Y. Eguchi, Y. Okazaki, H. Matsumiya, and S. Sugimoto, “Observational validation of a numerical model to simulate snow accretion on a transmission line conductor with moment of inertia and torsion compliance,” Cold Regions Science and Technology, Vol. 228, p. 104309, Dec. 2024, https://doi.org/10.1016/j.coldregions.2024.104309
-
Q. Chen, T. Liu, Z. Wang, and R. Miao, “Research on monitoring method for ice-covered state of transmission lines based on conductor end displacement,” Electric Power Systems Research, Vol. 236, p. 110918, Nov. 2024, https://doi.org/10.1016/j.epsr.2024.110918
-
M. Y. Xiao, W. X. Zhou, G. Bitsuamlak, and H. P. Hong, “Fragility of transmission tower-line system subjected to concurrent wind and ice accretion,” Journal of Constructional Steel Research, Vol. 222, p. 108925, Nov. 2024, https://doi.org/10.1016/j.jcsr.2024.108925
-
X. Meng, L. Tian, J. Liu, and Q. Jin, “Framework for assessing the performance of overhead transmission lines under wind-temperature effects,” Journal of Constructional Steel Research, Vol. 220, p. 108838, Sep. 2024, https://doi.org/10.1016/j.jcsr.2024.108838
-
S. Yang, L. Chouinard, S. Langlois, P. van Dyke, and J. Paradis, “Predicting distribution of aeolian vibration amplitude of undamped overhead transmission lines,” Journal of Wind Engineering and Industrial Aerodynamics, Vol. 250, p. 105779, Jul. 2024, https://doi.org/10.1016/j.jweia.2024.105779
-
Y. Liu, P. Zhao, J. Xu, X. Meng, H. Yang, and B. He, “Paradigm of numerical simulation of spatial wind field for disaster prevention of transmission tower lines,” Structural Durability and Health Monitoring, Vol. 17, No. 6, pp. 521–539, Jan. 2023, https://doi.org/10.32604/sdhm.2023.029850
-
H. Zhu, C. Liu, Y. Zhang, Z. Han, and S. Pan, “Analysis of short-circuit electrodynamic vibration response of triangularly arranged iced transmission lines based on finite element method,” Structures, Vol. 57, p. 105258, Nov. 2023, https://doi.org/10.1016/j.istruc.2023.105258
-
F. Xu, D. Li, P. Gao, W. Zang, Z. Duan, and J. Ou, “Numerical simulation of two-dimensional transmission line icing and analysis of factors that influence icing,” Journal of Fluids and Structures, Vol. 118, p. 103858, Apr. 2023, https://doi.org/10.1016/j.jfluidstructs.2023.103858
-
L. Tian, M. Yang, S. Liu, J. Liu, G. Gao, and Z. Yang, “Collapse failure analysis and fragility analysis of a transmission tower-line system subjected to the multidimensional ground motion of different input directions,” Structures, Vol. 48, pp. 1018–1028, Feb. 2023, https://doi.org/10.1016/j.istruc.2023.01.042
-
X. Han, H. Wu, and S. Guo, “Analysis of interaction mechanism between icing and torsion of single transmission lines,” (in Chinese), Transactions of China Electrotechnical Society, Vol. 37, No. 17, pp. 4508–4516, 2022.
-
K. Chen, R. Bian, and X. Bao, “Study on wind-induced swing state equation and critical wind speed of jump lines in mountainous areas,” (in Chinese), Journal of Harbin Institute of Technology, Vol. 56, No. 3, pp. 164–170, 2024.
-
J. Li, W. Wang, and X. Fu, “Failure probability analysis of transmission towers under ice-wind interaction,” (in Chinese), Journal of Vibration and Shock, Vol. 43, No. 3, pp. 136–146, 2024.
-
W. Lou, Y. Zhang, and H. Xu, “Dynamic tension following ice shedding and parameters’ influence analysis of transmission conductor considering the coupling effect of ice and wind,” (in Chinese), High Voltage Engineering, Vol. 48, No. 3, pp. 1052–1059, 2022.
-
Y. Deng et al., “Multimodal analysis of saddle micro-terrain prone to wind disasters on overhead transmission lines,” Electric Power Systems Research, Vol. 229, p. 110143, Apr. 2024, https://doi.org/10.1016/j.epsr.2024.110143
-
H. Zhu, C. Liu, Z. Han, W. Chen, and Y. Zhang, “Vibration response analysis of iced transmission line under short-circuit alternating electrodynamic force,” Electric Power Systems Research, Vol. 223, p. 109687, Oct. 2023, https://doi.org/10.1016/j.epsr.2023.109687
-
G. Huang et al., “Risk assessment models of power transmission lines undergoing heavy ice at mountain zones based on numerical model and machine learning,” Journal of Cleaner Production, Vol. 415, p. 137623, Aug. 2023, https://doi.org/10.1016/j.jclepro.2023.137623
-
N. P. Rao, R. P. Rokade, R. Balagopal, and G. S. Palani, “Segmental instability failures in transmission line towers,” Journal of Constructional Steel Research, Vol. 211, p. 108195, Dec. 2023, https://doi.org/10.1016/j.jcsr.2023.108195
-
H. Matsumiya, H. Matsushima, T. Aso, T. Nishihara, and S. Sugimoto, “Field observations of wet snow accretion on overhead transmission lines at the Kushiro test line,” Cold Regions Science and Technology, Vol. 213, p. 103905, Sep. 2023, https://doi.org/10.1016/j.coldregions.2023.103905
-
V. N. Ogar, S. Hussain, and K. A. A. Gamage, “The use of artificial neural network for low latency of fault detection and localisation in transmission line,” Heliyon, Vol. 9, No. 2, p. e13376, Feb. 2023, https://doi.org/10.1016/j.heliyon.2023.e13376
-
A. M. Ebid, M. Y. Abdel-Kader, I. M. Mahdi, and I. Abdel-Rasheed, “Ant colony optimization based algorithm to determine the optimum route for overhead power transmission lines,” Ain Shams Engineering Journal, Vol. 15, No. 1, p. 102344, Jan. 2024, https://doi.org/10.1016/j.asej.2023.102344
-
Y. M. Desai, P. Yu, N. Popplewell, and A. H. Shah, “Finite element modelling of transmission line galloping,” Computers and Structures, Vol. 57, No. 3, pp. 407–420, Nov. 1995, https://doi.org/10.1016/0045-7949(94)00630-l
-
W. Lou, J. Yu, H. Xu, and X. Jiang, “Wind tunnel test and critical wind speed study for galloping of 6-bundled iced conductors,” (in Chinese), Journal of Vibration Engineering, Vol. 30, No. 2, pp. 280–289, 2017.
About this article

The authors are grateful for the State grid Hebei Electric Power Co., LTD. Science and technology project (kj2023-057).
The datasets generated during and/or analyzed during the current study are available from the corresponding author on reasonable request.
Wenbin Li: investigation, methodology, experiment visualization, writing-original draft. Yong Wang: formal analysis, writing-review and editing. Yanting Feng: validation, writing-review and editing. Huidi Liu: validation, writing-review and editing. Wenqiang Jiang: conceptualization, visualization, supervision.
The authors declare that they have no conflict of interest.
