Abstract
The study aims to develop a model for optimizing the concentration of solution parameters in the dyeing process of polyacrylic yarns. Specifically, the study examines the use of cationic retaiders and acetic acid, which affect the wavelength as an indicator of yarn color aging. By optimizing these parameters, the objective is to improve the color stability and longevity of dyed polyacrylic yarns. The application of Response Surface Methodology (RSM) encompassed two distinct types of data distribution properties: linear and non-linear. The R-squared () value for the non-linear RSM model was 0.96, compared to 0.86 for the linear RSM model. These results indicate that the model formed based on the non-linear RSM offers superior predictive ability in optimizing solution concentration as a parameter in the polyacrylic yarn dyeing process compared to the linear RSM-based model. In addition to providing practical implications for textile practitioners, this study contributes theoretically by emphasizing the effectiveness of statistical methods such as RSM in manufacturing process analysis.
Highlights
- Increasing Quality of Dyeing Process
- Response Surface Methodology
- Model validation reached 96%
- Model can be use as experimental framework for dyeing process
- Statistical model
1. Introduction
Many industries, including the textile industry, are utilizing mathematical approaches nowadays [1-4]. In textile products, dyeing is one of the most important processes that may determine the quality [5-7]. The dyeing process for textile polyacrylic yarns requires optimizing the concentration of cationic retarders and acetic acid to achieve the desired wavelength, which is a measure of color aging [8-10]. A mathematical model can be used to design an effective and efficient experiment regarding the optimization of two solutions' concentrations.
This optimization was carried out as an experimental design because if the wavelength produced is too large, it will produce a color intensity that is too bright. If the resulting wavelength is too small, the dyed color on the yarn will not be absorbed optimally, resulting in color fading when the yarn is applied to the fabric [11-13]. Therefore, it is necessary to develop a mathematical model that can optimize the wavelength based on the combined concentration of the two solutions to ensure the dyeing process is effective and efficient. The proposed mathematical model is the Response Surface Methodology (RSM) model. RSM is statistical modeling for designing experiments, understanding how independent and dependent variables relate, and optimizing experiments based on the number of experiments needed [14-16]. This study utilized the RSM model by exploring the possible nature of the relationship between the variables involved. The RSM model was validated by comparing it with actual data to determine its accuracy in making predictions.
As the coefficient of determination method shows, the RSM model maps the relationship between input and output variables by comparing the variation explained by the model to the variation in the data itself [17-19]. R-squared measures how much of the variation in the response can be explained by the model compared to the total variation. The higher the -squared value, the better the RSM model is at explaining variation in the data [19].
Therefore, this study aims to design an experimental framework to find the optimal concentration of cationic retarders and acetic acid to achieve the desired wavelength for the yarn color aging test based on the description above. To support this objective, the study utilised secondary data obtained from a previously published experiment by [20], which explored the effects of cationic retarders and acetic acid concentrations in polyacrylic yarn dyeing. This dataset was selected because it comprehensively captures the relevant variables and experimental conditions necessary for RSM modelling. Its reliability and suitability enabled the development of an accurate mathematical model without the need for new experimental procedures, while still ensuring scientific validity and practical relevance. This model optimizes the yarn dyeing process using cationic retarders and acetic acid for the first time. Its novelty brings great expectations, especially for the textile industry, which utilizes this process as one of its major processes. Through this research, it is hoped that the effectiveness and efficiency of yarn dyeing can be improved, as well as a deeper understanding of the textile field and its applications can be gained.
2. Method
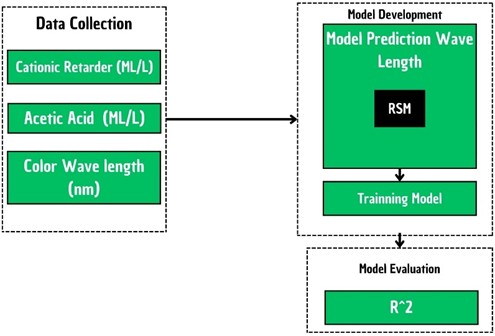
The research uses response surface methodology to construct models. However, to produce an in-depth analysis, this study employs three major steps as a research methodology. According to Fig. 1, there are three steps in the research design: (1) data collection, (2) model development, and (3) model evaluation.
Fig. 1Research framework
Two variables are dependent on this study and one variable is independent of it. Two dependent variables are the concentration of cationic retardant and the concentration of acetic acid, both of which affect one independent variable, the wavelength, which determines the color aging of the yarn. As shown in Table 1, the optimization model was based on a number of factors.
Table 1Data specification
Construct | Attribute | Function |
Wavelength | Nanometer | Dependent variable |
Concertation of catonic retarder | ML/L | Independent variable |
Concertation of acetic acid | ML/L |
3. Result and discussion
3.1. Data collecting
Data from an article [20] discussing cationic retarders and acetic acid solution concentrations for polyacrylic yarn dyeing applications was collected for the research. This study used the following data in Table 2. While the use of secondary data provides access to detailed experimental results, it also presents potential limitations, including unknown variations in experimental conditions or measurement accuracy in the original study. To address these concerns, model validation was conducted through comparison with actual observed values, using statistical measures such as R-squared to assess predictive accuracy. This approach ensures that despite the data's secondary nature, the developed model remains robust and scientifically valid.
Table 2Data research
Cationic retarder concentration (Ml/L) | Acetic acid concentration (ML/L) | Wavelength (nanometer) |
0.5 | 0.5 | 11.46 |
1 | 8.18 | |
1.5 | 10.49 | |
2 | 11.39 | |
1 | 0.5 | 4.52 |
1 | 5.18 | |
1.5 | 4.41 | |
2 | 6.01 | |
1.5 | 0.5 | 2.11 |
1 | 2.12 | |
1.5 | 2.59 | |
2 | 2.72 | |
2 | 0.5 | 2.10 |
1 | 2.09 | |
1.5 | 1.87 | |
2 | 1.80 |
3.2. Model development
3.2.1. Response surface methodology (linear approach)
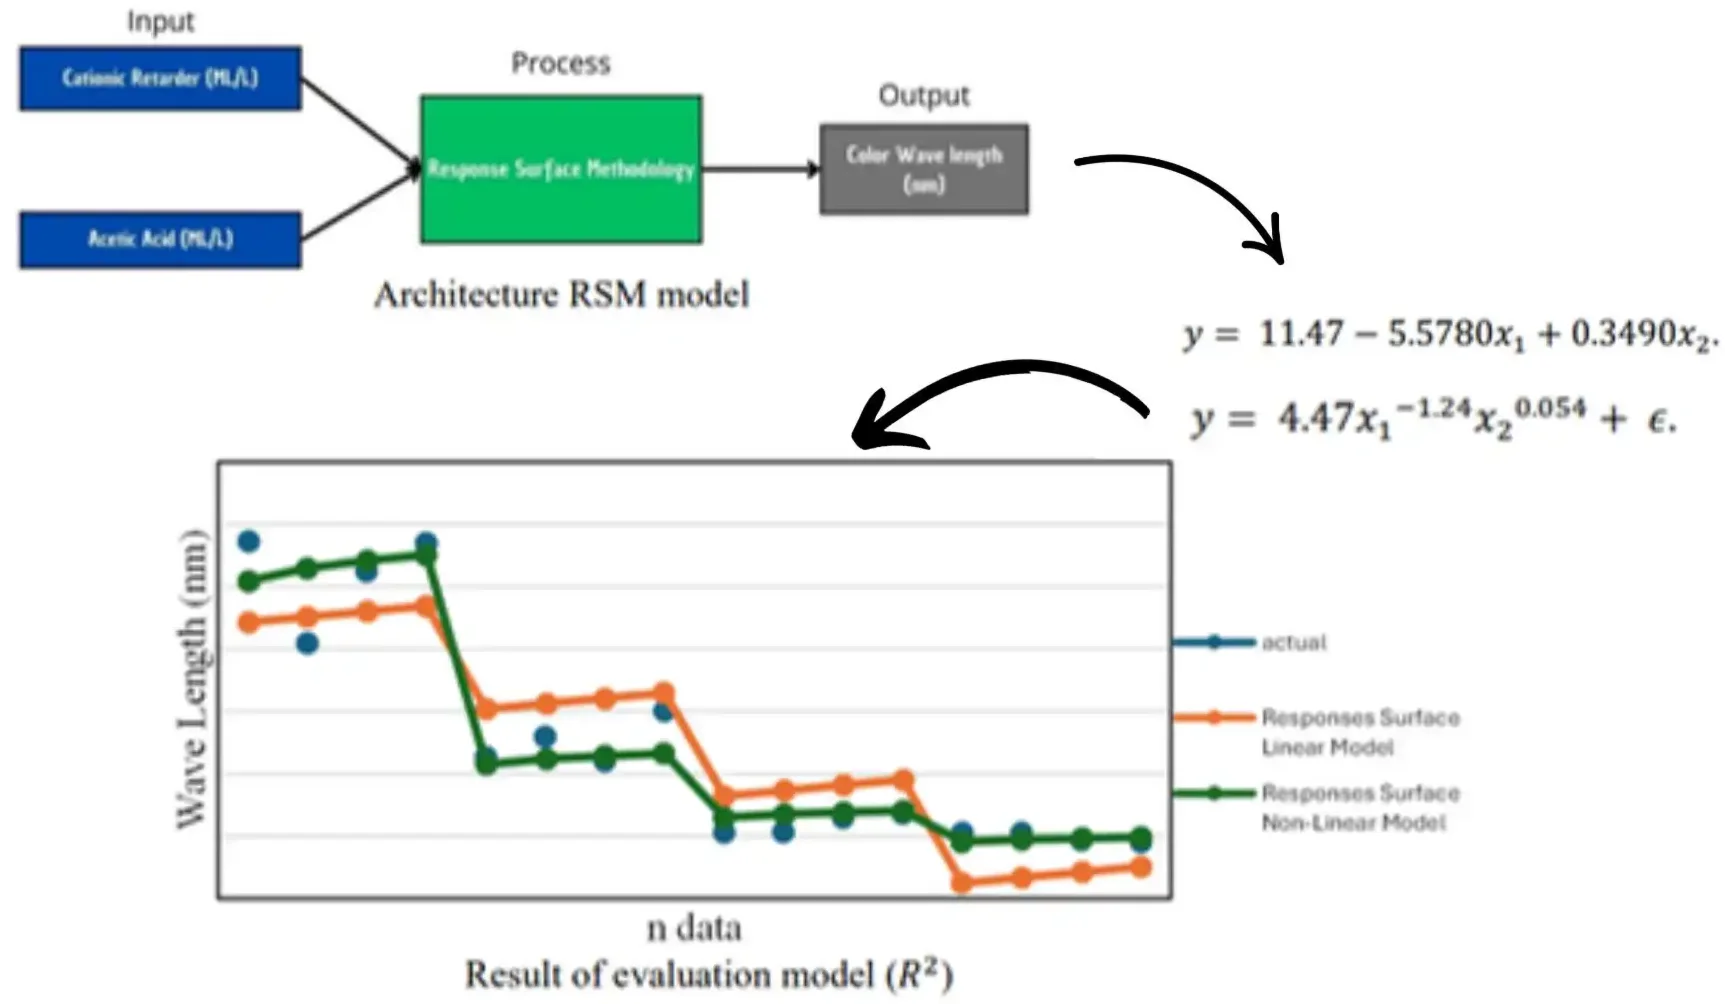
The Response Surface Methodology (RSM) linear model used in this study was developed based on two independent variables: the concentration of cationic retarders () and the concentration of acetic acid (), both measured in mL/L. These variables influence color aging, represented by the wavelength () in nanometers (nm). The RSM linear model is represented by the following equation:
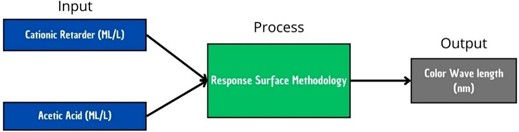
The independent variables are , . is the regression model constant, is the regression model constant for , is the regression model constant for , and is the regression model error. RSM model architecture is shown in Fig. 2.
Fig. 2Architecture RSM model
To obtain the value of Eq. (1), it can be determined by modeling it as illustrated in Eqs. (2) and (3):
The difference between the experimental data, () and () model model is defined as the error , which is as follows:
Eqs. (4) and (5) we used to find a for model:
with:
Eq. (5) can be utilized to solve the linear equation formed by Eq (1), resulting in the formulation presented in Eqs. (6) to (9) as follows
Eq. (6) can be converted into matrix form as in Eq. (7):
The values , , in Eq. (6) are derived using the parameter optimization method described in Eq. (8). The optimization method employs the Least Squares approach to determine the values of (), which involves solving the partial derivative of the error function concerning () to find the minimum point:
Then, Eq. (9) is derived to assess the wavelength color aging results, as follows:
Once the values of , , dan have been determined, Eq. (9) can be utilized for prediction calculations to demonstrated in Table 3.
Table 3Result RSM linear approach
Wavelength color aging prediction | Wavelength color aging actual |
8.8618 | 11.46 |
9.0363 | 8.18 |
9.2108 | 10.49 |
9.3853 | 11.39 |
6.0728 | 4.52 |
6.2473 | 5.18 |
6.4218 | 4.41 |
6.5963 | 6.01 |
3.2838 | 2.11 |
3.4583 | 2.12 |
3.2.2. Response surface methodology (non- linear approach)
In this study, the RSM model non linear multiple regression is built around two independent variables: cationic retarder concentration () and acetic acid concentration (), both of which influence color aging in terms of wavelength (). The fundamental equation of RSM model multiple regression is given as follows:
To obtain the value of Eq. (10), it can be determined by modeling it as illustrated in Eqs. (11) and (12):
Eqs. (13 and 14) we used to find a for model:
Eq. (14) can be utilized to solve the nonlinear equation formed by Eq (10), resulting in the formulation presented in Eqs. (15) to (22) as follows:
The value of in Eq. (19) are obtained through the parameter optimization method, as in Eq. (20):
In Eq. (20c), represents , represents , and () represents . Therefore, to obtain the value of , we utilize the exponential result of () Eq. (21):
Then, Eq. (21) is derived to assess the wavelength color aging results, as follows:
Once the values of , , and , have been determined, Eq. (22) can be utilized for prediction calculations to assess the quality of fabric cutting, as demonstrated in Table 4.
Table 4Result iteration non-linear model
Wavelength color aging prediction | Wavelength color aging actual |
10.59 | 11.46 |
10.84 | 8.18 |
11.02 | 10.49 |
10.18 | 11.39 |
4.47 | 4.52 |
4.58 | 5.18 |
4.65 | 4.41 |
4.30 | 6.01 |
2.70 | 2.11 |
2.76 | 2.12 |
3.3. Model evaluation
The coefficient of determination, commonly referred to as R-squared or , is a metric used in statistics to evaluate how well a theoretical model fits the actual observed data. In this context, R2 measures how much variation in the dependent variable can be explained by the independent variables contained in the model. A value of ranges between 0 and 1. A value of 1 indicates that. The model perfectly explains the variation in the data, while a value of 0 indicates that the model explains no variation at all and is just random error. Eqs. (23) and (24) shown the calculations of the two models formed.
Coefficient of determination model RSM linear:
Interpretation of the value from the ANNs model suggests that the constructed model can explain 86 % of the total variability in the dependent variable. According to reference Toutenburg & Shalabh (2016), this value indicates a relatively strong determinant as it accounts for half of the variance in the dependent variable overall.
Coefficient of Determination Model RSM Non-Linear:
The interpretation of the value for the RSM model suggests that the model can explain 96 % of the total variability in the dependent variable based on the variation in the independent variables. According to reference (Toutenburg & Shalabh, 2016), this value indicates an exceptionally strong determinant, nearing perfection, as it accounts for almost the entire variance of the dependent variable in the dataset.
3.4. Analyze evaluation result
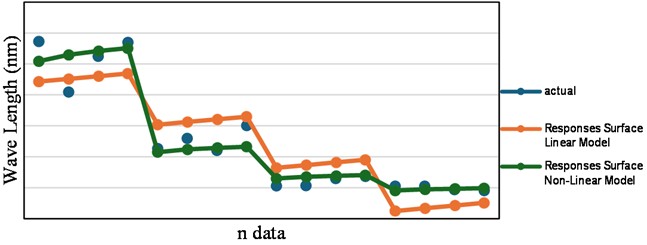
The method evaluated both RSM models for their ability to optimize the dyeing process by utilizing two cationic retardant solutions and acetic acid that affect color Aging. The non-linear RSM model showed superiority in optimizing the dyeing process as it had a higher value of 96 % compared to the linear RSM model of 86 % in explaining variance. The non-linear RSM model is very effective for optimizing the dyeing process, especially when predicting yarn color aging against cationic retardants and acetic acid concentration. The non-linear RSM model can explain 96 % of the variance of the dyeing process. According to Fig. 3, the non-linear RSM model explains 96 % of the data variance with a data distribution similar to the actual data.
The prediction difference of approximately 0.87 nm, although numerically small, is practically significant in the textile dyeing process. For example, when the actual measured wavelength was 11.46 nm, the linear model predicted only 8.8618 nm, resulting in a discrepancy of 2.5982 nm. In contrast, the non-linear model provided a predicted value of 10.59 nm, reducing the prediction error to just 0.87 nm. Even such minor deviations in wavelength can result in perceptible changes in fabric colour intensity or shade, potentially leading to quality control rejections or inconsistencies across production batches. In high-precision industrial applications, such as those involving brand-specific colour standards, maintaining wavelength accuracy within narrow tolerances is essential. This highlights the industrial value of the non-linear RSM model, not only in terms of statistical performance but also in its practical ability to support consistent production quality. Therefore, the improved predictive performance of the non-linear model offers a more reliable foundation for dyeing process optimisation in real-world scenarios.
Fig. 3Result of evaluation model (R2)
4. Conclusions
The objective of this study was to develop and formulate a model to optimize polyacrylate dyeing process parameters with cationic retarders and acetic acid concentrations that affect color wavelength, a measure of yarn color aging. With an value of 0.96, the model built using Response Surface Methodology (RSM) based on non-linear characteristics showed high accuracy. Models based on the linear-based RSM also showed good determination for optimizing polyacrylate yarn dyeing parameters with an value of 0.86. As a result, this value is relatively lower than that of the non-linear RSM model.
Therefore, the evaluation results show that the non-linear RSM-based model is proposed to optimize the concentration of cationic retarders and acetic acid to provide the optimal composition that can influence the wavelength as an indicator of color aging in dyed yarns as desired. The findings of this study have practical implications, especially for professionals in the textile industry, as a model that can optimize the dyeing process parameters, thereby achieving maximum dyeing results.
The prediction difference of approximately 0.87 nm, such as the deviation between the actual wavelength of 11.46 nm and the non-linear model prediction of 10.59 nm, is considered practically significant. In the textile dyeing industry, even such small deviations in wavelength can cause perceptible differences in color intensity or shade, which could lead to inconsistencies across batches or failure to meet brand-specific color standards. Thus, the improved predictive performance of the non-linear model makes it more suitable for real-world applications where precision in color matching is essential.
With the remarkable accuracy of the non-linear RSM model and minimal error rate, this study highlights the effectiveness of statistical approaches such as RSM in analyzing and optimizing manufacturing processes. This research provides suggestions for future research where there is still room for improvement, especially in providing parameter optimization by adding various uncertain variables as factors to be optimized, such as temperature, fixation time, or material types, to improve model robustness and applicability across broader industrial conditions.
References
-
R. M. El-Taweel et al., “A review of coagulation explaining its definition, mechanism, coagulant types, and optimization models; RSM, and ANN,” Current Research in Green and Sustainable Chemistry, Vol. 6, p. 100358, Jan. 2023, https://doi.org/10.1016/j.crgsc.2023.100358
-
R. Yin, X. M. Tao, and B. G. Xu, “Mathematical modeling of yarn dynamics in a generalized twisting system,” Scientific Reports, Vol. 6, No. 1, pp. 1–13, Apr. 2016, https://doi.org/10.1038/srep24432
-
V. G. V. Putra, M. F. Rosyid, and G. Maruto, “New theoretical modeling for predicting yarn angle on OE yarn influenced by fibre movement on torus coordinate based on classical mechanics approach,” Indian Journal of Fibre and Textile Research, Vol. 42, No. 3, pp. 359–363, 2017.
-
V. G. V. Putra and J. N. Mohamad, “A novel model for predicting tenacity and unevenness of ring-spun yarn: a special case in textile engineering,” Mathematical Models in Engineering, Vol. 9, No. 3, pp. 102–112, Sep. 2023, https://doi.org/10.21595/mme.2023.23406
-
D. B. Dilden, M. F. Yüksel, S. Keskin, U. Ergünay, and R. Atav, “Determination of the effect of dyeing and finishing processes on physical, mechanical, handle, comfort and functional properties of cotton knitted fabrics,” Orclever Proceedings of Research and Development, Vol. 1, No. 1, pp. 167–177, Dec. 2022, https://doi.org/10.56038/oprd.v1i1.173
-
L. Lara, I. Cabral, and J. Cunha, “Ecological approaches to textile dyeing: a review,” Sustainability, Vol. 14, No. 14, p. 8353, Jul. 2022, https://doi.org/10.3390/su14148353
-
D. A. Yaseen and M. Scholz, “Textile dye wastewater characteristics and constituents of synthetic effluents: a critical review,” International Journal of Environmental Science and Technology, Vol. 16, No. 2, pp. 1193–1226, Nov. 2018, https://doi.org/10.1007/s13762-018-2130-z
-
M. S. Hossain, M. M. Islam, S. C. Dey, and N. Hasan, “An approach to improve the pilling resistance properties of three thread polyester cotton blended fleece fabric,” Heliyon, Vol. 7, No. 4, p. e06921, Apr. 2021, https://doi.org/10.1016/j.heliyon.2021.e06921
-
C. D. Radu, I. Sandu, R. Diaconescu, E. Bercu, and H. A. Aldea, “Statistic modelling and optimization of the dyeing process of Melana fibres with Victoria Blue B dye in the presence of anionic retarders,” Revista de Chimie, Vol. 65, No. 7, pp. 797–802, Jul. 2014.
-
Rahul Ranjan Ghosh, Y. C. Radhalakshmi, Lakshmikantha N., and S. Periyasamy, “Investigation of the fastness properties and color strength of dry and wet reeled Tasar silk yarns,” International Journal of Science and Research Archive, Vol. 11, No. 2, pp. 1275–1286, Apr. 2024, https://doi.org/10.30574/ijsra.2024.11.2.0585
-
W. Anam et al., “Influence of Yarn manufacturing techniques on dyeing behavior of polyester/cotton blended woven fabrics,” Fibers and Polymers, Vol. 20, No. 12, pp. 2550–2555, Dec. 2019, https://doi.org/10.1007/s12221-019-9152-0
-
A. A. Pérez, T. I. Poznyak, and J. I. Chairez, “Effect of the interaction between dye and acetic acid on the decomposition of Basic Green 4 with additive by ozone,” Journal of Environmental Science and Health, Part A, Vol. 49, No. 1, pp. 18–26, Jan. 2014, https://doi.org/10.1080/10934529.2013.824222
-
H. Xiao and T. Zhao, “One-bath union dyeing of wool/acrylic blend fabric with cationic reactive dyes based on azobenzene,” Fibers and Polymers, Vol. 19, No. 2, pp. 331–339, Mar. 2018, https://doi.org/10.1007/s12221-018-7312-7
-
S. D. A., “Response surface methodology-a statistical tool for the optimization of responses,” Global Journal of Addiction and Rehabilitation Medicine, Vol. 7, No. 1, pp. 1–7, May 2023, https://doi.org/10.19080/gjarm.2023.07.555705
-
Z. Halici and E. Demirhan, “Response surface methodology for optimizing adsorption process parameters for tadalafil removal by raw eggshell,” Biomass Conversion and Biorefinery, Vol. 15, No. 4, pp. 6027–6036, Feb. 2024, https://doi.org/10.1007/s13399-024-05380-0
-
A. H. Seikh, B. B. Mandal, A. Sarkar, M. Baig, N. Alharthi, and B. Alzahrani, “Application of response surface methodology for prediction and modeling of surface roughness in ball end milling of OFHC copper,” International Journal of Mechanical and Materials Engineering, Vol. 14, No. 1, Apr. 2019, https://doi.org/10.1186/s40712-019-0099-0
-
D. Chicco, M. J. Warrens, and G. Jurman, “The coefficient of determination R-squared is more informative than SMAPE, MAE, MAPE, MSE and RMSE in regression analysis evaluation,” PeerJ Computer Science, Vol. 7, p. e623, Jul. 2021, https://doi.org/10.7717/peerj-cs.623
-
H. Hikmatiar, I. Ishafit, and M. E. Wahyuni, “Determination the coefficient of restitution in object as temperature function in partially elastic collision using Phyphox application on smartphone,” Science and Technology Indonesia, Vol. 4, No. 4, p. 88, Oct. 2019, https://doi.org/10.26554/sti.2019.4.4.88-93
-
J. M. Sanchez, “The inadequate use of the determination coefficient in analytical calibrations: How other parameters can assess the goodness‐of‐fit more adequately,” Journal of Separation Science, Vol. 44, No. 24, pp. 4431–4441, Oct. 2021, https://doi.org/10.1002/jssc.202100555
-
K. Indirani, S. Martin Pradana, R. Wiwiek, and E. Mulyani, “The effect of concentration of acetic acid and cationic retarders on the dyeing process of polyacrylate yarn using basic dyes,” Texere, Vol. 20, No. 2, 2022, https://doi.org/https://ojstexere.stttekstil.ac.id/index.php/texere/article/view/115
About this article

The researchers would like to thank the entire academic community of Polytechnic Meta Industry Cikarang, Universitas Telkom, Universitas Insan Cendikia Mandiri, and Politeknik STTT Bandung for providing open public data to be analyzed in this study.
The datasets generated during and/or analyzed during the current study are available from the corresponding author on reasonable request.
Fadil Abdullah collected the data. Fadil Abdullah and Fandi Achmad worked on model development and calculations. Syarif Iskandar, Tina Martina, Kursawarti, and Afriani Kusumadewi develop conceptual research. Fadil Abdullah, Fandi Achmad and Afriani Kusumadewi wrote, and revised the manuscript.
The authors declare that they have no conflict of interest.
