Abstract
Testbeds are essential structures in industrial labs for conducting machine testing, where the geometry and material properties play a critical role. These tests often use rotating equipment, such as turbines and turbo-compressors (TC). In order to achieve the best possible conditions, testbeds are created using ANSYS Workbench, which incorporates four mechanical procedures: modal, static, harmonic, and transient analyses. Simulations are used to reproduce attributes such as natural frequency, safety factor, and the highest and lowest levels of mechanical stress. This paper describes a quick way to check if the structure of a turbo-compressor is vibrated, by looking at things like its natural frequency, safety factor, and maximum mechanical stress. This study covers unknown factors and uncertainties by analyzing the operational states of the compressor. To achieve this, a reliability structure model and engineering methods like modal analysis for controlling vibrations, structural analysis to ensure the rotor rotates steadily, transient structural analysis to determine the appropriate startup conditions, and harmonic response analysis to determine how speeds change over time, are used to prevent to natural frequencies from interacting with operational frequencies, finally, transient analysis demonstrates initial shock and vibrations that result maximum stress.
Highlights
- Simulation Method: Developed a full ANSYS simulation approach for turbo-compressors
- Testbed Design: Created and optimized a real-scale testbed structure
- Resonance Avoidance: Ensured natural frequencies avoid operational ones
- Stress Check: Evaluated stress levels and safety under load
- Startup Analysis: Analyzed transient effects during machine startup
1. Introduction
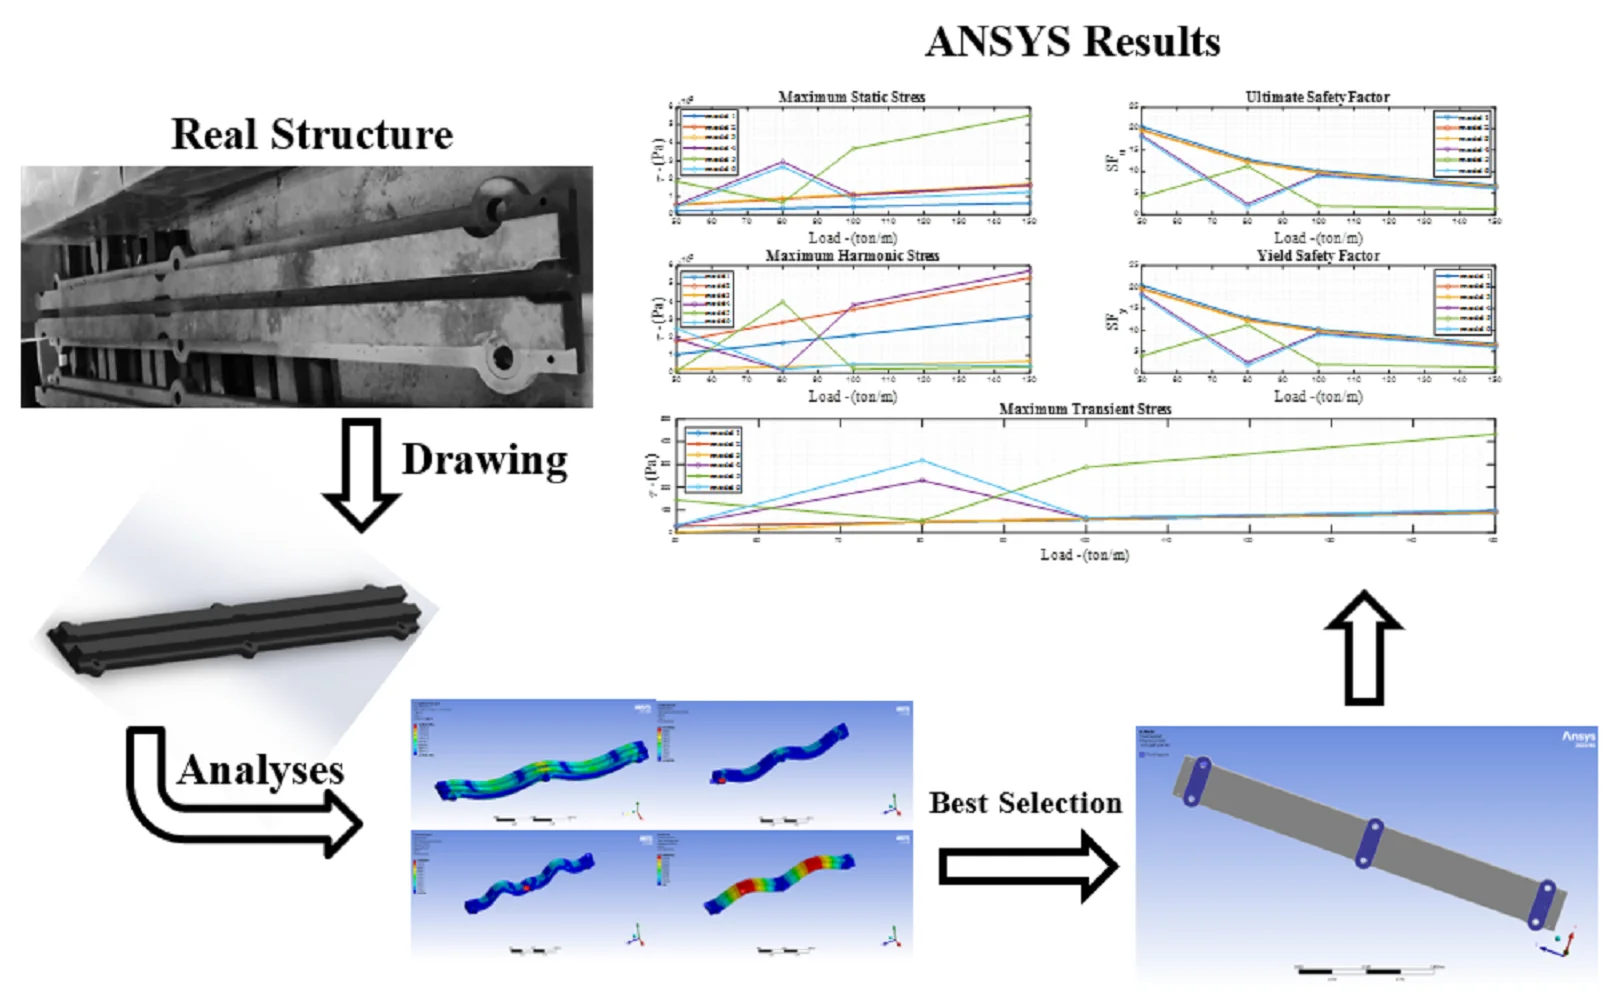
Testbeds (TB) handles environments in company labs for analyzing mechanical performance. Operation safety is paramount in design and testing, with factors like stiffness, mass, damping, and strength influencing structural design, stress, strain, and dependability in different subjects such as modal analysis [1] and crashworthiness [2, 3]. A thorough look at the changes that were made to a three-stage synthesis gas radial turbo-compressor so that it could work in new situations. It examines the scope of the upgrades, the methodology used, the results of the tests conducted, and the continued performance of the compressor since 2015 [4]. The high-pressure super turbo, a centrifugal compressor equipped with an integrated gear system, has undergone modifications to improve rotor stability and minimize vibrations and temperature rise for high-pressure applications [5]. Similarly, a review examined the progress of high-pressure carbon capture technology under different operating situations [6]. For example, the compressor prototype presented exceptional efficiency, no noise and minimum resonance by use of aerodynamic and structural optimization techniques including a combustion chamber designed within the gears [7, 8] or optimized geometry of space, location, or safety concerns with compressor [9]. In the same way, a gas turbine optimized its efficiency, fuel economy, and operational flexibility through the use of GasTurb and CMap software [10]. In addition, by utilizing artificial intelligence methods, the system monitors and maintains the rotating equipment to prevent industrial damage in induction motors, roller bearings [11], misalignment, magnetic bearing loading [12], specifically, examine humidity in an air energy storage system [13-15], or just performance in high pressure [16], to illustrate in a multistage compressor [17], to solve this problem with an active vibration damper improving efficiency [18]. Another condition monitoring focused on mistuning of impeller blades in real-life stages to avoid resonance [19], highlighting the relationship between IBC flow and AVDs by assessing static pressure and temperature by controlling vanned diffusers[20] these vanes impact on flow distortions [21], in surge in unstable flow conditions by monitoring pressure output [22] and stall margin is influenced of surface roughness [23], simultaneously surge and stall [24], noise level in centrifugal compressor [25], vibrations in bearing turbocharger of internal combustion engines [26], as an example, in variable such as speed drive for centrifugal compressor suggested to control by the quadratic V/F [27], utilized a micro-perforated panel absorber in output pipe in which a two-stage compressor to mitigate noise [28], pressure gradient and frequency of pulse indicate instability [29], and leakage flows in hub and shroud lead to less efficiency [30]. Statistically, used the Bayesian models tested for a rig was pulsated on blade tip [31], correlation between rotating stall pressure and blade vibration to reduce stall resonance [32], numerically optimized vibrational noise in centrifugal fan [33] and turbine volutes [34]. In specified model, assessed the performance of 280-mm-diameter tilting pad journal bearings used in turbo-machines in order to examine their static and dynamic characteristics, power loss, and dynamic coefficients under different operating situations [35]. In rotary system and fault diagnosis, there has been researched to control multivariable in gas turbine like fuel inlet and IGV parameters through optimal PID [36], other cases experimented unbalanced shaft and clearance of bearing by driven data in ANFIS and ANN-PSO, respectively [37, 38]. In current study analyze TB as a beam needs to investigate theoretically, early studies in vibrations of beam, presented the non-linear stiffness calculated cantilever in large amplitude vibrations, although linear theory of vibrations may not be valid for high amplitude vibrations [39], another case studied the spring-hinged beam [40], take an experiment by using pouch cells designed with finite element method (FEM) [41]. A study compared strain and stress in cylindrical shell membrane regions during pressure tests using HSLA 15CDV6 pressure vessels. Non-linear FEM results show similar strain as that of test along the hoop direction, and the values of strain and stress are increased due to the presence of profile variation [42] in the cylindrical shell. An article analyzed prismatic and non-prismatic tapered cantilever beams using large amplitude free vibrations. It presents massive deflection data and uses a polynomial function viewpoint to construct a nonlinear solution. The study reveals nonlinearity in the hardening type of prismatic and non-prismatic cantilever beams [43]. By reviewing optimal vibration control methods [44] by using piezoelectric sensor such as LQR-MOPSO [45, 46], Fuzzy-PID [47], and MOPSO-PID controllers [48], and in passive control, applying band-gap approach by use of quasi-zero stiffness as unit cells in different location [49]. This study uses ANSYS and SOLIDWORKS software to look into the best places to put augmented supports for testing turbo-compressor (TC) machines. The study focuses on the shape and material qualities of TB to ensure accurate test conditions. It goes into detail about four mechanical processes in the ANSYS Workbench, with a focus on safety, natural frequencies, and mechanical stress to make sure that TC models are reliable. The study’s goals are to look at and understand the main parts of an industrial TC, make real models of different types of industrial compressors, and find the best places to put support beams under the TC to test how well it works. The best algorithm takes into account experimental knowledge, the TBs of critical areas, and the TC's impact on work time. It is based on material strength, numerical methods, and trial and error methods.
2. Methodology
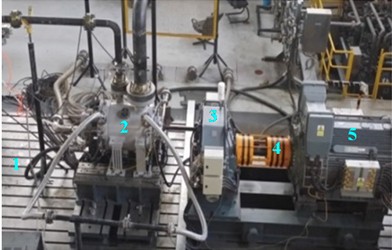
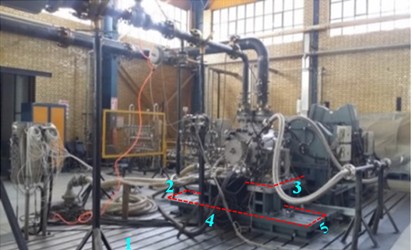
The TCs vary in size, shape, capability, and performance, but all of them consist of key components such as the shaft, gearbox, impeller, bearing, and motor, as shown in Fig. 1(a). TBs are used in various directions to secure the TC and prevent unwanted vibrations while the TC is fixed, as illustrated in Fig. 1(b).
Fig. 1Applications of testbeds in rotary machines: a) main parts of TC (1 – testbed, 2 – turbo-compressor, 3 – gearbox, 4 – shaft, 5 – motor), b) different TB under TC (1 – TB1, 2 – TB2, 3 – TB3, 4 – length, 5 –width)
a)
b)
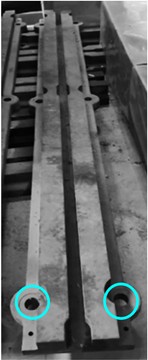
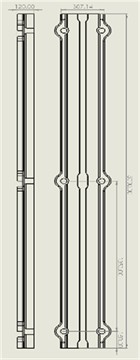
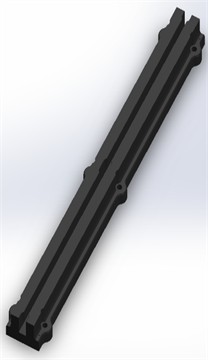
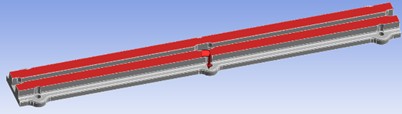
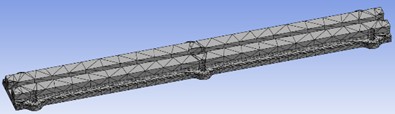
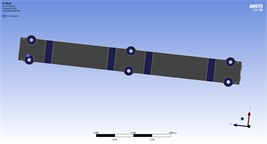
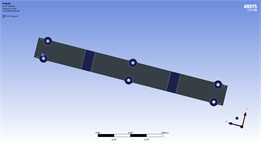
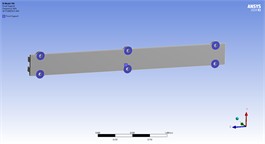
In Fig. 2, the TB is shown below as real, drawn, and 3D models. The size of the model was real-sized.
Fig. 2Testbed structure: a) manufactured models, b) dimensions, c) 3D design
a)
b)
c)
2.1. Euler-Bernoulli theory
Primarily, in actual circumstances, the TB is affixed to the ground using six holes and supported by bolts (cyan circles in Fig. 2(a)). Assuming a two-dimensional diagram, TB has combined two simply supported beams (ss-beams). Fig. 3 depicts a double-ss-beam with a point load positioned at its center.
Fig. 3Analogy model of the testbed to simply supported beam
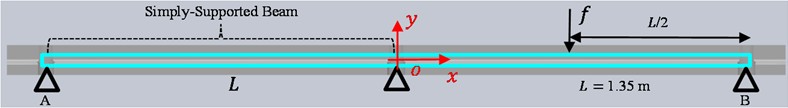
The Euler-Bernoulli theory is a key theorem used to analyze the mechanical behavior of beam structures. Therefore, in the Euler-Bernoulli beam theory, it is assumed that there is no shear stress in beam deflection. As a result, the displacement is denoted as and the bending moment is denoted as . The displacement of a simply supported beam, , is described as follows:
By putting the middle load of the beam (as shown in Fig. 3) into Eq. (2), that calculates the maximum deflection of the simply supported beam at the midpoint of the beam:
In order to assess Eqs. (1) and (2), it is necessary to consider the parameters listed in Table 2, which may be determined during the procedure. Fig. 4 depicts the cross-section of the TB structure, where the black region represents the actual cross-section, while the red rectangle area represents a simplified version used for calculating Eq. (3).
Table 1Material properties of the testbed
Parameters | Values | Parameters | Values |
1.2e11 Pa | Poisson ratio | 0.25 | |
446.91 kg.m2 | 675 KN | ||
450.91 kg.m2 | 108 KN | ||
450.49 kg.m2 | 135 KN | ||
7250 kg/m3 | 2025 KN |
It is important to know the safety factor (SF) when judging how reliable a planned model is. The SF is found by comparing the planned values to the experimental values as a ratio. An SF greater than 1 is considered acceptable by engineers, while an SF less than 1 means the model failed. The SF is shown in two formats: ultimate strength and yield strength:
Indices u and y define the ultimate and yield statements. They represent the tensile ultimate and/or yield strengths. Su and Sy are the maximum values of the and strengths, respectively. Furthermore, the quantity of or is derived using empirical standard testing. Additionally, based on the mechanical characteristics of the material considered in the test bed construction, the tensile ultimate strength is 600 MPa and the yield strength is 370 MPa.
Fig. 4Simplification cross-section of the testbed

2.2. Methodology
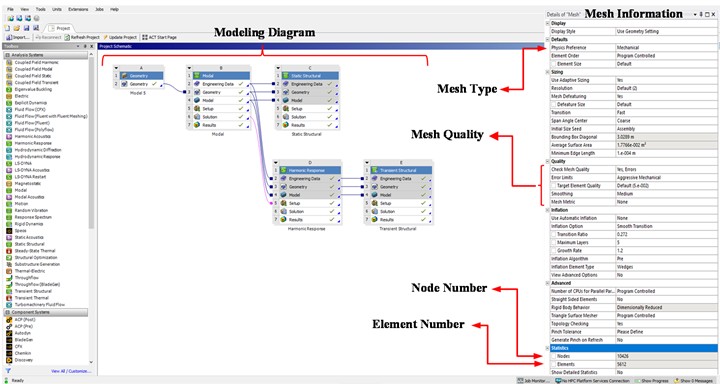
The FEM is one of the most practical numerical methods used for modeling and analyzing structures in various engineering research fields. ANSYS, a commercial FEM software, efficiently analyzes mechanical behaviors under different physical conditions, geometries, and materials. Based on the three-dimensional model (Fig. 2(c)), which is imported into ANSYS Workbench in .stp, .x_t, or .igs format, the analysis follows a step-by-step approach across multiple studies, including modal, static, harmonic, and transient modeling to evaluate the mechanical properties of the TB. Considering the boundary conditions, such as supports at different locations and automatic meshing of the structure, the modal analysis is first performed to extract the natural frequencies of the structure. Subsequently, distributed loads are applied to the top face of the structure, preparing the TB for further analyses. For instance, the static study determines the Von Mises Stress (VMS) to evaluate the ultimate safety factor. Based on the extracted natural frequencies, the harmonic analysis is then conducted to examine VMS under cyclic loads, helping to compute the yield safety factor. Finally, the transient analysis monitors the VMS of the TB at the initial loading phase, where the operational load is applied as a step force (see Fig. 5).
Fig. 5FE procedures in ANSYS workbench: a) configuration model, b) loading, c) meshing
a)
b)
c)
3. Result and discussion
This design and simulation will demonstrate three mechanical processes of the test bed in the ANSYS-Workbench area: modal analysis, static analysis, and harmonic analysis. Ultimately, the safety factor of the component will be presented in a tabular format. During the simulation process, seven models were implemented with supports of varying sizes under the test bed structure. These models were used to simulate the analyses mentioned in the advanced comparison. The goal was to select the best model based on the optimal mechanical strength of the material during compressor operation and its performance in the lab tests. The primary factor in design is the parameter d, which represents the width of rectangular sections situated between holes. This number varies across all models. The following outcomes derived using ANSYS-Workbench are displayed: The third and fourth variants change just slightly in the quantity of rectangular supports. The determination of support zones is based on the highest deflection seen in Fig. 6. They transition between openings of varying dimensions.
At first, in the ANSYS, mechanical properties are used for structure are followed as Table 2.
Fig. 6Assumed supports in proposal models
a) Model 3
b) Model 2
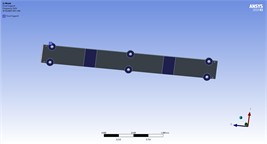
c) Model 1
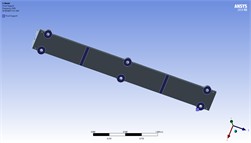
d) Model 6
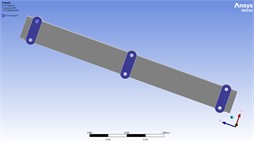
e) Model 5
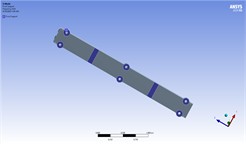
f) Model 4
g) Model 7
Table 2FEM’s properties in ANSYS
Parameter | Value |
Young modulus (Pa) | 2e11 |
Density (Kg/m3) | 7850 |
Possion’s ratio | 0.3 |
Shear modulus (Pa) | 7.6923e10 |
3.1. Simulation process
The table below presents numerical data obtained from ANSYS Workbench 2019-R3, including static stress (SS), dynamic stress (or harmonic analysis) (DS), and transient stress (TS). These results are used to improve the reliability of the design. The selection models operate according to the following methodology:
1) Static Analysis: This analysis evaluates the long-term effects of the continuous application of force by the rotor on the structure of the TC.
2) Dynamic Analysis: This type of analysis looks at how the system responds to harmonics, which means that the angular speed of the TC changes over time while it is working.
Analysis Steps:
Step 1: Modal Analysis. To find resonance events, modal analysis simulates all the proposed models in ANSYS and compares them to a reference model that doesn't have any support. The natural frequencies of the proposed models show significant differences from those of the reference model, as illustrated in Fig. 7 and Table 3.
Step 2: Static Analysis. Static analysis checks to see if the proposed models’ material strengths are realistic and stay below standard values, like ultimate tensile and yield strengths. This information is provided in the table.
Step 3: Safety Factor for Static Analysis (). Eq. (5) is used to find models that can be used for further analysis in ANSYS by calculating the values of the static analysis. Proposed models with an value below 1, such as models 4 and 7, are rejected.
Step 4: Harmonic Analysis. Harmonic analysis looks at how the TC reacts to the forces that the rotor puts on its structure at different angular speeds.
Step 5: Safety Factor for Harmonic Analysis (). Eq. (6) is used to figure out which proposed models should be left out of the next steps by finding their values for harmonic analysis. Models 7 is rejected based on these calculations.
Step 6: Transient Analysis. In ANSYS, transient modeling looks at the system’s starting conditions, which could be changed by unknowns like electrical or mechanical shocks or impulses.
Step 7: Final Model Selection. The ultimate selection narrows down to models 1 to 6. Among these, model 5 demonstrates superior performance and is strongly recommended for implementation under real operating conditions.
In order to avoid resonance occurrences, it is crucial to take into account the natural frequencies of all models. The Fig. 7 and Table 3 show that when models 1 through 7 are looked at as a whole, their natural frequencies are very different from the test bed’s natural frequency structure, in Table 3.
Table 3Natural frequencies of the 7 models
Model (Hz) | |||||||
Pure | 1 | 2 | 3 | 4 | 5 | 6 | 7 |
0 | 289.63 | 1306.1 | 1214.9 | 1124.1 | 1036.1 | 838.4 | 333.2 |
0 | 317.23 | 1340.5 | 1244.9 | 1158.4 | 1073.8 | 844.06 | 350.43 |
3.38E-04 | 553.96 | 1347.8 | 1261.9 | 1184.4 | 1117.2 | 1136.8 | 567.47 |
3.76E-04 | 557.09 | 1432 | 1346.2 | 1260.6 | 1189.1 | 1140 | 570.88 |
7.98E-04 | 643.82 | 1682.2 | 1587.6 | 1503.8 | 1419.8 | 1340.6 | 675.98 |
1.10E-03 | 673.73 | 1712.9 | 1603.2 | 1521.8 | 1449 | 1342.1 | 698.54 |
68.84 | 741.6 | 1726.4 | 1627.4 | 1548.3 | 1478.2 | 1995.4 | 852.44 |
156.59 | 819.46 | 1736.2 | 1645.5 | 1566.3 | 1490.9 | 2006.8 | 899.85 |
188.58 | 1208 | 1919.6 | 1820.6 | 1721.9 | 1624.8 | 2495.2 | 1237.4 |
220.02 | 1217.8 | 1930.6 | 1828.2 | 1735.1 | 1644.5 | 2500.6 | 1248.8 |
According to the Table 3, the natural frequencies of all the models are significantly shown different from those of the original model (Fig. 7), which is an outdated form of the structure. Therefore, models one to seven are eligible for usage under TC in the lab. However, it must need to choose the most optimal model using the trial-and-error approach. Consequently, to suggest using supplementary simulation methods to assess the material durability of all models, each with distinct support positions. To clarify, this approach involves using basic analytical techniques such as static and harmonic approaches to represent many proposals and determine the most optimal choice. The forces applied to the structure are dispersed according on the lowest and maximum angular velocity of TC’s rotor in our lab. In Table 4, these forces are 50 to 150 tons per meter and are spread over the surface of the structure in a normal distribution, based on the weighted force formula .
Fig. 7Natural frequencies of the 7 models
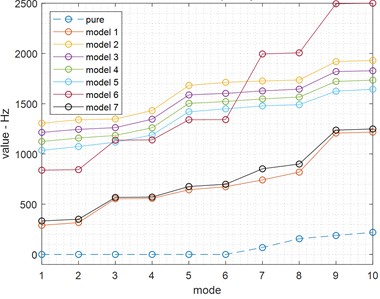
Table 4ANSYS results of seven models alongside model validation checks
No | (cm) | ton/m | SS (Pa) | Check 1 | DS (Pa) | Check 2 | TS (MPa) | ||
1 | 20 | 50 | 21685 | 20.48 | Pass | 106230 | 20.47 | Pass | 29.24 |
80 | 34696 | 12.8 | 169970 | 12.79 | 46.785 | ||||
100 | 43370 | 10.24 | 212460 | 10.23 | 58.48 | ||||
150 | 65055 | 6.83 | 318690 | 6.82 | 87.72 | ||||
2 | 15 | 50 | 53864 | 19.73 | Pass | 177280 | 19.7291 | Pass | 30.34 |
80 | 86183 | 12.33 | 283650 | 12.33 | 48.56 | ||||
100 | 107730 | 9.86 | 354560 | 9.86 | 60.71 | ||||
150 | 161590 | 6.576 | 531840 | 6.57 | 91.09 | ||||
3 | 10 | 50 | 57500 | 19.54 | Pass | 22325 | 19.5 | Pass | 2.03 |
80 | 92000 | 12.2 | 35721 | 12.21 | 48.81 | ||||
100 | 115000 | 9.77 | 44651 | 9.77 | 61.02 | ||||
150 | 172500 | 6.5135 | 66976 | 6.51 | 91.57 | ||||
4 | 10 | 50 | 54977 | 18.5 | Pass | 190340 | 18.5 | Pass | 32.34 |
80 | 294820 | 2.53 | 18354 | 2.53 | 230.21 | ||||
100 | 109950 | 9.25 | 380670 | 9.25 | 64.69 | ||||
150 | 164930 | 6.16 | 571010 | 6.17 | 97.07 | ||||
5 | 13 | 50 | 184260 | 4.0516 | Pass | 11471 | 4 | Pass | 143.67 |
80 | 67369 | 11.26 | 397890 | 11.26 | 53.15 | ||||
100 | 368530 | 2.02 | 22942 | 2.02 | 288.06 | ||||
150 | 552790 | 1.3 | 34414 | 1.35 | 433.16 | ||||
6 | 5 | 50 | 42106 | 18 | Pass | 248680 | 18 | Pass | 33.21 |
80 | 267510 | 1.82 | 22213 | 1.8 | 318.07 | ||||
100 | 84212 | 9 | 49737 | 9 | 66.44 | ||||
150 | 126320 | 6.1 | 41469 | 6 | 99.69 | ||||
7 | 0 | 50 | 167200 | 2.91 | Failed | ||||
80 | 267510 | 1.82 | |||||||
100 | 334390 | 1.45 | |||||||
150 | 501590 | 0.97 | |||||||
Fig. 8 displays the bending moments and deflections of ss- beam with different inputs, namely point loads specified in Table 4 (third column), as determined by Eqs. (1) and (2).
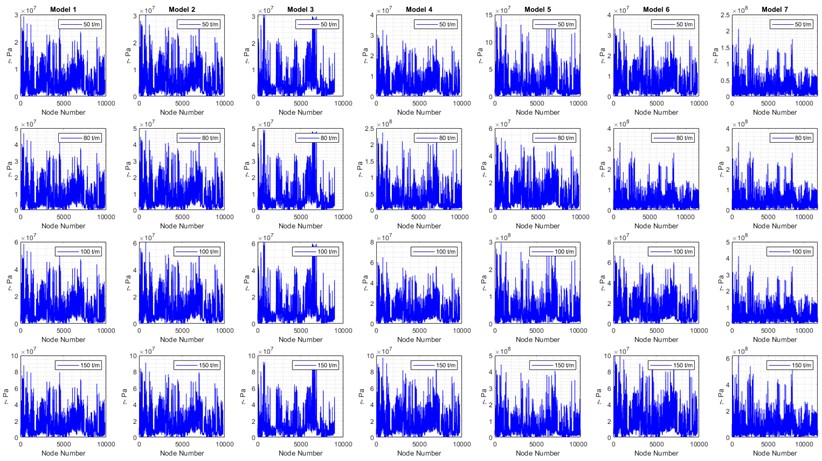
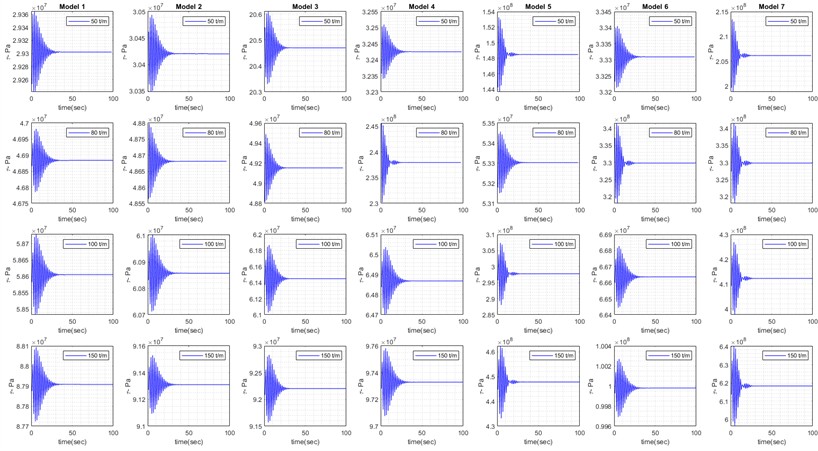
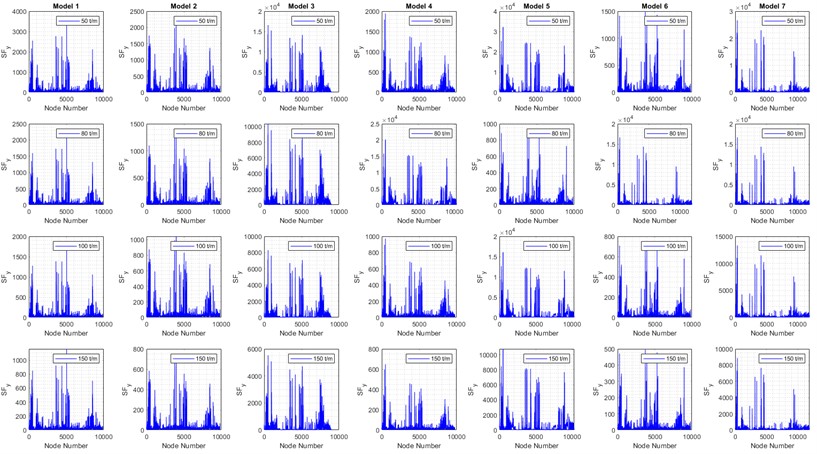
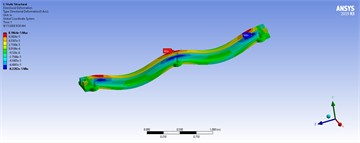
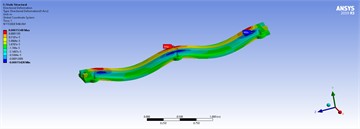
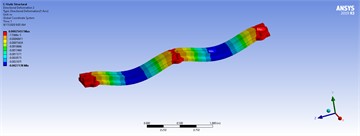
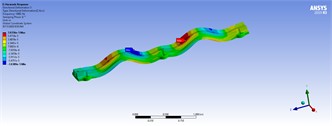
Above all the mentioned steps, the FEM’s results derived from Table 4 (Fig. 5) include seven models, as shown in Figs. 9-14, which illustrate the VMSs in different analyses: static (Fig. 9), harmonic (Fig. 10), and transient (Fig. 11) compare the maximum mechanical stress in different models at each node. Similarly, based on the accepted six models in Table 4, Figs. 12 and 13 clearly compares the ultimate and yield safety factors, determining which model provides the best performance. Finally, model 5 stands out as one of the best designs, demonstrating high material and structural strength across different analyses and operating conditions.
Fig. 8Comparison results: a) maximum torque and displacement of ss-beam based on TB’s properties, b) mechanical stress in static forces
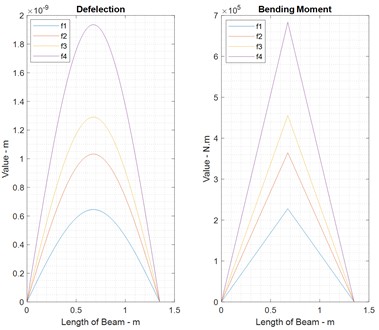
a)
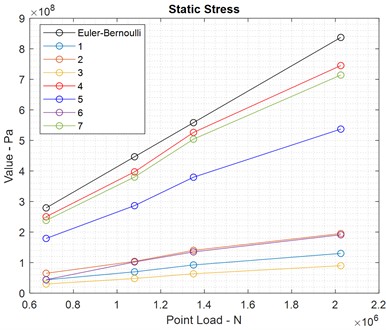
b)
Fig. 9Maximum stress of nodes in static analysis
In detail, Fig. 14 the numerical results (FEM models in ANSYS) for six acceptable models based on Table 4. These results include static, harmonic, and transient analyses. Models 1 to 6 demonstrate reasonable strength under various load conditions. Hence, the safety factors ( 1 and 1) indicate that the maximum mechanical stresses in models 1 to 6 exceed their ultimate and yield strengths under different loads. Therefore, these models are analyzed with different support configurations based on the boundary conditions of the TBs in various directions. Elaborately, Fig. 14 compares various maximum stress, safety factors from previously accepted models and highlighting the most notable ones.
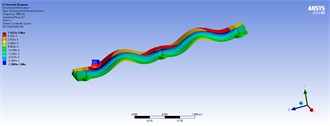
Fig. 10Maximum stress of nodes in harmonic analysis
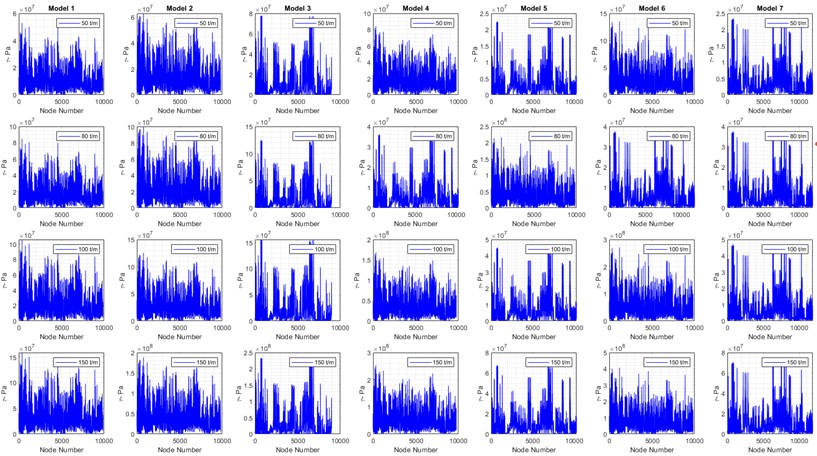
Fig. 11Maximal stress in transient analysis
Currently, it is deemed acceptable to thoroughly study all seven models in order to proceed with the next phases. Utilizing ANSYS, the FEM of the fifth recommended model was analyzed using four methods: modal, static, harmonic, and transient studies. The contour spectrum in the following illustrations represents three-dimensional displacements and corresponding stress (see Figs. 8-11). Based on Fig. 5, four types of analyses are conducted in the tree design.
Fig. 12Ultimate safety factor of the 7 models
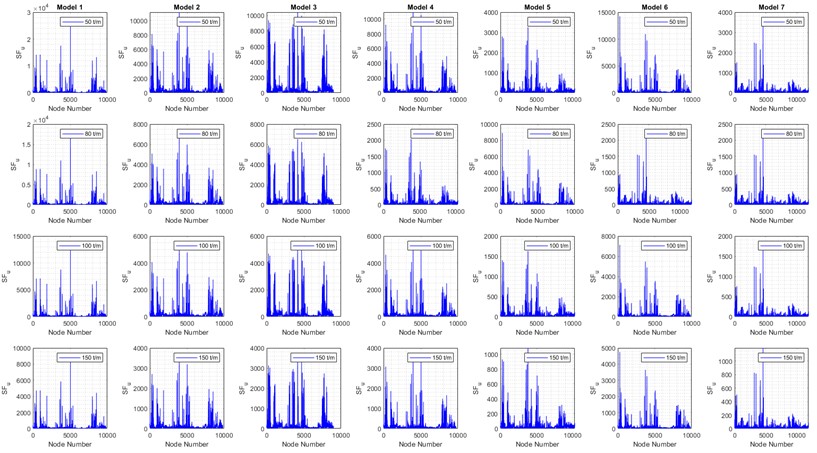
Fig. 13Yield safety factor of the 7 models
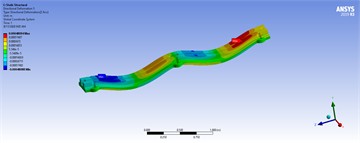
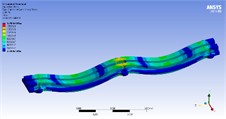
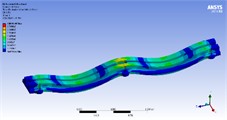
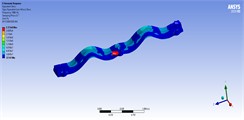
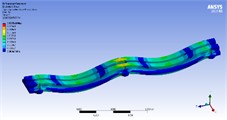
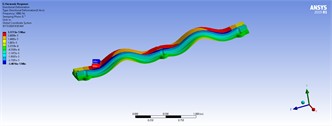
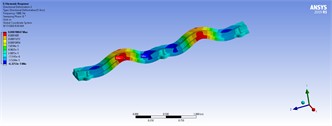
In the modeling phase, a triangular mesh (mechanical type) is automatically and adaptively generated, as shown in the mesh information section of Fig. 5. For example, the number of nodes and elements are 10,426 and 5,612, respectively. At this stage, the model is ready for modal analysis. Secondly, fixed support is assumed at three positions at the bottom of the holes. Thirdly, the load distribution is applied to the left and right top faces of the structure with varying values of 50, 80, 100, and 150 tons per meter. The model is then utilized for static, harmonic, and transient analyses. In the harmonic analysis, the lower and upper frequency bands are determined based on the minimum and maximum natural frequencies extracted from the modal analysis. In the transient analysis, the applied load is assumed to be a step force with a time step of 0.01 seconds. As a consequence, the corresponding results of the shape modes, three-dimensional displacements, and mechanical stress for different loads in model 5 are shown in Fig. 15, Tables 5, 6, and 7 illustrate the spectrum, where the critical zones are indicated by maximum values in red and minimum values in blue.
Fig. 14Comparison maximum stress and safety factors of the 6 models
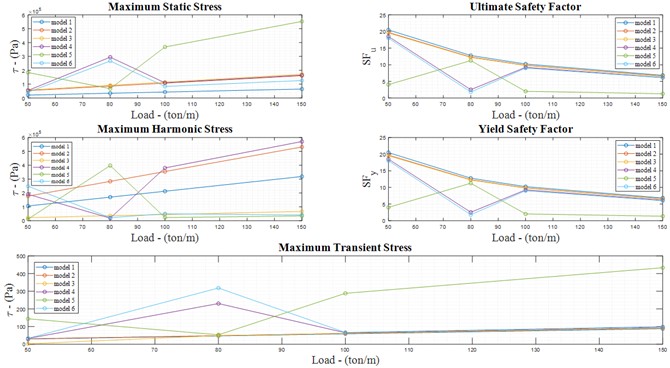
Fig. 15Ten mode shapes of the fifth model
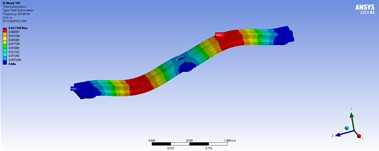
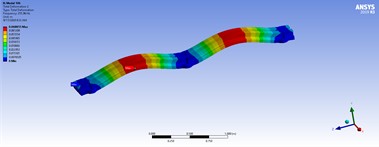
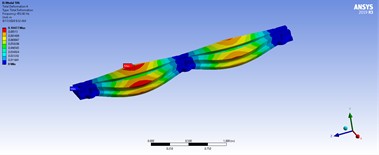
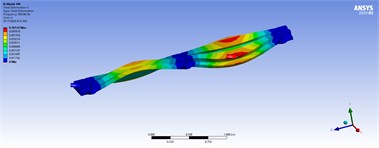
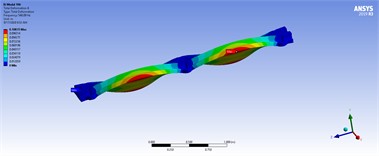
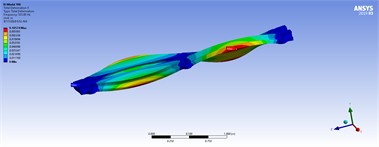
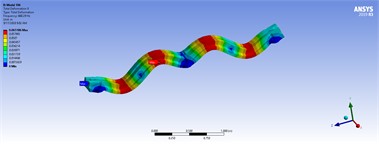
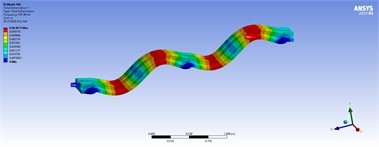
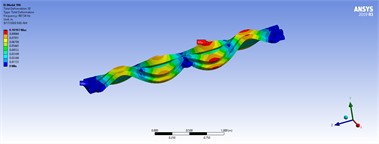
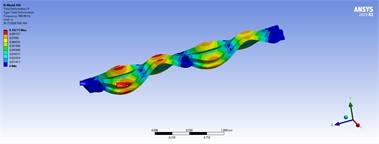
Table 5Three-dimensional displacements of distributed forces for the best model
80 ton/m | 50 ton/m | |
 |  | |
 |  | |
 |  | |
150 ton/m | 100 ton/m | |
 |  | |
 |  | |
 |  | |
In short, Table 8 provides a brief description of each procedure in SOLIDWORKS and ANSYS simulations for understanding why the optimized model is considered the best model in this research. Finally, the fifth model is nominated as the optimal design, as shown with the size of supports in Fig. 16.
In short, the entire process of this research is summarized in Table 7.
Fig. 16Support size in model 5
Table 6Stress contours of the best model in static, harmonic, and transient analyses for model 5
Static | Harmonic | Transient |
50 (ton/m) | ||
 |  |  |
80 (ton/m) | ||
 |  |  |
100 (ton/m) | ||
 |  |  |
150 (ton/m) | ||
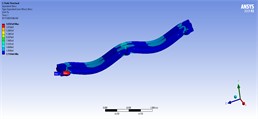 |  |  |
Table 7Three-dimensional displacements of harmonic analyses with distributed forces for model 5
80 ton/m | 50 ton/m | |
 |  | |
 |  | |
 |  | |
150 ton/m | 100 ton/m | |
 |  | |
 |  | |
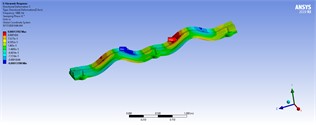 |  | |
Table 8Simulation process for the optimal model
Step | Task |
Drawing | Design feasible and different supports in SOLIDWORKS (Figs. 1(c), and 6) |
Modal analysis | Calculate deflections and natural frequencies of purposed models (Eq. (2), Figs. 7-8, 15-16, and Table 3) |
Static analysis | (1) Simulation in ANSYS (Figs. 9 and 18) (2) Calculate of selected models (Fig. 12) (3) Select new models with 1 (Fig. 14) |
Harmonic analysis | (1) Simulation in ANSYS (2) Calculate of selected model from static analysis (Fig. 13) (3) Select new models with 1 (Fig. 14) |
Transient analysis | (1) Simulation in ANSYS (2) Get and select maximum mechanical stress |
Best model | Presentation of the structure with the highest strength (Fig. 18) |
4. Conclusions
This research examined the most favorable position for turbo-compressors under the test bed construction in several scenarios, including initial operation, shock, impulse, long-term operation, and speed switching in the test laboratory. This work aims to address unknown and uncertain characteristics and variables by using strength material methodologies, such as free vibration and forced vibration methods. Turbo-compressor problems like misalignment, not enough lubrication, bearing clearance, imbalance, wear, erosion, corrosion, impeller cracks, worn seals, contamination, bent shafts from cracks, bending, and deflection, uncoupling problems, vibration and resonance, and not enough cooling due to blockages can make the data acquisition go wrong. Because these flaws in the manufacturing process are hard to see and can’t always be predicted, it's important to include certain studies during simulation and design. Modal, static, harmonic, and transient studies enhance the structural integrity in the presence of uncertainty. Systematically, to conduct several studies to determine the most suitable option is selected one of the three available models as the optimal design for an actual turbo-compressor test.
References
-
Hasanlu et al., “Modal analysis turboshaft test stand motor designed by using ANSYS,” Journal of Simulation and Analysis of Novel Technologies in Mechanical Engineering, Vol. 10, No. 1, pp. 781–796, Jan. 2020.
-
Rostami, M., Hasanlou, M., Siavashi, and M., “Modeling and comparison of mechanical behavior of foam filled and hollow aluminum tubes by LS-DYNA and introducing a neural network model,” Journal of Simulation and Analysis of Novel Technologies in Mechanical Engineering, Vol. 8, No. 4, pp. 275–293, Jan. 2020.
-
M. Hasanlu, M. Siavashi, and A. Bagheri, “Modeling of dynamic axial crushing of thin walled structures by LS-DYNA and genetic programming,” in 3rd International Conference on Researches in Science and Engineering, 2017.
-
W. Kryłłowicz, Z. Kozanecki, and P. Świder, “Modernization of a high-pressure synthesis gas turbocompressor,” Transactions of the Institute of Fluid-Flow Machinery, Vol. 131, pp. 121–130, 2016.
-
K. Saeki, H. Sanari, Y. Baba, M. Ito, T. Shibata, and M. Kurohashi, “Integrally geared centrifugal compressors for high pressure process gas services,” Kobelco Technology Review, Vol. 29, pp. 42–46, 2010.
-
G. Vannini, A. Pelagotti, E. Rizzo, and C. Carmicino, “Rotordynamic test results from a high flexibility ratio-high pressure fully instrumented centrifugal compressor test vehicle,” in 46th Turbomachinery Symposium, 2017.
-
L. Han, F. Li, N. Li, H. Zhou, L. Jiang, and Z. Wang, “The development of high efficiency integrally geared driven multistage centrifugal compressor,” International Journal of Fluid Mechanics and Thermal Sciences, Vol. 6, No. 2, pp. 53–60, Jan. 2020, https://doi.org/10.11648/j.ijfmts.20200602.12
-
W. Maier, Y. Biba, and D. Demore, “Testing of gas-liquid centrifugal separation and compression technology at demanding operating conditions,” in 43rd Turbomachinery Symposium, 2014.
-
G. Kleynhans, G. Pfrehm, H. Berger, and L. Baudelocque, “Hermetically sealed oil-free turbocompressor technology,” in 34th Turbomachinery Symposium, 2005.
-
R. Agbadede and B. Kainga, “Techno-economic analysis of the influence of different operating conditions on gas turbine centrifugal compressor set performance,” Nigerian Journal of Technology, Vol. 39, No. 4, pp. 1150–1157, Mar. 2021, https://doi.org/10.4314/njt.v39i4.23
-
O. Alshorman et al., “A review of artificial intelligence methods for condition monitoring and fault diagnosis of rolling element bearings for induction motor,” Shock and Vibration, Vol. 2020, pp. 1–20, Nov. 2020, https://doi.org/10.1155/2020/8843759
-
J. W. Fulton, J. M. Klein, A. Marriott, and A. D. Graham, “Full-load testing of an all-electric centrifugal compressor for miscible gas injection,” in 30th Turbomachinery Symposium, 2001.
-
J. Sun, Z. Zuo, Q. Liang, X. Zhou, W. Guo, and H. Chen, “Theoretical and experimental study on effects of humidity on centrifugal compressor performance,” Applied Thermal Engineering, Vol. 174, p. 115300, Jun. 2020, https://doi.org/10.1016/j.applthermaleng.2020.115300
-
G. Vannini, G. Del-Vescovo, M. Bertoneri, and M. Wilcox, “Centrifugal compressor rotordynamics in wet gas conditions,” in 43rd Turbomachinery Symposium, 2014.
-
Q. Liang, Z. Zuo, X. Zhou, H. Tang, and H. Chen, “Design of a centrifugal compressor with low solidity vaned diffuser (LSVD) for large-scale compressed air energy storage (CAES),” Journal of Thermal Science, Vol. 29, No. 2, pp. 423–434, Nov. 2019, https://doi.org/10.1007/s11630-019-1204-7
-
C. Meng, Z. Zuo, W. Guo, J. Sun, Q. Liang, and H. Chen, “Experimental and numerical investigation on off-design performance of a high-pressure centrifugal compressor in compressed air energy storage system,” Journal of Energy Storage, Vol. 53, p. 105081, Sep. 2022, https://doi.org/10.1016/j.est.2022.105081
-
A. Vulpio, A. Suman, N. Casari, M. Pinelli, R. Kurz, and K. Brun, “Analysis of timewise compressor fouling phenomenon on a multistage test compressor: performance losses and particle adhesion1,” Journal of Engineering for Gas Turbines and Power, Vol. 143, No. 8, p. 081005, Aug. 2021, https://doi.org/10.1115/1.4049505
-
W. Guo, Z. Zuo, J. Sun, H. Hou, Q. Liang, and H. Chen, “Experimental investigation on off-design performance and adjustment strategies of the centrifugal compressor in compressed air energy storage system,” Journal of Energy Storage, Vol. 38, p. 102515, Jun. 2021, https://doi.org/10.1016/j.est.2021.102515
-
X. Zhao, H. Li, S. Yang, Z. Fan, J. Dong, and H. Cao, “Blade vibration measurement and numerical analysis of a mistuned industrial impeller in a single-stage centrifugal compressor,” Journal of Sound and Vibration, Vol. 501, p. 116068, Jun. 2021, https://doi.org/10.1016/j.jsv.2021.116068
-
Z. Lin, Z. Zuo, W. Guo, J. Sun, Q. Liang, and H. Chen, “Experimental study on effects of adjustable vaned diffusers on impeller backside cavity of centrifugal compressor in CAES,” Energies, Vol. 14, No. 19, p. 6187, Sep. 2021, https://doi.org/10.3390/en14196187
-
F. Han, Z. Wang, Y. Mao, J. Tan, and W. Li, “Experimental and numerical studies on the influence of inlet guide vanes of centrifugal compressor on the flow field characteristics of inlet chamber,” Advances in Mechanical Engineering, Vol. 12, No. 11, Nov. 2014, https://doi.org/10.1177/1687814020974909
-
G. Liśkiewicz et al., “Unstable flow structures present at different rotational velocities of the centrifugal compressor,” Energies, Vol. 13, No. 16, p. 4146, Aug. 2020, https://doi.org/10.3390/en13164146
-
A. Khan et al., “Centrifugal compressor stall control by the application of engineered surface roughness on diffuser shroud using numerical simulations,” Materials, Vol. 14, No. 8, p. 2033, Apr. 2021, https://doi.org/10.3390/ma14082033
-
X. Xue and T. Wang, “Experimental and computational analysis of the unstable flow structure in a centrifugal compressor with a vaneless diffuser,” Chinese Journal of Mechanical Engineering, Vol. 32, No. 1, pp. 1–13, Aug. 2019, https://doi.org/10.1186/s10033-019-0379-x
-
B. Zhao, T. Zhou, and C. Yang, “Experimental investigations on effects of the self-circulation casing treatment on acoustic and surge characteristics in a centrifugal compressor,” Aerospace Science and Technology, Vol. 131, p. 108002, Dec. 2022, https://doi.org/10.1016/j.ast.2022.108002
-
A. Mazurkow, W. Homik, W. Lewicki, and Z. Łosiewicz, “Evaluation of selected dynamic parameters of rotating turbocharger units based on comparative model and bench tests,” Energies, Vol. 16, No. 14, p. 5550, Jul. 2023, https://doi.org/10.3390/en16145550
-
S.-A. Kim and K.-P. Hong, “Analysis and experimental verification of a variable speed turbo air centrifugal compressor system for energy saving,” Energies, Vol. 14, No. 4, p. 1208, Feb. 2021, https://doi.org/10.3390/en14041208
-
Y. Mao, C. Fan, Z. Zhang, S. Song, and C. Xu, “Control of noise generated from centrifugal refrigeration compressor,” Mechanical Systems and Signal Processing, Vol. 152, p. 107466, May 2021, https://doi.org/10.1016/j.ymssp.2020.107466
-
M. Shu, B. Yang, M. Yang, R. F. Martinez-Botas, and K. Deng, “Investigation on the unsteadiness of centrifugal compressor exposed to pulsating backpressure,” Proceedings of the Institution of Mechanical Engineers, Part D: Journal of Automobile Engineering, Vol. 235, No. 8, pp. 2212–2225, Jan. 2021, https://doi.org/10.1177/0954407020984593
-
H. Hazby, M. Casey, and L. Březina, “Effect of leakage flows on the performance of a family of inline centrifugal compressors,” Journal of Turbomachinery, Vol. 141, No. 9, Sep. 2019, https://doi.org/10.1115/1.4043786
-
D. Luberti et al., “Design and testing of a rig to investigate buoyancy-induced heat transfer in aero-engine compressor rotors,” Journal of Engineering for Gas Turbines and Power, Vol. 143, No. 4, Jul. 2021, https://doi.org/10.1115/1.0002631v
-
X. Zhao, Q. Zhou, S. Yang, and H. Li, “Rotating stall induced non-synchronous blade vibration analysis for an unshrouded industrial centrifugal compressor,” Sensors, Vol. 19, No. 22, p. 4995, Nov. 2019, https://doi.org/10.3390/s19224995
-
J. Zhang, W. Chu, J. Zhang, and Y. Lv, “Vibroacoustic optimization study for the volute casing of a centrifugal fan,” Applied Sciences, Vol. 9, No. 5, p. 859, Feb. 2019, https://doi.org/10.3390/app9050859
-
A. Alsaeed, G. Kirk, and S. Bashmal, “Effects of radial aerodynamic forces on rotor-bearing dynamics of high-speed turbochargers,” Proceedings of the Institution of Mechanical Engineers, Part C: Journal of Mechanical Engineering Science, Vol. 228, No. 14, pp. 2503–2519, Feb. 2014, https://doi.org/10.1177/0954406214520817
-
E. Ciulli, R. Ferraro, P. Forte, A. Innocenti, and M. Nuti, “Experimental characterization of large turbomachinery tilting pad journal bearings,” Machines, Vol. 9, No. 11, p. 273, Nov. 2021, https://doi.org/10.3390/machines9110273
-
M. Hasanlu, “Multivariable optimal control of fuel inlet and IGV parameters of gas turbine via PID-PSO controller in presence of noise,” (in Persian), Journal of Mechanical Engineering and Vibration, Vol. 10, No. 3, pp. 32–38, 2019.
-
M. Hasanlu, “Experimental condition monitoring of unbalanced rotary shaft based on ANFIS by using piezoelectric sensor,” Journal of Mechanical Engineering and Vibration, Vol. 11, No. 1, pp. 66–75, 2020.
-
M. Hasanlu, “Clearance prediction of rotary system with and without mechanical diagnosis by using artificial neural networks and particle swarm optimization,” Journal of Mechanical Engineering and Vibration, Vol. 11, No. 2, pp. 7–11, 2020.
-
C. Pany and G. V. Rao, “Calculation of non-linear fundamental frequency of a cantilever beam using non-linear stiffness,” Journal of Sound and Vibration, Vol. 256, No. 4, pp. 787–790, Sep. 2002, https://doi.org/10.1006/jsvi.2001.4224
-
C. Pany and G. V. Rao, “Large amplitude free vibrations of a uniform spring-hinged beam,” Journal of Sound and Vibration, Vol. 271, No. 3-5, pp. 1163–1169, Apr. 2004, https://doi.org/10.1016/s0022-460x(03)00572-8
-
A. Vamsi et al., “Structural design and testing of pouch cells,” Journal of Energy Systems, Vol. 5, No. 2, pp. 80–91, Jun. 2021, https://doi.org/10.30521/jes.815160
-
C. Pany, “Cylindrical shell pressure vessel profile variation footprint in strain comparison of test data with numerical analysis,” Liquid and Gaseous Energy Resources, Vol. 1, No. 2, pp. 91–101, Dec. 2021, https://doi.org/10.21595/lger.2021.22163
-
C. Pany, “Large amplitude free vibrations analysis of prismatic and non-prismatic different tapered cantilever beams,” Pamukkale University Journal of Engineering Sciences, Vol. 29, No. 4, pp. 370–376, Jan. 2023, https://doi.org/10.5505/pajes.2022.02489
-
M. Hasanlu, A. Bagheri, and F. Najafi, “Optimal placement of piezoelectric S/A for active vibration control of engineering structures by using controller design,” Research Review Journal of Engineering Technology, Vol. 5, No. 4, pp. 22–44, 2016.
-
M. Hasanlu and A. Bagheri, “Optimal locations on Timoshenko beam with PZT S/A for suppressing 2DOF vibration based on LQR-MOPSO,” Journal of Solid Mechanics, Vol. 10, No. 2, pp. 364–386, 2018.
-
M. Hasanlu, M. Siavashi, and A. Bagheri, “Vibration attenuation Timoshenko beam based on optimal placement sensors/actuators PZT patches with LQR-MOPSO,” Iranian Journal of Mechanical Engineering, Vol. 17, No. 1, pp. 26–60, 2016.
-
M. Hasanlu, M. Siavashi, M. Soltanshah, and M. Zamanian, “Fuzzy-PID controller design for random vibration attenuated smart cantilever Timoshenko beam based on MOGA,” in 4th National and 2nd International Conference on Applied Research in Electrical, Mechanical and Mechatronics Engineering, 2017.
-
M. Hasanlu and A. Bagheri, “Intelligent control smart Timoshenko beam by using MOPSO-PID controller based on optimal location PZT patch actuator approach,” in System Dynamics and Solid Mechanics, Vol. 20, No. 3, pp. 6–38, 2018.
-
M. Hasanlu, M. Siavashi, and A. Bagheri, “Free vibration analysis of metamaterial functionally graded plates with quasi-zero stiffness resonators,” Noise and Vibration Worldwide, Vol. 54, No. 2-3, pp. 108–121, Jan. 2023, https://doi.org/10.1177/09574565231154248
About this article

The authors have not disclosed any funding.
The datasets generated during and/or analyzed during the current study are available from the corresponding author on reasonable request.
The authors declare that they have no conflict of interest.
