Abstract
Brake system reliability is critical for the safety and performance of heavy vehicles, including semi-trailers, passenger buses, and industrial transport units. This study investigates the thermal fatigue failure mechanisms in brake discs (BDs), which are subjected to extreme operational conditions. The primary motivation is to enhance brake disc durability and reduce the risk of catastrophic failures by understanding the interplay between material properties, thermal stress, and fatigue resistance. A comprehensive experimental approach was employed, including visual inspections, chemical composition analysis, metallurgical structure examination, hardness testing, and tensile strength evaluation. The study compares brake discs that have undergone extensive service with those in an undamaged state to identify critical degradation patterns. The results indicate that temperature fluctuations and cyclic thermal stresses induce crack formation and propagation, with rough graphite inclusions significantly reducing fatigue strength. Furthermore, deviations in silicon and carbon content were found to impact material integrity, contributing to premature failure. The findings of this research provide actionable insights for optimizing brake disc design, material composition, and manufacturing processes. By modifying graphite distribution, refining alloy compositions, and improving thermal resistance, future brake systems can achieve greater durability and reliability. These advancements will directly enhance braking efficiency, reduce maintenance costs, and improve overall vehicle safety.
Highlights
- The discs exhibit variations in silicon (Si) and equivalent carbon content, deviating from standard cutoffs.
- The brake discs lack C-type graphite, with rough graphite present in the disk areas, contributing to lower fatigue strength
- Hardness tests indicate that the cast iron grades range from G11H18 to G11H20, with tensile strength being notably low in the hub areas
- Microscopic analysis shows a structure consistent with pearlite and less than 5% ferrite, including type A and C graphite
- Temperature and stress are critical factors in thermal fatigue. Severe temperature fluctuations cause cyclical thermal stresses, particularly influenced by the disk's thickness
1. Introduction
Brake discs (BDs) play a crucial role in ensuring the safety and maneuverability of heavy vehicles by providing controlled deceleration under various operating conditions. However, due to high-speed rotations and extreme braking forces, BDs experience severe thermal and mechanical stress, leading to material fatigue, crack formation, and ultimately, failure. While extensive research has been conducted on brake disc materials and performance, existing studies often overlook the combined effects of thermal fatigue, microstructural defects, and chemical composition variations in real-world applications. The originality of this study lies in its multi-faceted experimental approach to evaluating BD failures, integrating quantitative metallurgical assessments, microscopic structure analysis, hardness profiling, and tensile strength testing. Unlike previous research, which primarily focuses on computational modeling or isolated material testing, this study bridges the gap between theoretical predictions and empirical failure observations. The novelty of this work is its emphasis on the impact of graphite morphology and silicon-carbon deviations on fatigue strength, a factor rarely explored in standard brake disc evaluations. By correlating structural defects with real-world wear patterns, this study provides new insights into optimizing brake disc manufacturing and design for enhanced durability. The scientific worth of this research is highlighted by its practical applicability. The findings contribute to the advancement of brake disc materials and design by offering data-driven recommendations for improving fatigue resistance, heat dissipation, and overall mechanical integrity. These insights are valuable not only for automotive engineers and manufacturers but also for regulatory bodies seeking to establish higher safety standards in the transportation industry. Due to the BD's ability to maintain angular velocities at both low and high speeds, its structure inherently incorporates instantaneous heat transfer and mechanical vibration phenomena. The new BD reduces the uncompressed weight of high-speed trains. Thermal investigations confirmed stability during emergency braking performance [1]. The rise in automotive BD's temperature during brake operation was studied. Finite element (FE) analysis, a well-known numerical method, determined durability when considering rotor geometry variations of BD's structure [2]. The discussion stems from increasing industrial needs, which emphasizes the need for improved materials to reinforce thermal and mechanical sustainability. The tribology of various materials, including composites, is investigated for future mechanical property enhancements [3]. Severe BD abrasion on snowy days was analyzed. Microstructure, chemical composition, and a model explaining the abrasion process were applied and validated through mechanical tests [4]. The safety and performance factors of railway brake systems were analyzed. Disc-pad mechanisms, essential for safe operation, were emphasized for improvement through research and development [5]. In another study, the brake dynamometer tests evaluated the influence of tread temperature on the wear of railway wheels. In addition, internal temperatures of 200-300 °C accelerated wear. FE analysis supported the findings [6]. The brake’s performance within carbon/ceramic pairs for high-speed trains was analyzed. Besides, introducing FeSi2 significantly improved wear resistance during high-pressure braking operations [7]. High-speed vehicle braking is crucial for safety. For optimal performance, friction-based systems require regular maintenance that emphasizes material and design enhancements [8]. Hybrid composite BDs with A357/SiC in the top layer and an AA6082 base exhibit outstanding wear and friction performance, proving suitability for city rail vehicles [9]. The incomplete failure in a gray cast iron of the BD was studied using metallurgical methods. For example, the failure was caused by nonmetallic inclusions, especially oxides, which created micro-cracks. Other studies recommended addressing prevention for enhanced product longevity [10]. A chapter delves into the aspects of heat energy in friction brake systems, highlighting the importance of management for achieving optimal performance. Moreover, various methods, including FE and CFD analyses, assess heat-related parameters and potential failure mechanisms [11]. The BD’s C/C-SiC excels in extreme circumstances due to applied friction and wearability factors. In other words, friction film formation ensures stable braking performance [12]. Railway BD's stability is vital. Contact pressure and thermal stress analyses on GC25 material show a linear relationship between temperature and stress variables, which can help figure out how long the bearings on railway vehicles will last [13]. High-speed trains' braking efficiency faces challenges due to thermal fatigue cracking. The suggested mix of materials extends the life of steel against thermal fatigue by stopping cracks from spreading through customized microstructure and precipitate morphology [14]. This investigation used analytical and numerical approaches to investigate fatigue failure in the Volvo truck’s BD. The analysis was based on the idea that the punch contact was flat, rigid, and uneven. The 3D FE model in ABAQUS simulated thermos-mechanical cycles. The crack, which grew by hydraulic pressure, reached the ultimate length of 6.02 mm, resulting in the BD's failure [15]. It focused on developing fatigue models of the vehicle components, emphasizing BD's cyclic response. Four models were analyzed and calibrated using isothermal and thermo-mechanical experiments. The calibrated models are then used in a simulated dynamometer experiment to assess the fatigue life of brake discs. Results highlight the importance of calibrating models with well-designed thermo-mechanical tests for accurate predictions [16]. Many BDs in firefighting vehicles showed thermal fatigue cracks. Macro-fractography revealed cracks along the friction surfaces, approximately 1-7.5 cm in length. Optical microscope and FESEM examinations confirmed the semi-elliptical cracks caused by the thermal fatigue. The chemical, microstructural, and hardness measurements met the requirements. The FE indicated that high temperatures and residual tensile stress during braking times caused the cracks. Therefore, the recommendations included examining and replacing BD in all firefighting vehicles [17]. The BD of a high-speed train is susceptible to thermal fatigue cracking. The proposed research uses a numerical model to improve material composition, thereby promoting reliability enhancement [18]. The commercial vehicle's BD analyzed fatigue with an FE model, exploring known and unknown items. Manson-Coffin's model predicts life and reliability variables [19]. The BD endures large thermal stresses during braking, causing surface cracks and plastic deformation. Thermo-mechanical fatigue analysis reveals rotor failure because of plastic deformation from high-g braking. Theoretical modeling aligns with reported braking cycles leading to failure [20]. Existing models fail to predict heavy-duty vehicle BD’s sensitivity to heat cracks. A dynamometer experiment provided insights into failed processes. The standardized heat crack test, monitored by different instruments, reveals factors contributing to crack propagation. Cyclic shear movements and disc coning variations are observed, prompting the need for a more detailed model to explain heat crack formation [21]. Experimental and numerical analyses are used to investigate the development of thermal striping on BD's friction bands. Based on serious braking tests, observations of crack growth networks, and numerical simulations, a macroscopic criterion for predicting network criticality. A numerical analysis of crack shielding processes is developed and compared with experimental results [22]. It could use full-scale drag braking tests to look at thermo-mechanical loading on BDs, showing changes in temperature, banding effects, and crack effects that could be used to improve performance [23]. This study looked at how grey cast iron reacts to cycling and wears down in vehicle body panels using different fatigue models. It also used isothermal and thermo-mechanical experiments to calibrate the models, which made the predictions for real body panels' lives more accurate than isothermal uniaxial tests [24]. Another article examined surface cracks in vehicle BDs, highlighting the potential risks and utilizing experimental methods to predict their depth, a crucial aspect for safety assessments [25]. The thermo-mechanical behavior of dry contact between BDs and pads during braking was studied by researchers. They used ANSYS to simulate and analyze factors that affect BD design. The results align with prior research studies [26]. The study closely examined various braking situations, the properties and uses of carbon-carbon (C/C) disc brakes, their wear mechanisms, performance, manufacturing, friction coefficients, and the production of wear dust [27]. The research focused on examining the wear of brake discs in relation to non-exhaust emissions. Surface manipulation using the plasma electrolytic aluminizing process shows a reduction in wear [28]. The amount of carbon ceramic on brake disc surfaces reveals bedded structures with transferred materials, SiC regions, and a thin friction layer. Residual wear and dislocations influence surface properties during braking operations [29]. Examining the tribological behavior of a brake pad at varying temperatures elucidates the shifting friction layer and the impact of thermal degradation on wear, ultimately offering valuable insights into the thermal stability of the brake material [30]. An analysis of a vehicle's disc brakes focuses on boosting the brake pad's material properties to increase the component's life. The final results, after modeling and verification, estimate that carbon ceramic discs outperform gray cast iron [31]. A study investigated the thermal behavior of vehicle brake discs, with a particular focus on factors such as braking, disc geometry, and materials. The ANSYS simulations aligned well with their findings [32]. Another study, simulating limit brake applications, examines the pin-on-disc interface method using metallography and high-level techniques. Findings were consistent with observations under severe braking conditions, highlighting third-body influences in friction response [33]. Recent research has investigated the wear particle characteristics of a truck's brake pads using variable conditions. Laser scattering presented distinct peaks, pressure, speed, and contact continuity. Energy dispersive X-rays revealed elemental composition variations [34]. A different study looked at the thermal and mechanical properties of cast iron brake discs. In order to test and confirm asymmetric yielding, kinematic hardening, and visco-plastic response at different temperatures [35], they used the Gurson-Tvergaard-Needleman material model. To examine the buckling behavior of unstiffened mild steel cone-cylinder assemblies under axial compression and combined axial compression and external pressure, providing experimental results and numerical predictions of the collapse load [36]. An experimental and numerical study on the buckling behavior of unstiffened cone-cylinder shells subjected to combined axial compression and thermal loading, with a focus on investigating the effects of various geometric parameters and initial imperfections on the load-carrying capacity of the structures [37]. The influence of ring stiffener reinforcement on the buckling behavior of cone-cylinder intersection subjected to external pressure, with three different stiffener locations analyzed and the results validated against experimental data [38]. The study presents entirely several key novelties and contributions in the analysis of brake disc failures. It identifies the absence of C-type graphite in brake discs, marking a deviation from typical cast iron structures. The research demonstrates the dual role of temperature fluctuations, not only inducing thermal stress but also contributing to ground tempering, which accelerates fatigue failure. A novel insight is provided into the impact of rough graphite, which lowers fatigue strength and enhances susceptibility to thermal fatigue and crack propagation. Structural analysis reveals distinct wear patterns, with uniform wear on the backside and irregular wear on the wheel side, indicating differing thermal and mechanical stress distributions. The study also observes deep radial cracks at regular intervals, suggesting a geometric correlation in failure patterns. A significant disparity in thickness and weight between damaged and intact discs is highlighted, impacting performance. The research uncovers deviations in silicon and carbon content below recommended limits, challenging the consistency of SAE J431 standards. Furthermore, tensile and hardness tests show grade shifts from G11H20 to G11H18, pointing to mechanical weaknesses. Finally, the study links secondary cracks with thermal cyclic stresses, emphasizing the relationship between temperature gradients and material degradation in brake discs. These findings contribute valuable insights into the factors influencing brake disc performance and durability. Accordingly, the current research paper explores the crucial role of the BD’s structure in heavy vehicles, emphasizing its increased controllability and safety. This study entails the experimental analysis of a damaged BD using visual inspections, chemical analysis, microscopic structure examination, hardness, and tensile tests. The results indicate a complex failure mechanism, including thermal fatigue and heat transfer after working long distances. Based on the metallurgical properties, such as silicon and equivalent carbon content, deviating from standard limits and cut points affected the fatigue strength of the cast iron. Hence, reports include reviewing the fatigue strength and modifying graphite distribution to enhance BDs' performance and prevent failures in future products.
2. Material and method
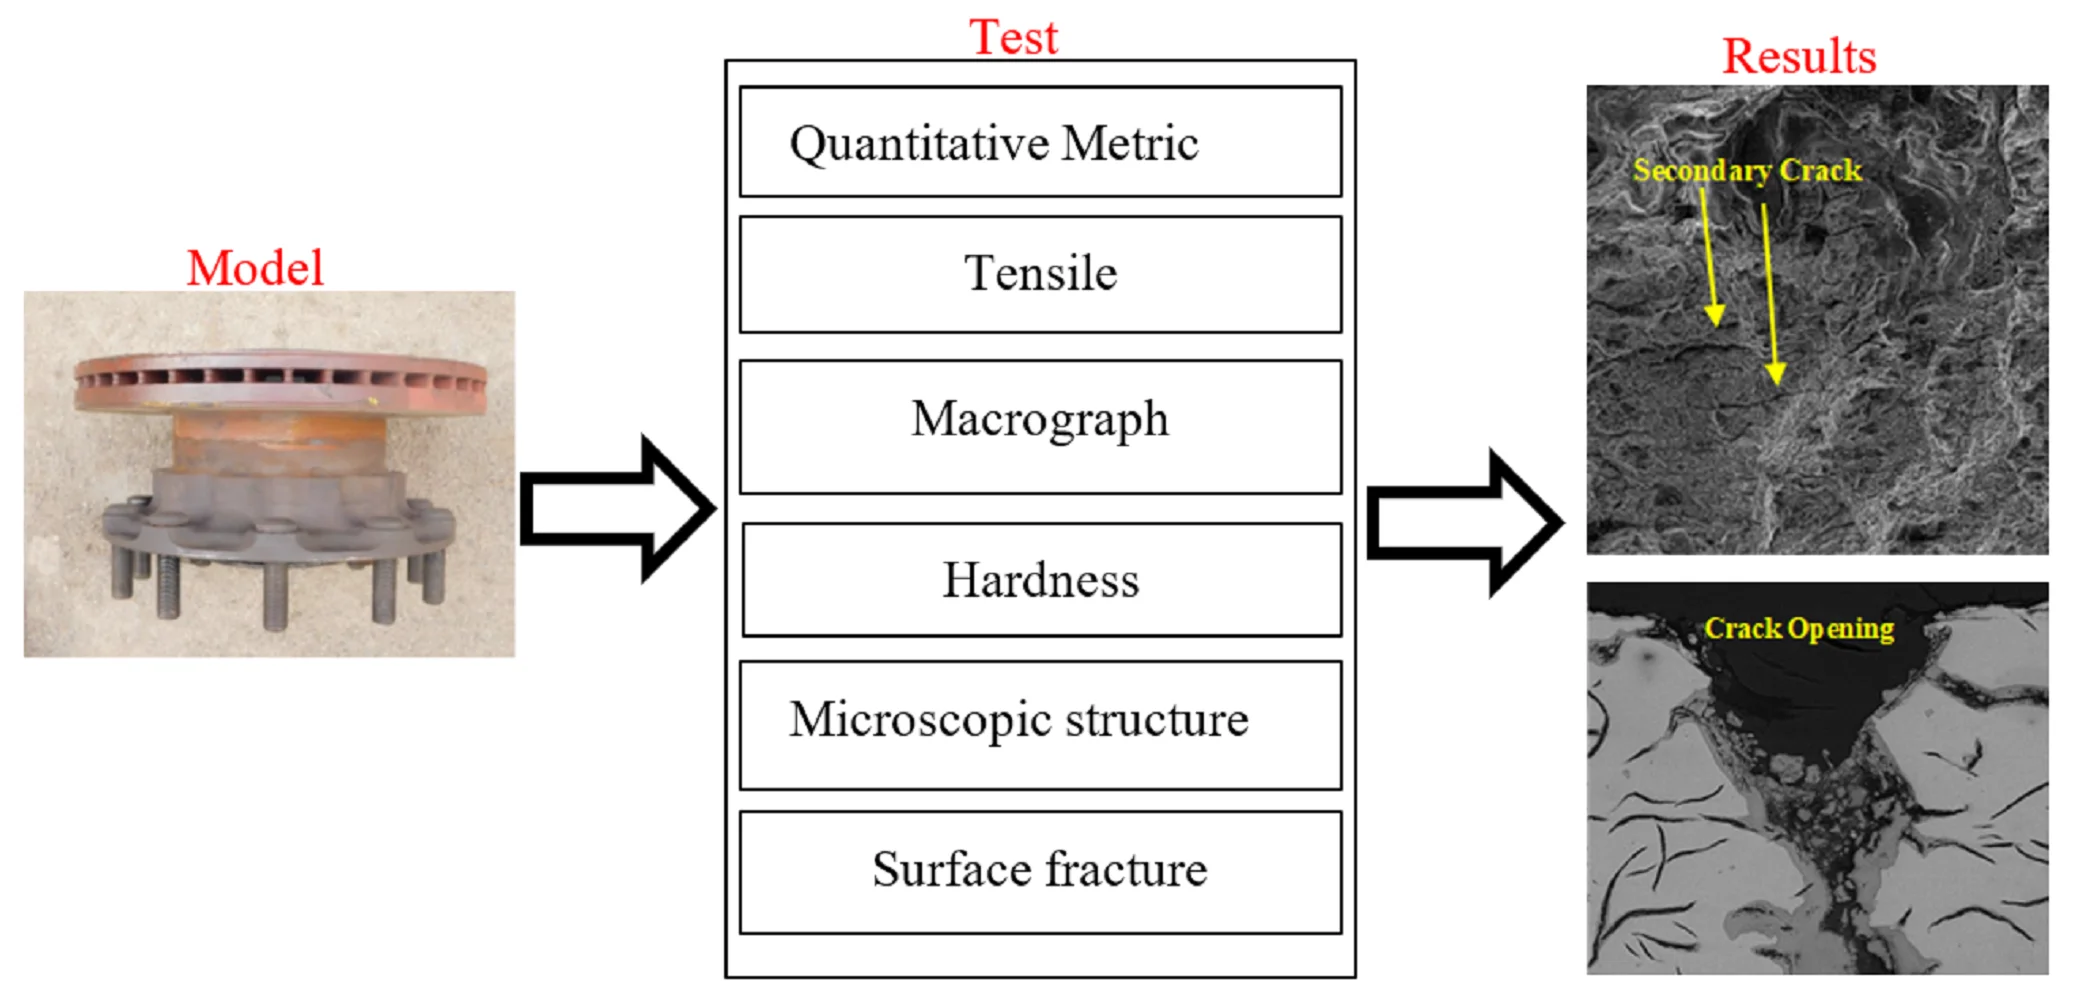
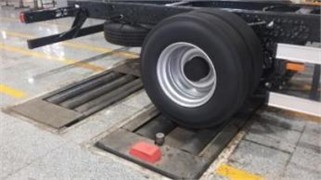
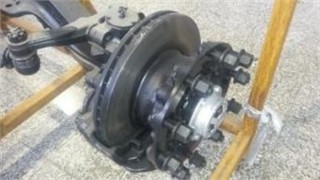
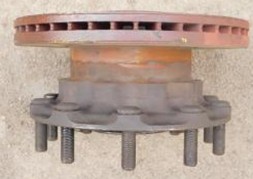
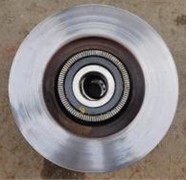
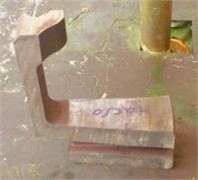
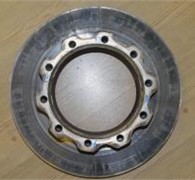
In these experiments, the focus is on the main parts of the brake system (see Fig. 1), which include the structure of the BD on heavy vehicles. In two types, they are worked and damaged separately (see Fig. 2).
Fig. 1Real model of the BD: a) brake test, b) assembled brake
a)
b)
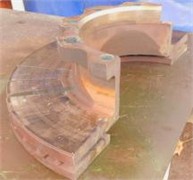
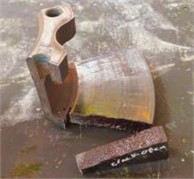
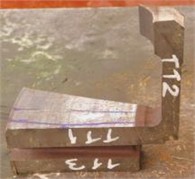
This study of failure causes by disassembling the disk piece from its flange part. Next, we conducted visual inspections and, based on the results, selected one of the cracks to open its surface and study the failure mechanism. Next, sampling was done to perform chemical analysis, microscopic structure, hardness, and tensile tests. Fig. 3 shows the sampling positions, and Table 1 displays the list of tests performed.
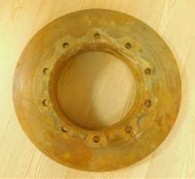
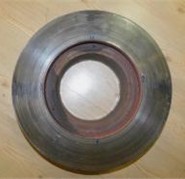
Fig. 2BD’s structure: a) disc area, 1-Hub, Forward, Backward, b) damaged backward disc, c) worked BD
a)
b)
c)
Fig. 3BD: a) damaged BD, quantometry position, cutting cross-section, b) cracked area, Opened crack surface, c) macrography and hardness tests sample, d) tensile test, 1 – test Zones, e) worked BD, sample test, f) metallography, test zones
a)
b)
c)
d)
e)
f)
Table 1Experimental tests
Test | Damaged sample |
Quantitative metric | Flange and disc |
Tensile | TT1, TT2, and TT3 samples |
Macrograph | Whole cross section |
Hardness | Six points on disc and hub |
Microscopic structure | Two zones on MET2, and MET1 |
Surface fracture | On crack on disc |
2.1. Brake disc sample selection
The study analyzed brake discs (BDs) from heavy vehicles that had undergone extensive service under real-world conditions. Two primary types of discs were selected:
1) Damaged Brake Disc (DBD) – A disc exhibiting visible fatigue cracks, oxidation, and wear.
2) Undamaged Brake Disc (UBD) – A control sample with no apparent defects, used for comparative analysis.
Both samples were subjected to metallurgical, mechanical, and thermal fatigue evaluations to determine the root causes of failure and assess structural integrity.
2.2. Thermal fatigue evaluation
To systematically evaluate the thermal fatigue behavior of brake disc materials, the following experimental techniques were employed:
1) Visual Inspection and Fractography Analysis:
– A detailed visual examination of the brake discs was conducted to identify surface cracks, wear patterns, and oxidation marks indicative of thermal fatigue.
– Scanning electron microscopy (SEM) and macro-fractography were used to analyze crack morphology, propagation paths, and fracture surface characteristics, offering insights into fatigue-induced failure mechanisms.
2) Microstructural Analysis:
– Optical and SEM imaging were performed to observe microstructural changes due to cyclic thermal loading. Special attention was given to graphite morphology, carbide formation, and oxidation-induced defects.
– The presence of type A and type C graphite structures and their effect on fatigue resistance were examined.
3) Hardness and Tensile Testing:
– Brinell hardness tests were conducted at multiple locations across both damaged and intact discs to detect variations in hardness due to thermal cycling.
– Tensile tests, following JIS Z 2241-2012 standards, were performed to quantify reductions in material strength and ductility caused by prolonged thermal fatigue.
4) Chemical Composition and Surface Oxidation Analysis:
– Using quantometry analysis, the elemental composition of both damaged and undamaged discs was compared, focusing on deviations in silicon and carbon content that influence fatigue resistance.
– The effects of oxidation layers and thermal stress-induced chemical transformations were examined to assess their role in crack initiation and propagation.
5) Thickness and Mass Comparisons:
– Variations in thickness and mass between damaged and undamaged brake discs were measured to quantify material loss due to thermal fatigue.
These measurements provided additional confirmation of uneven wear patterns. In summary, experimental tests overview are followed as Table 2.
Table 2Summary of experimental tests
Test type | Objective | Method / standard used |
Visual and fractography | Identify surface cracks and failure patterns | Optical Imaging, SEM |
Microstructural | Examine graphite and oxidation effects | ASTM A247-19 |
Chemical composition | Analyze elemental composition | ASTM E1306-22 |
Hardness and tensile | Assess material strength degradation | ASTM E10-2018, JIS Z 2241-2012 |
Thickness and mass | Measure material loss and wear | Digital Calipers |
Wear pattern | Compare uniform and non-uniform wear zones | Optical Microscopy |
Surface oxidation | Evaluate oxidation layer and crack growth | SEM, Energy Dispersive X-ray |
Structural deformation | Assess thermal fatigue impact on geometry | Macroscopic Inspection |
2.3. Visual inspection
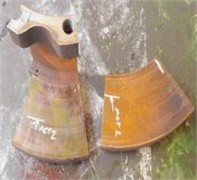
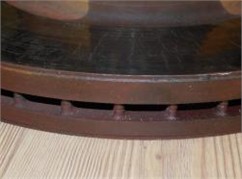
Before visual inspection, different zones on both sides of two discs were assumed to be clockwise numbered. The forward disc (FD) and rearward disc (RD) are on the flange side and its front, respectively (see Fig. 4).
Fig. 4Worked disc sample: a) forward area, b) backward area, c) before cutting BD
a)
b)
c)
Fig. 5Visual inspection of FD since 12 AM - 2 PM
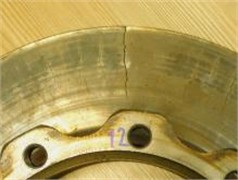
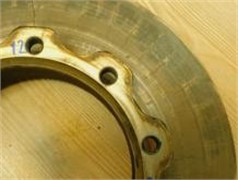

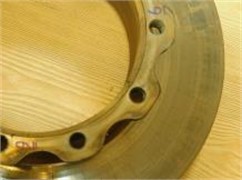
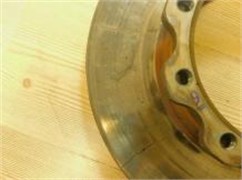
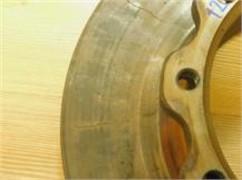
Fig. 6Crack types on FD
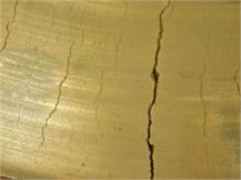
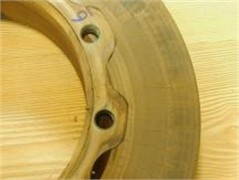
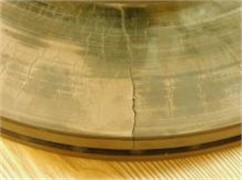
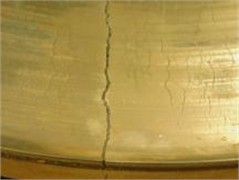
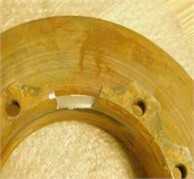
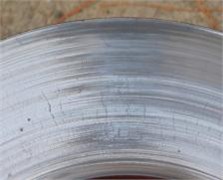
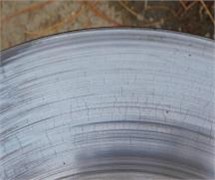
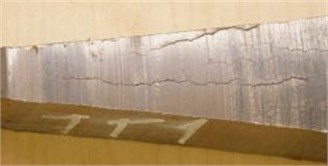
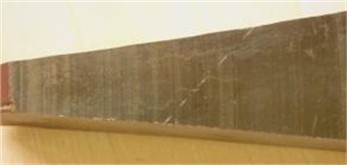
During the visual inspection, numerous radial cracks were observed on the disk surface on the wheel side. The cracks are discontinuously located in the radial direction, with a misaligned morphology. After cutting, it was seen that most of these cracks did not grow much in the direction of thickness and did not reach the edge of the lateral surface in the radial direction. However, observing three deep radial cracks at three different locations, each extending through the entire thickness and spreading to the side surface. On the surface of the back disc, the cracks are more delicate and exhibit significantly less joining and growth. In Figs. 5 to 8, the growth model of radial cracks can be seen on the surfaces of the wheel-side disk and the back disk, respectively. On the surface of the hub of the back disk, the part coding marks were also observed.
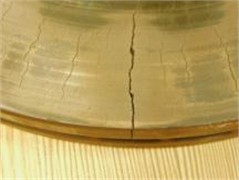
Fig. 7Visual inspection of RD since 12 AM-2 PM
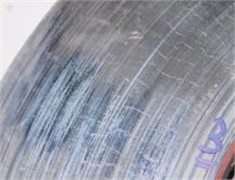
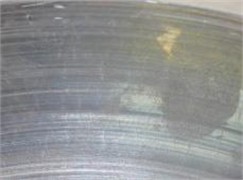
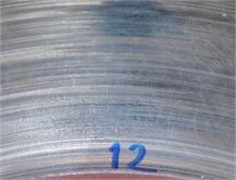
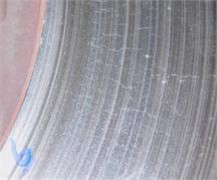

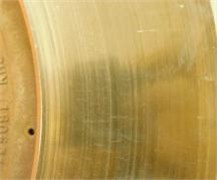
Fig. 8Radial cracks on RD: a) manufacture legend, b) radial crack growth, c) crack growth on thickness
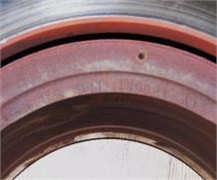
a)
b)
c)
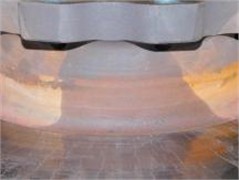
Upon visual inspection, traces of peripheral wear lines can be seen on the surface of both discs. However, the wear band model is different on both sides. On the disc’s back side, the distribution of wear bands is more uniform, while on the disc's wheel side, the wear lines are not visible in a wide middle band, revealing wear bands similar to those on the back side (Fig. 9).
Fig. 9Distribution corrosion band: a) FD, b) RD
a)
b)
Table 3Thickness results of BD
Disc | Thickness(mm) | |
Damaged disc | Worked disc | |
FD | 3/18 | 12.8 |
BD | 9/13 | 8/7 |
In the initial evaluation, a significant difference in the weight of the two destroyed and used parts was observed. The thickness of the destroyed and worked discs was measured with calipers and shown in Table 3. Based on the disc thickness differences, that can justify the weight difference between the two pieces.
3. Result and discussion
3.1. Metallurgical tests
Applying the quantum method and took into account the ASTM E1306-22 test reference standard. Tables 4 and 5 present the results of the quantum analysis of the destroyed and used disks after the flake samples were prepared. Based on the analysis, the chemical composition of the two parts is almost identical and contains chromium and copper alloy elements. The amount of equivalent carbon in both parts was also calculated and presented in Tables 4 and 5. Using the following relationship, the destroyed part’s higher Si content explains the CE difference.
Table 4Chemical analysis of damaged disc
C | Si | Mn | P | S | Cr | Ni | Mo | Cu | V | M |
3.40 | 1.73 | 0.67 | 0.026 | 0.078 | 0.36 | 0.02 | 0.005 | 0.47 | 0.007 | 0.007 |
Ti | Co | Al | Sn | Pb | As | Sb | Zr | Nb | Fe | |
0.011 | 0.005 | 0.004 | 0.064 | 0.003 | Trace | None | Trace | 0.005 | Base |
Table 5Chemical analysis of worked disc
C | Si | Mn | P | S | Cr | Ni | Mo | Cu | V | M |
3.36 | 1.58 | 0.70 | 0.027 | 0.086 | 0.37 | 0.01 | 0.07 | 0.45 | 0.006 | 0.008 |
Ti | Co | Al | Sn | Pb | As | Sb | Zr | Nb | Fe | |
0.01 | 0.005 | 0.006 | 0.073 | 0.002 | 0.002 | None | Trace | 0.002 | Base |
3.2. Macro hardness test
Based on the ASTM E10-2018 test reference standard, the Brinell hardness test was done by using a bullet with a diameter of 2.5 mm and 187.5 kg/f of force at the points shown below in the cross section made from the disc. The test results are presented in Table 6.
Fig. 10Numbered position of damaged disc for hardness test
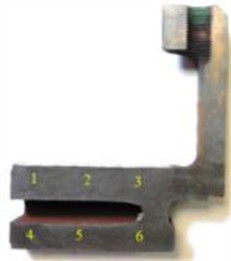
Table 6Hardness test of damaged disc
Position | Disc | |
1 | FD | 202 |
2 | 202 | |
3 | 198 | |
4 | BD | 202 |
5 | 195 | |
6 | 195 | |
3.3. Tensile test
This test was examined at room temperature and evaluated with JIS Z 2241-2012 standards as followed Table 7.
Table 7Numerical results of damaged disc in tensile test
Zone disc | Code test | Sample diameter (mm) | Cross-section | Tensile strength |
FD | TT1 | 8.01 | S0 (mm2) | Rm (MPa) |
hub | TT2 | 7.98 | 50.39 | 253 |
RD | TT3 | 7.97 | 50.01 | 270 |
3.4. Macroscopic structure
The size of the eutectic cells is measured in the cross-section of the part, specifically in the areas of the wheel-side disk and the back disk, following the preparation and macro-etching stages. In this process, the carbide areas in the intercellular network appear in a light color, while the structure inside the cells appears in a dark color. Fig. 11 displays the measurement results.
Fig. 11FD – Distribution and size of eutectic cell on cross- section, and RD – Eutectic cell boundaries
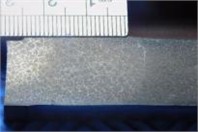
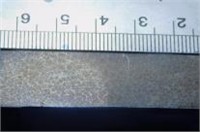
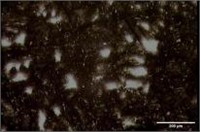
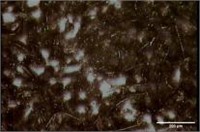
Table 8Result of eutectic
Disc | Eutectic cell size(mm) |
FD | Average 0.8 mm |
BD | Range 0.6-2.0 mm |
3.5. Microscopic structure
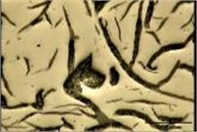
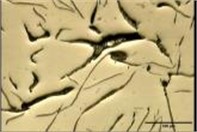
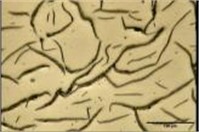
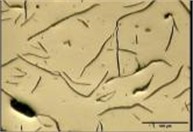
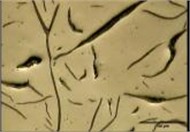
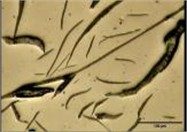
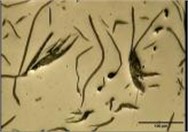
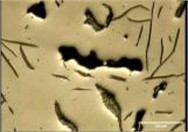
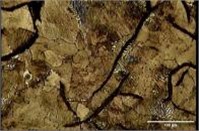
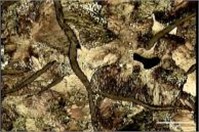
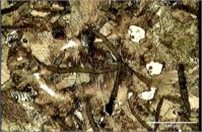
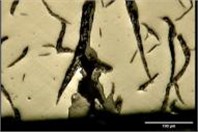
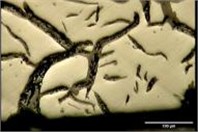
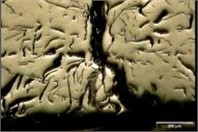
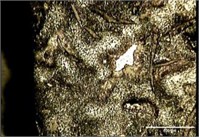
This study is based on the ASTM A247-19 standard. Based on studies with a light microscope, type VII sheet graphite with A and C distributions were made in the structure of both the back disk and the disk on the wheel side. The microscopic structure of the micro-cavity also showed shrinkage in the back disk and a scattered distribution of the MnS phase in both disks. Fig. 12 shows the distribution of graphite.
Fig. 13 shows that the graphite sizes generally fall within the range of class 3-4, with all these class 5 graphites (–69 and class 2) also visible in the structure.
Fig. 12Distribution graphite layers, a), b) FD – type C, c), d) FD – type A, e), f), g), h) BD – type C, shrinkage cavity
a)
b)
c)
d)
e)
f)
g)
h)
3.6. Post micro processing etching
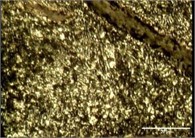
The cast iron base’s structure is completely pearlite in the middle after chemical etching, and the bulk carbide phase can be seen in the cell network. Perlite layers are typically observed with small layer intervals, and no structural tempering effects can be detected in the central areas. Fig. 14 shows images of the background structure in the central regions of the disk.
Fig. 13Size distribution of surface graphite on center and surface of FD
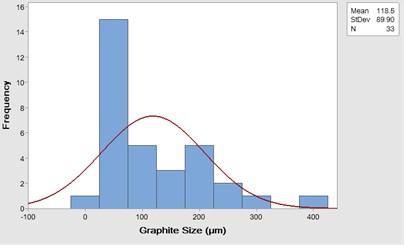
a) Surface
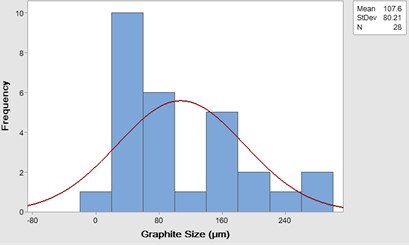
b) Center
Fig. 14Perlite transparency, a), b) FD, c), d) BD
a)
b)
c)
d)
3.7. Microscopic structure on surface
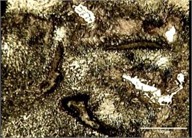
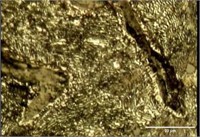
Internal oxidation is present around the graphite phase, and cracks are growing on the outside of both discs, specifically on the wheel side and the back side. This is due to the phenomenon of surface oxidation occurring in the absence of graphite. Some of these defects are shown in Fig. 15 and Fig. 16. Although the disc on the wheel side has deeper cracks, both discs have similar surface and internal oxidation.
Fig. 15Crack growth, and surface oxidation on surface of FD
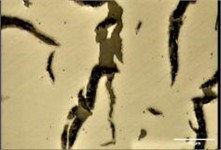
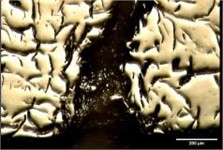
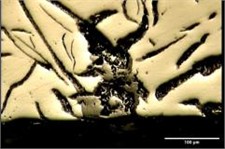
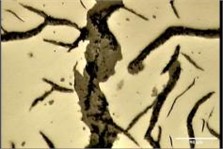
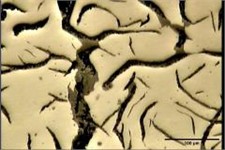
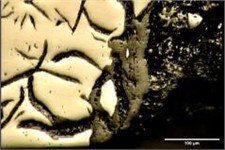
Fig. 16Crack growth, and surface oxidation on surface of BD
After etching, traces of cast iron were observed on the disk surface. On the outside of the wheel side disc, the ground structure is made up of tempered pearlite, some ferrite phase, and large white carbide particles. Pearlite tempering has caused cementite particles to be crushed and spherical. The ferrite phase is not observed on the outer surface of the back disc, but the effects of tempering the pearlite background are still evident. In this area, masses of white carbide can be observed in the microscopic structure. Figs. 17 and 18 provide microscopic images of the background.
Fig. 17Tempering perlite, whiten ferrite phase, and Carbide particles results on FD
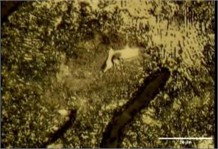
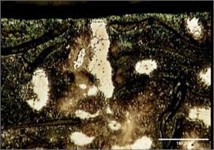
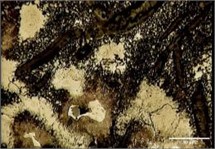
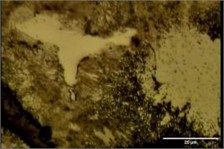
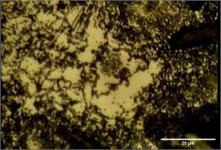
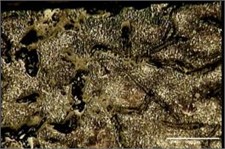
Fig. 18Tempering perlite and Carbide particles on external surface of FD
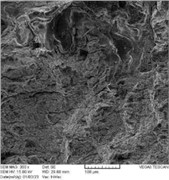
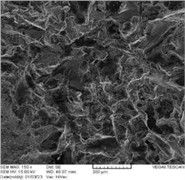
3.8. Electron microscope results
This section focuses on the study of microscope structure. In the examination by electron microscope, traces of intense oxidation were seen in the crack opening and then in the path of crack propagation in the thickness. Oxides and relatively significant amounts of sulfur represent the effects of oxidation (Fig. 19).
Fig. 19Internal oxidation on surface and edge of crack in FD

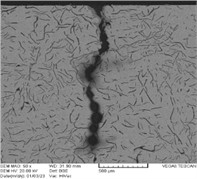
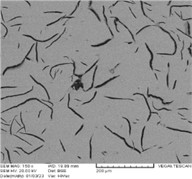
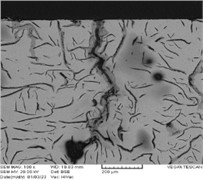
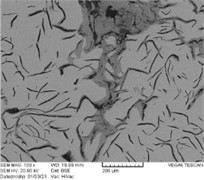
Table 9Chemical results of external surface of FD
Element | Series | UNN. C [wt.- %] | Norm. C [wt.- %] | Atom. C [at. -%] |
Carbon | K series | 0.46 | 0.49 | 1.51 |
Oxygen | K series | 17.31 | 18.27 | 42.45 |
Silicon | K series | 1.47 | 1.55 | 2.05 |
Sulfur | K series | 1.74 | 1.83 | 2.13 |
Chromium | K series | 0.17 | 0.17 | 0.12 |
Manganese | K series | 0.52 | 0.55 | 0.37 |
Iron | K series | 73.12 | 77.14 | 51.36 |
Total | 94.8 % |
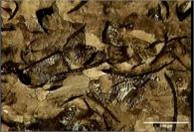
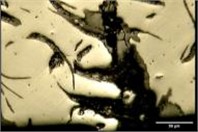
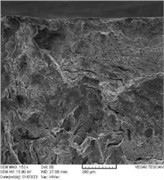
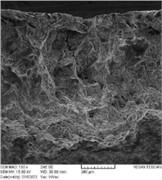
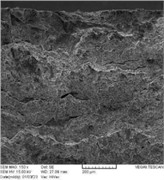
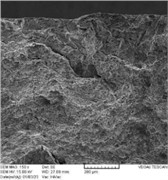
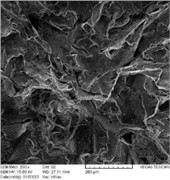
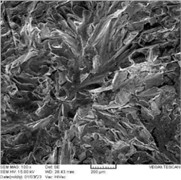
3.9. Fractography
The fracture surface of one of the wheel side disc cracks was examined by an electron microscope. In Fig. 20, the results of studies in the vicinity of the edge of the external surface indicate the propagation of microscopic cracks from this surface. The effects of surface oxidation can be seen in the vicinity of the surface. Propagated cracks have grown from the surface in the thickness direction. However, a large number of oblique cracks can also be seen. These cracks probably developed in the oxidized boundary of sheet graphite. However, many secondary cracks parallel to the surface can be seen below the fracture edge. These cracks indicate the propagation of fatigue failure on the fracture surface. The morphology of the fracture surface confirms the existence of rough graphite in the surface and central areas. In the central areas, the effects of forced fracture can be seen with signs of soft fracture areas in the background.
Fig. 20Layered graphite and soft fracture on surface center of RD
This section, compared with the SAE J431-2000 standard, is related to automotive parts made of gray cast iron and therefore provides more detailed information regarding the permissible limits of brake disc parts.
3.10. Chemical compound
For disc fabrication, the minimum equivalent carbon is 3.4 wt%. The following table shows the general chemical composition of gray cast iron used in car parts manufacturing. It is also possible to add alloy elements based on the requirements of mechanical properties as followed Table 10.
Table 10Typical base compositions [31]
Iron grad | Designation | Carbon | Silicon | Manganese | Sulfu (max) | Phosphorus (max) | C.E. |
G7 | G1800h | 3.50-3.7 | 2.3-2.8 | 0.6-0.9 | 0.14 | 0.25 | 4.35-4.55 |
G9 | G2500 | 3.4-3.65 | 2.1-2.5 | 0.6-0.9 | 0.12 | 0.25 | 4.15-4.40 |
G10 | G3000 | 3.35-3.6 | 1.9-2.3 | 0.6-0.9 | 0.12 | 0.20 | 4.05-4.30 |
G11 | G3000 | 3.3-3.55 | 1.9-2.2 | 0.6-0.9 | 0.12 | 0.10 | 4.00-4.25 |
G12 | G3500 | 3.25-3.5 | 1.9-2.2 | 0.6-0.9 | 0.12 | 0.10 | 3.95-4.20 |
G13 | G4000 | 3.15-3.4 | 1.9-2.1 | 0.7-1 | 0.12 | 0.08 | 3.80-4.05 |
Iron Grad | Designation | Carbon | Silicon | Manganese | Sulfu(max) | Phosphorus(max) | C.E. |
The formula for the carbon equivalent (C.E.) is: C. E.= %C+(1/3) %Si.
Based on this information, the chemical composition of both destroyed and used parts is close to the minimum set in terms of total carbon. However, comparing Tables 4, 5, and 10, it can be seen that the amount of silicon and equivalent carbon in both pieces is considered lower than the recommended standard limits. Chrome and copper elements have also been added to both pieces to reach and adjust the strength/hardness ratio (/).
3.11. Hardness
Based on the hardness limits of the destroyed piece in Table 6 considers it equivalent to Grade H18. However, the piece’s hardness is close to the minimum hardness for Grade H20.
3.12. Microscopic structure
The standard criteria for grade selection are presented in Tables 11 and 12, depending on the application conditions. Therefore, perlite, a layer with less than 5 % ferrite, is used for the construction of brake discs in special applications of the ground structure. Taking into account the hardness number of the piece, the pearlite structure paired with type A VII graphite serves as the criterion for selecting the correct microstructure. By comparing the results of the microscopic structure, it can be seen that the structure of the destroyed disk is consistent with the standard of pearlite with less than 5 % ferrite. However, upon examining the graphite structure, it is evident that it also contains a percentage of type C graphite, in addition to type A (see Tables 11 and 12).
3.13. Tensile strength
Given the G11H18-grade piece’s hardness value, it can be considered equivalent to the destroyed disc piece. This grade is equivalent to the previous SAE G3000 marking. Based on this criterion of 0.11 MPa, the minimum strength of the load test sample is calculated to be about 198 MPa. According to the SAE G3000 grade, the minimum strength for the load test is 225 MPa. Considering disk thickness, these limits are the part's minimum acceptable limits. A higher grade is G11H20, and its minimum load test tensile strength is 220 MPa. This grade is equivalent to SAE G3500, with a minimum tensile strength of 250 MPa. Comparing the tensile properties of the parts in Table 6 shows that the area of the wheel side disc corresponds to the minimum strength of both grades, while the rear disc is very close to the minimum grade of G11H20.
Table 11Special requirements [39]
Designator | Application | Requirements |
a | Brake drums and discs and clutch plates for special service | – Total carbon 3.4 % minimum – Microstructure: Lamellar Pearlite. Ferrite < 15 %* |
b | Brake drums and discs and clutch plates for special service | – Total carbon 3.4 % minimum – Microstructure: Lamellar Pearlite. Ferrite < 5 % |
c | Brake drums and discs and clutch plates for special service | – Total carbon 3.4 % minimum – Microstructure: Lamellar Pearlite. Ferrite < 5 % |
d | Alloy hardenable gray iron automotive camshafts** | – Chromium shall be 0.85 to 1.50 % – Molybdenum shall be 0.4 to 0.6 % – Microstructure of cam nose: Extending to 45 degree on both sides of cam nose centerline and to minimum depth of 3.2 mm from the surface shall consist of primary carbide (cellular and/or acicular) and graphite in a matrix of fine pearlite – The amount of carbide in the cams and method of checking shall be specified by the purchaser – Casting Hardness check location shall be on a bearing surface |
*See ASTM E 562 **As-cast requirements. Camshafts may be flame or induction hardened to specified hardness and depth on cam surfaces | ||
Table 12Typical microstructures of reference grades [39]
SAE casting grade | Previous designation | Microstructure graphite* | Microstructure matrix |
G9H12 | G1800 | Type VII A & B | Ferritic-Pearlitic |
G9H17 | G2500 | Type VII A & B | Ferritic-Pearlitic |
G10H18 | G3000 | Type VII A | Pearlitic |
G11H18 | G3000 | Type VII A | Pearlitic |
G11H20 | G3500 | Type VII A | Pearlitic |
G13H19 | G4000 | Type VII A | Pearlitic |
G7H16 c | G4000 | Type VII A | Pearlitic |
G9H17 a | G1800 h | Type VII A, B, & C size 1-3 | Lamellar Pearlite |
G10H21 c | G2500 a | Type VII A size 2-4 | Lamellar Pearlite |
G11H20 b | G3500 b | Type VII A size 3-5 | Lamellar Pearlite |
G11H24 d | G4000 d | Type VII A & E size 4-7(1) | Pearlitic- Carbidic** |
*See ASTM A 274 **In cam nose, As cast. Matrix pearlite in cam may be transformed to tempered martensite by subsequent Flame or induction hardening | |||
3.14. Fracture mechanics
The findings of the studies indicate that the disk fragment was destroyed as a result of the application of thermal cyclic stresses. Numerous cracks have started on the outer surfaces of both the wheel side disc and the back disc and have grown in the thickness direction. However, the quantity of these cracks and their shallower penetration depth on the back disc’s surface indicate a less severe level of destruction in this disc. Crack formation was linked to surface oxidation. Under the surface, the interface between the ground and layered graphite is oxidized. The intense tempering of the pearlite background indicates that the temperature at the disc’s surface has risen too high. It is not possible to accurately estimate the surface temperature of the disk, but based on the destruction of perlite layers, it is clear that the temperature is overstated; it was steep (about 350-450 degrees Celsius) on the roads. This temperature led to the oxidation of both the ground’s boundary and the graphite layers, subsequently causing the rougher graphite layers to separate from the ground during the wearing process. On the outer surface of the non-uniform wheel side disc, the wear lines and wide band of wear indicate an increase in the intensity of wear in this area. The repetition of oxidation has caused the formation of holes and the propagation of cracks along the graphite layers’ boundary. All of the evidence indicates that component destruction was caused by heat checking and thermal fatigue. In the fracture studies, the observation of secondary cracks parallel to the outer surface of the disc confirms the fatigue mechanism in the development of the fracture. In these studies, several cracks have grown obliquely in the oxidized boundary of the background and graphite, in addition to those propagating from the surface. To ensure a comprehensive evaluation, this study follows a structured experimental approach, including brake disc material selection, microstructural and chemical analysis, mechanical property testing, and thermal fatigue assessment. This organization provides a systematic analysis of failure mechanisms and material degradation, addressing critical gaps in brake disc durability research.
4. Conclusions
This study provides a comprehensive investigation into the thermal fatigue failure mechanisms of heavy vehicle brake discs (BDs), emphasizing the influence of temperature fluctuations, material composition, and structural integrity on brake system durability. Through experimental analysis, including microstructural examination, mechanical property evaluation, and chemical composition analysis, critical failure patterns were identified, revealing the underlying causes of BD degradation. Key findings highlight that thermal fatigue-induced cracks originate and propagate due to cyclic thermal stresses, oxidation, and graphite morphology variations. The presence of Type C graphite and deviations in silicon and carbon content were found to reduce fatigue strength, making the material more susceptible to crack initiation and propagation. Furthermore, mechanical testing confirmed a decline in tensile strength and hardness, correlating with surface oxidation and heat-induced structural changes. The practical implications of this research extend to enhancing brake disc design and material selection. By refining graphite distribution, improving alloy compositions, and optimizing thermal resistance, manufacturers can significantly increase BD durability and reduce failure rates. Additionally, the study underscores the necessity of regular inspections and material quality control to mitigate catastrophic brake failures in heavy vehicles. In conclusion, this research not only advances the scientific understanding of BD thermal fatigue but also provides engineering recommendations for safer and more efficient braking systems. Future studies should explore advanced composite materials and real-time thermal monitoring techniques to further enhance brake disc performance and longevity. For prospective investigation, there suggest to research in different aspect of this paper, in preprocessing, by using LS-Dyna, static, dynamic and modal analyses of ANSYS are good recommends to determine natural frequencies, crashworthiness, damage, crack growth, heat transfer in operational frequencies [40-42], in manufacturing design, there are a lot techniques that can be practical to redesign fabrication process [43], theoretically, by using hybrid topology optimization with metaheuristic algorithms such as MOPSO, PSO, MOGA to present new model [44-47], experimentally, by using different strategies of optimal placement on surface of brake with PZTs are presented new signals for data processing of cracks and high temperature [48-51], finally, study of meta-cell for brake structure that is a kind of transferable structure in band gaps of natural frequencies [52], finally in control aspect, there can use different controller on vehicle handle precisely brake system through PWM, PID, H∞, sliding mode, and fuzzy set [53-55].
References
-
X. D. Nong, Y. L. Jiang, M. Fang, L. Yu, and C. Y. Liu, “Numerical analysis of novel SiC3D/Al alloy co-continuous composites ventilated brake disc,” International Journal of Heat and Mass Transfer, Vol. 108, pp. 1374–1382, May 2017, https://doi.org/10.1016/j.ijheatmasstransfer.2016.11.108
-
D. Karan Dhir, “Thermo-mechanical performance of automotive disc brakes,” Materials Today: Proceedings, Vol. 5, No. 1, pp. 1864–1871, Jan. 2018, https://doi.org/10.1016/j.matpr.2017.11.287
-
B. R., M. Nadarajan, A. Selokar, S. S. Kumar, and S. S., “Modelling and analysis of disk brake under tribological behaviour of Al-Al₂O₃ ceramic matrix composites/Kevlar® 119 composite/C/SiC-carbon matrix composite/Cr-Ni-Mo-V steel,” Materials Today: Proceedings, Vol. 18, pp. 3415–3427, Jan. 2019, https://doi.org/10.1016/j.matpr.2019.07.269
-
Y. Wu, Y. Liu, H. Chen, Y. Chen, and D. Xie, “An investigation into the failure mechanism of severe abrasion of high-speed train brake discs on snowy days,” Engineering Failure Analysis, Vol. 101, pp. 121–134, Jul. 2019, https://doi.org/10.1016/j.engfailanal.2019.03.014
-
M. Günay, M. E. Korkmaz, and R. Özmen, “An investigation on braking systems used in railway vehicles,” Engineering Science and Technology, an International Journal, Vol. 23, No. 2, pp. 421–431, Apr. 2020, https://doi.org/10.1016/j.jestch.2020.01.009
-
K. Handa, K. Ikeuchi, and F. Morimoto, “Temperature-dependent wear of tread-braked railway wheels,” Wear, Vol. 452-453, p. 203265, Jul. 2020, https://doi.org/10.1016/j.wear.2020.203265
-
X. Ma et al., “Investigation on braking performance and wear mechanism of full-carbon/ceramic braking pairs,” Tribology International, Vol. 142, p. 105981, Feb. 2020, https://doi.org/10.1016/j.triboint.2019.105981
-
M. R. Aulia Putra, P. S. Pratama, and A. R. Prabowo, “Failure of friction brake components against rapid braking process: A review on potential challenges and developments,” Transportation Research Procedia, Vol. 55, pp. 653–660, Jan. 2021, https://doi.org/10.1016/j.trpro.2021.07.096
-
D. Tan et al., “Evaluation of the wear resistance of aluminium-based hybrid composite brake discs under relevant city rail environments,” Materials and Design, Vol. 215, p. 110504, Mar. 2022, https://doi.org/10.1016/j.matdes.2022.110504
-
S. A. Awe, “Premature failure of an automobile brake disc: Effect of nonmetallic inclusions,” Engineering Failure Analysis, Vol. 137, p. 106263, Jul. 2022, https://doi.org/10.1016/j.engfailanal.2022.106263
-
A. J. Day and D. Bryant, Braking of Road Vehicles. Butterworth-Heinemann, 2022.
-
Y. Hui et al., “Fading behavior and wear mechanisms of C/C-SiC brake disc during cyclic braking,” Wear, Vol. 526-527, p. 204930, Aug. 2023, https://doi.org/10.1016/j.wear.2023.204930
-
D. J. Kim, C. S. Seok, J. M. Koo, W. T. We, B. C. Goo, and J. I. Won, “Fatigue life assessment for brake disc of railway vehicle,” Fatigue and Fracture of Engineering Materials and Structures, Vol. 33, No. 1, pp. 37–42, Dec. 2009, https://doi.org/10.1111/j.1460-2695.2009.01412.x
-
J. Wang, Y. Chen, L. Zuo, H. Zhao, and N. Ma, “Evaluation of thermal fatigue life and crack morphology in brake discs of low-alloy steel for high-speed trains,” Materials, Vol. 15, No. 19, p. 6837, Oct. 2022, https://doi.org/10.3390/ma15196837
-
W. Bena and H. G. Lemu, “Analysis of thermomechanical cracks of disc brake used in heavy trucks,” International Review of Mechanical Engineering (IREME), Vol. 16, No. 7, p. 365, Jul. 2022, https://doi.org/10.15866/ireme.v16i7.22331
-
G. Gigan, V. Norman, J. Ahlström, and T. Vernersson, “Thermomechanical fatigue of grey cast iron brake discs for heavy vehicles,” Proceedings of the Institution of Mechanical Engineers, Part D: Journal of Automobile Engineering, Vol. 233, No. 2, pp. 453–467, Nov. 2017, https://doi.org/10.1177/0954407017739723
-
F. Bagnoli, F. Dolce, and M. Bernabei, “Thermal fatigue cracks of fire fighting vehicles gray iron brake discs,” Engineering Failure Analysis, Vol. 16, No. 1, pp. 152–163, Jan. 2009, https://doi.org/10.1016/j.engfailanal.2008.01.009
-
J. Wang et al., “Numerical simulation and mechanism analysis of thermal fatigue crack for low-alloy steel brake disc of high-speed train,” International Journal of Rail Transportation, Vol. 12, No. 5, pp. 944–957, Sep. 2024, https://doi.org/10.1080/23248378.2023.2264866
-
X. Yin, S. Zhang, F. Guo, Z. Pang, Y. Rong, and B. Zhang, “Thermal stress simulation and fatigue life of commercial vehicle disk brakes under emergency braking conditions,” AIP Advances, Vol. 13, No. 12, Dec. 2023, https://doi.org/10.1063/5.0164109
-
T. J. Mackin et al., “Thermal cracking in disc brakes,” Engineering Failure Analysis, Vol. 9, No. 1, pp. 63–76, Feb. 2002, https://doi.org/10.1016/s1350-6307(00)00037-6
-
S. Bilgic Istoc and H. Winner, “Heat cracks in brake discs for heavy vehicles: development of a model to describe the formation of heat cracks in brake discs for heavy vehicles based on experimental research,” Automot. Eng. Technol., Vol. 3, pp. 61–68, 2018.
-
L. Augustins, F. Hild, R. Billardon, and S. Boudevin, “Experimental and numerical analysis of thermal striping in automotive brake discs,” Fatigue and Fracture of Engineering Materials and Structures, Vol. 40, No. 2, pp. 267–276, Jul. 2016, https://doi.org/10.1111/ffe.12495
-
G. Le Gigan, T. Vernersson, R. Lundén, and P. Skoglund, “Disc brakes for heavy vehicles: An experimental study of temperatures and cracks,” Proceedings of the Institution of Mechanical Engineers, Part D: Journal of Automobile Engineering, Vol. 229, No. 6, pp. 684–707, Oct. 2014, https://doi.org/10.1177/0954407014550843
-
K. T. Deressa and D. A. Ambie, “Non-axisymmetric modeling of a moving heat source for thermal stress and fatigue analysis of railway vehicle disc brakes,” Urban Rail Transit, Vol. 10, No. 1, pp. 42–64, Dec. 2023, https://doi.org/10.1007/s40864-023-00207-z
-
W. Sawczuk, M. Jüngst, D. Ulbrich, and J. Kowalczyk, “Modeling the depth of surface cracks in brake disc,” Materials, Vol. 14, No. 14, p. 3890, Jul. 2021, https://doi.org/10.3390/ma14143890
-
A. Belhocine and M. Bouchetara, “Temperature and thermal stresses of vehicles gray cast brake,” Journal of Applied Research and Technology, Vol. 11, No. 5, pp. 674–682, Oct. 2013, https://doi.org/10.1016/s1665-6423(13)71575-x
-
C. Blanco, J. Bermejo, H. Marsh, and R. Menendez, “Chemical and physical properties of carbon as related to brake performance,” Wear, Vol. 213, No. 1-2, pp. 1–12, Dec. 1997, https://doi.org/10.1016/s0043-1648(97)00221-4
-
R. Cai, J. Zhang, X. Nie, J. Tjong, and D. T. A. Matthews, “Wear mechanism evolution on brake discs for reduced wear and particulate emissions,” Wear, Vol. 452-453, p. 203283, Jul. 2020, https://doi.org/10.1016/j.wear.2020.203283
-
G. Bian and H. Wu, “Friction surface structure of a Cf/C-SiC composite brake disc after bedding testing on a full-scale dynamometer,” Tribology International, Vol. 99, pp. 85–95, Jul. 2016, https://doi.org/10.1016/j.triboint.2016.03.010
-
P. C. Verma, R. Ciudin, A. Bonfanti, P. Aswath, G. Straffelini, and S. Gialanella, “Role of the friction layer in the high-temperature pin-on-disc study of a brake material,” Wear, Vol. 346-347, pp. 56–65, Jan. 2016, https://doi.org/10.1016/j.wear.2015.11.004
-
M. Mathad et al., “Non-linear structural and thermal analysis of automotive brake disc,” Materials Today: Proceedings, Vol. 59, pp. 1221–1224, Jan. 2022, https://doi.org/10.1016/j.matpr.2022.03.426
-
A. Belhocine and M. Bouchetara, “Thermal analysis of a solid brake disc,” Applied Thermal Engineering, Vol. 32, pp. 59–67, Jan. 2012, https://doi.org/10.1016/j.applthermaleng.2011.08.029
-
W. Österle et al., “A comprehensive microscopic study of third body formation at the interface between a brake pad and brake disc during the final stage of a pin-on-disc test,” Wear, Vol. 267, No. 5-8, pp. 781–788, Jun. 2009, https://doi.org/10.1016/j.wear.2008.11.023
-
M. Mosleh, P. J. Blau, and D. Dumitrescu, “Characteristics and morphology of wear particles from laboratory testing of disk brake materials,” Wear, Vol. 256, No. 11-12, pp. 1128–1134, Jun. 2004, https://doi.org/10.1016/j.wear.2003.07.007
-
G. Le Gigan, M. Ekh, T. Vernersson, and R. Lundén, “Modelling of grey cast iron for application to brake discs for heavy vehicles,” Proceedings of the Institution of Mechanical Engineers, Part D: Journal of Automobile Engineering, Vol. 231, No. 1, pp. 35–49, Aug. 2016, https://doi.org/10.1177/0954407016632090
-
M. S. Ismail, O. Ifayefunmi, and A. H. Mazli, “Combined stability of cone-cylinder transition subjected to axial compression and external pressure,” Thin-Walled Structures, Vol. 157, p. 107102, Dec. 2020, https://doi.org/10.1016/j.tws.2020.107102
-
O. Ifayefunmi, M. S. Ismail, and M. Z. A. Othman, “Buckling of unstiffened cone-cylinder shells subjected to axial compression and thermal loading,” Ocean Engineering, Vol. 225, p. 108601, Apr. 2021, https://doi.org/10.1016/j.oceaneng.2021.108601
-
M. S. Ismail, O. Ifayefunmi, and S. H. S. Md Fadzullah, “Buckling analysis of stiffened cone-cylinder intersection subjected to external pressure,” Key Engineering Materials, Vol. 833, pp. 223–227, Mar. 2020, https://doi.org/10.4028/www.scientific.net/kem.833.223
-
“Automotive Gray Iron Castings,” SAE International, 400 Commonwealth Drive, Warrendale, PA, United States, SAE Standard J431_201801, Apr. 2022.
-
M. Hasanlu and M. Siavashi, “Modeling and comparison of mechanical behavior of foam filled and hollow aluminum tubes by LS-DYNA and introducing a neural network model,” Journal of simulation and analysis of novel technologies in mechanical engineering, Vol. 8, No. 4, pp. 275–293, Jan. 2020.
-
M. Rostami, M. Hasanlu, M. Siavashi, and A. Bagheri, “Modeling of dynamic axial crushing of thin-walled structures by LS-DYNA and genetic programming,” in 3rd International Conference on Researches in Science and Engineering, 2017.
-
M. Hasanlu, S. G. Mirhosseini, M. Sadeghzadeh, and A. Bagheri, “Modal analysis turboshaft test stand motor designed by using ANSYS,” Journal of simulation and analysis of novel technologies in mechanical engineering, Vol. 10, No. 1, pp. 781–796, 2020.
-
M. Hasanlu and S. Mokary, “Review of the parameters influence of incremental forming between 1960 and 2019,” Journal of. Mechanical Engineering and Vibration, Vol. 10, No. 1, pp. 32–45, 2019.
-
M. Hasanlu, M. Siavashi, and A. Bagheri, “Vibration attenuation Timoshenko beam based on optimal placement sensors/actuators PZT patches with LQR-MOPSO,” Iranian Journal of Mechanical Engineering Transactions of the ISME, Vol. 17, No. 1, pp. 26–60, 2016.
-
M. Hasanlu and A. Bagheri, “Optimal locations on Timoshenko beam with PZT S/A for suppressing 2DOF vibration based on LQR-MOPSO,” Journal of Solid Mechanics, Vol. 10, No. 2, pp. 364–386, 2018.
-
M. Hasanlu and A. Bagheri, “Intelligent control smart Timoshenko beam by using MOPSO-PID controller based on optimal location PZT patch actuator approach,” System Dynamics and Solid Mechanics, Vol. 20, No. 3, pp. 6–28, 2018.
-
M. Karami Gavgani, M. Hasanlu, and M. Nikkho, “Optimal position control of nonlinear muscle based on sliding mode and particle swarm optimization algorithm,” Transactions on Machine Intelligence, Vol. 5, No. 1, pp. 37–45, Dec. 2022, https://doi.org/10.47176/tmi.2022.37
-
M. Hasanlu, M. Siavashi, M. Soltanshah, and A. Bagheri, “Fuzzy-PID controller design for random vibration attenuated smart cantilever Timoshenko beam based on MOGA algorithm,” in 4th National and 2nd International conference on Applied Research in Electrical, Mechanical and Mechatronics Engineering, 2017.
-
M. Hasanlu, A. Bagheri, and F. Najafi, “Optimal placement of piezoelectric S/A for active vibration control of engineering structures by using controller design,” Research and Reviews: Journal of Engineering and Technology, Vol. 5, No. 4, pp. 22–44, 2016.
-
M. Hasanlu, “Experimental condition monitoring of unbalanced rotary shaft based on ANFIS by using piezoelectric sensor,” Journal of Mechanical Engineering and Vibration, Vol. 11, No. 1, pp. 66–75, 2020.
-
M. Hasanlu, “Clearance prediction of rotary system with and without mechanical diagnosis by using artificial neural networks and particle swarm optimization,” Journal of Mechanical Engineering and Vibration, Vol. 11, No. 2, pp. 7–11, 2020.
-
M. Hasanlu, M. Siavashi, and A. Bagheri, “Free vibration analysis of metamaterial functionally graded plates with quasi-zero stiffness resonators,” Noise and Vibration Worldwide, Vol. 54, No. 2-3, pp. 108–121, Jan. 2023, https://doi.org/10.1177/09574565231154248
-
M. Hasanlu and M. Siavashi, “Nonlinear control of quadrotor trajectory with discrete H∞,” Journal of Mechanical Engineering, Automation and Control Systems, Vol. 6, No. 1, pp. 1–13, Jan. 2025, https://doi.org/10.21595/jmeacs.2024.24602
-
M. Siavashi and M. Hasanlu, “Experimental optimal control of servo-pneumatic with sliding mode and GA-fuzzy-PID-PWM,” Journal of Mechatronics and Artificial Intelligence in Engineering, Vol. 5, No. 2, pp. 199–214, Dec. 2024, https://doi.org/10.21595/jmai.2024.24656
-
F. Salari and M. Hasanlu, “Optimal model predictive fuzzy control of DC-DC convertor,” Advanced Control for Applications, Vol. 6, No. 1, Dec. 2023, https://doi.org/10.1002/adc2.169
About this article

The authors have not disclosed any funding.
The datasets generated during and/or analyzed during the current study are available from the corresponding author on reasonable request.
Mojtaba Hasanlu: supervision, writing-original draft preparation, writing-review and editing, visualization. Fatemeh Shirvani: formal analysis, conceptualization, methodology, validation. Siavash Mahdian: funding acquisition, conceptualization, methodology, resources.
The authors declare that they have no conflict of interest.
