Abstract
To investigate the safe thickness and mining-induced stability of boundary pillars during the transition from open-pit to underground mining, a specific open-pit to underground mining project was selected as the research background. A three-dimensional fine-scale model of the mining area was constructed using coupled modeling technology with MIDAS-GTS/NX and FLAC3D. The deformation and displacement, stress distribution, and evolution of plastic zones of the open-pit slope, underground stope, and isolation pillars were studied under the full lifecycle conditions of the mining area. The stability of the open-pit slope, underground stope, and boundary pillars was clarified. The results showed that backfilling and remediation of the open-pit slope can effectively prevent slope disasters. The untreated open-pit slope exhibited deformation and displacement, with a maximum displacement of 1.0 cm to 1.2 cm. The maximum compressive stress in the open-pit area was 1.5 MPa to 3 MPa, and the maximum tensile stress was 0.24 MPa to 0.34 MPa, indicating a low likelihood of tensile failure in the surrounding rock. No plastic zone distribution was observed on the slope of No. 2 open-pit, while localized plastic zones were present in the backfilled waste rock of No. 1 open-pit. The maximum deformation and displacement of the surrounding rock in the underground stope were 7 mm to 9 mm, occurring at the stope roof. The maximum compressive stress in the underground stope area was 2 MPa to 4.5 MPa, and the likelihood of compressive failure in the surrounding rock was low. Localized plastic zones were observed in the stope fill, but no breakthrough occurred between adjacent stopes. The deformation and displacement of the isolation pillars were minimal, below the determination criteria. An isolation layer of 45 m between the open-pit and underground areas effectively isolated the mining-induced disturbances from underground operations, preventing the impact of underground mining activities on the upper open-pit area. The slopes of No. 1 and No. 2 open-pits are currently stable. Underground mining has not yet had a significant impact on the open-pit area, and the underground mined-out areas are in a stable state.

Highlights
- The reliability of the model was verified through comparison with field monitoring data, providing an integrated analytical approach for stability assessment in open-pit to underground transition mining.
- A coupled modeling technique integrating MIDAS-GTS/NX and FLAC3D was developed to construct a high-fidelity 3D numerical model incorporating topography, geological structures, and mining voids.
- For the first time, a systematic investigation of the synergistic response mechanisms of slopes, stopes, and isolation pillars was conducted for an "open-pit–underground" synergistic mining system under full lifecycle conditions.
- A dynamic feedback-based design methodology for isolation pillar thickness was proposed and validated through numerical simulation, demonstrating the effectiveness of a 45 m thick pillar in isolating mining-induced disturbances.
- A large-scale engineering model comprising 233 entities and nearly 600,000 elements was constructed, achieving high-fidelity simulation of complex geological and mining conditions.
1. Introduction
When ore bodies occur near the surface, open-pit mining is generally employed. As mining reaches deeper levels, the stability of formed deep concave open-pit slopes becomes challenging to guarantee. To achieve sustainable ore extraction, the transition from open-pit to underground mining can be adopted. This hybrid mining method typically involves initial open-pit exploitation in upper sections followed by underground mining in lower sections [1-3]. During the transitional phase from open-pit to underground mining, the thickness of boundary crown pillars, the stability of open-pit slopes, and the integrity of underground workings form the foundation for safe and stable transition [4-6]. Consequently, it is imperative to investigate the safety thickness of isolation pillars and mining stability during open-pit to underground transition.
Regarding the thickness of boundary pillars in transitional mining [7-8], open-pit slope stability [9-10], and underground mining stability [11-12], scholars have conducted extensive research. Wang et al. [13] proposed a scientific methodology integrating theoretical calculations and numerical simulations to determine boundary pillar thickness under tailings backfill conditions. This approach first modified the K. B. Ruppeneit formula by incorporating slope angle and tailings backfill height to obtain preliminary pillar thickness values. Liu et al. [14] applied theoretical calculations and engineering analogies to determine boundary pillar dimensions for an iron mine undergoing open-pit to underground transition. FLAC3D simulations analyzed pillar displacement and stress evolution during mining, ultimately identifying 40 m as the optimal pillar thickness. Li et al. [15] employed remote sensing, field surveys, and numerical modeling to investigate slope deformation mechanisms and surface subsidence characteristics, elucidating the evolutionary processes of open-pit landslides and ground collapse induced by underground extraction. Zhao et al. [16] established a 3D numerical model aligned with mine conditions, identified critical cross-sections of safety crown pillars, and developed 2D models to explore stability evolution under blasting vibrations during transition mining at Longshou Mine. Lan et al. [17] applied Laubscher’s method to determine caving angles and boundaries at Hainan Shilu Iron Mine, combined FLAC3D simulations with interpolation grids and surface deformation calculations to delineate subsidence zones across mining stages, and validated results through UAV photogrammetric models. Li et al. [18] investigated displacement and stress field variations in isolation layers during underground ore extraction via theoretical and FLAC3D analyses, determining a safe isolation layer thickness range of 11.43-31.18 m. Sun et al. [19] optimized roof thickness for interconnected stopes at Zijinshan Gold-Copper Mine using five classical theoretical formulas and FLAC3D simulations, proposing optimal stope span configurations.
In summary, previous research has established a foundation for assessing boundary pillar safety and mining stability through theoretical analyses, numerical simulations, and engineering analogies. Commonly employed methods include modifications to empirical formulas and the use of software such as FLAC3D for mechanistic analysis. However, several key challenges persist. Firstly, many studies rely on simplified 2D models or limited-scale 3D models, which struggle to capture the full complexity and large-scale interactions inherent in a combined open-pit and underground mining system. Secondly, there is often a focus on analyzing individual components (e.g., the pillar alone or the slope alone) rather than conducting a holistic, system-wide evaluation of their synergistic behavior throughout the entire mining lifecycle from excavation to closure. Thirdly, the construction of high-fidelity, engineering-scale models that seamlessly integrate detailed topography, geological structures, and mining voids for accurate representation of in-situ conditions remains a significant challenge, often limiting the predictive reliability of simulations.
Focusing on a large-scale metal mine in Southwest China featuring a unique “open-pit-underground” synergistic mining system, this study conducted systematic investigations through geological mapping, rock mass discontinuity surveys, and core sampling. Field investigations yielded critical data on engineering geological conditions, rock mechanical parameters, and mining disturbance characteristics. Leveraging multisource data fusion, an innovative coupled modeling approach integrating MIDAS-GTS/NX and FLAC3D was developed, capitalizing on the former's strength in complex geological modeling and the latter's prowess in geotechnical nonlinear analysis. The resulting high-resolution 3D numerical model (590,000 elements) accurately incorporates topography, geological structures, and mining voids, faithfully representing in situ geological conditions.
Numerical simulations systematically investigated the synergistic response mechanisms of open-pit slopes, underground stopes, and isolation pillars throughout the mine lifecycle (initial extraction → production ramp-up → post-closure). The research not only reveals mechanical response patterns in “open-pit-underground” hybrid mining systems but also innovatively proposes a dynamic feedback-based design methodology for isolation pillar thickness. These findings provide critical theoretical support for deep resource co-development, mining hazard prevention systems, and smart mine construction.
2. Geological conditions of the mining area
2.1. Hydrogeological conditions
The regional hydrogeological survey area is characterized by denudation-accumulation topography within a low mountainous hilly region. The terrain slopes from north to south, located at the northern margin of the Taozao Basin hydrogeological unit, within the recharge area of a minor watershed. The southern low-lying area exhibits progressively decreasing southward gradients, forming a NW-SE trending hilly zone. The northern regional elevation peak (+324.90 m) is situated at Ximashan, while the lowest point (+70.00 m) occurs near Mengzhuang. The southern Quaternary coverage area gradually descends southward, with the Shiliquan spring group located 11 km from the mining area and the lowest discharge point at +55.00 m, representing the regional hydrogeological base level.
The drainage system is moderately developed, with four seasonal tributaries of the Guoji River (a branch of the Dasha River) distributed east-west across the mining area. These ephemeral streams remain dry in spring but convey water during rainy seasons, eventually meandering southward into the Dasha River.
The primary water-filling source for underground mining is directly recharged by bedrock fracture aquifer formations. The orebody’s roof and floor strata consist of biotite granulite, which is characterized by high rock strength, relatively intact structure, poorly developed fractures, low water-bearing capacity, and weak hydraulic conductivity. These properties ensure minimal hydrogeological impacts on deep mine workings and water inflow.
2.2. Engineering geological conditions
The orebody occurs within metamorphic strata of the Taishan Group Shancaoyu Formation. The roof and floor strata are primarily composed of biotite granulite and quartz-hornblende schist, maintaining conformable contact with the orebody.
Biotite granulite, gray-black in color, is distributed throughout the mining area, exhibiting fine-grained xenoblastic texture and banded structure. Surface exposures are intensely weathered, with most weathered materials eroded. The weathering depth ranges 0.00-49.50 m: strongly weathered zones display granular disintegration and low strength (easily crumbled by hand), while moderately weathered rocks occur as blocky fragments with higher strength but discontinuous structure. The stratum thickness decreases east-westward and thickens centrally. Shallow rock masses are fractured with developed joints and low mechanical strength, indicating poor engineering geological conditions. Deep fresh bedrock demonstrates relative integrity, high strength, and limited joint development (joint frequency: 2-3 joints/m), exhibiting weak water-bearing capacity. The rock exhibits favorable physico-mechanical properties, with saturated compressive strength of 82.7-157.3 MPa and shear strength of 7.97-12.5 MPa, classifying as hard rock.
Quartz-hornblende schist, dark green and unevenly distributed, locally occurs in orebody roof/floor strata with 1-2 m thickness. It displays granoblastic texture, schistose structure, and pronounced foliation. This rock type exhibits poor compressive/shear strength but similar hydro-mechanical behavior to biotite granulite.
The steeply dipping stratified/semi-stratified orebody comprises magnetite-hornblende quartzite, magnetite-quartz hornblendite, and biotite-hornblende schist. These ore-bearing rocks exhibit granoblastic or schistose textures with striated, banded, or foliated structures. Their hydro-mechanical properties mirror surrounding strata, showing weak water-bearing capacity. The discontinuous orebody, influenced by faulting, maintains relative integrity with undeveloped fractures and high mechanical strength (saturated uniaxial compressive strength: 263.7 MPa; shear strength: 15.8 MPa), classified as extremely hard rock.
2.3. Rock mechanics parameters
Specimens for rock mechanics testing were prepared from field-collected rock blocks. Standard specimens were manufactured from three rock types: surface waste rock, surrounding rock, and orebody, all maintained in their natural moisture state. Tested parameters included unit weight, elastic modulus, Poisson’s ratio, compressive strength, tensile strength, cohesion, and internal friction angle.
Given scale discrepancies between laboratory specimens and in situ rock masses, rock mechanics parameters were converted to engineering-scale values through empirical methods including RQD classification, CSIR and Q-system classifications, GSI classification, and geotechnical code-based approaches [20]. Comprehensive reduction factors were applied to derive underground rock mass parameters. Backfill mechanical parameters were obtained through backfill testing, while fault mechanical parameters were determined via laboratory experiments, as detailed in Table 1.
Table 1Mechanical parameters of mineral rock mass
Rock material | Natural gravity (kN/m3) | Elastic modulus (GPa) | Poisson’s ratio | Cohesion (MPa) | Internal friction angle / (°) |
Surface waste rock | 26.75 | 6678.3 | 0.16 | 2.22 | 30.5 |
Biotite granulite | 26.79 | 16538.9 | 0.22 | 5.33 | 35.0 |
Ore body | 33.76 | 17782.7 | 0.12 | 10.2 | 37.0 |
Tailings filling material | 23.7 | 50 | 0.35 | 0 | 25.0 |
3. Current mining status
3.1. Open-pit status
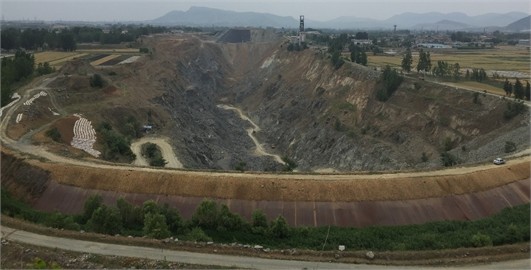
Two surface pits (No. 1 and No. 2 open-pits) are present. No. 1 open-pit has been backfilled using surrounding waste rock piles, tailings sand generated during mining operations, and tailings from the tailings pond. After backfilling, the pit mouth was leveled with crushed stone soil. A layer of cultivated soil was subsequently applied to the leveled surface. While No. 1 open-pit has been fully rehabilitated, No. 2 open-pit remains unbackfilled (Fig. 1).
Fig. 1Current situation of unfilled No. 2 open-pit (Wang Feifei, taking photos in Shandong, China on July 15, 2025)
3.2. Underground mining status
The mine is divided into three sectors according to the design plan: Eastern Mining Area (Line –56 to –70, strike length ~1,400 m). Western Mining Area (Line –70 to –106, strike length ~3,600 m). Western Periphery Mining Area (Line –106 to –123, strike length ~1,700 m). Construction in the Eastern Mining Area has been suspended due to incomplete relocation of Hengshanqian Village on the surface. Only one vertical shaft has been completed in this sector. The Western Mining Area and Western Periphery Mining Area are currently in normal production following safety facility completion acceptance.
The underground workings are divided into five levels from top to bottom: ±0 m, -55 m, –110 m, –165 m, and –220 m, with each level interval measuring 55 m. The -220 m level is currently the active production horizon. The IV-2 and III-1 orebodies are being extracted using two methods: Shallow-Hole Shrinkage Stoping with Subsequent Backfill. VCR (Vertical Crater Retreat) Method with Subsequent Backfill. Six production stopes (762, 772, 782, 852, 902, and A2) are operational at the -220 m level. Among these, stopes 762, 772, 782, 852, and A2 employ shallow-hole shrinkage stoping with subsequent backfill, while stope 902 utilizes the VCR method with subsequent backfill.
4. Numerical model and research scheme
4.1. Fine modeling method for multi-source data coupling
The mining area is characterized by denudation-accumulation topography within a hilly region, with higher elevations in the north and gentle slopes in the south. The ground elevation ranges from +77.50 m to +271.00 m, creating a relative relief of 193.50 m. The open-pit area is primarily situated on plains surrounded by farmland. Based on mine-provided drawings, a surface model was established in MIDAS-GTS/NX software. Three-dimensional solid models of surface open pits, ore bodies, stopes, and pillars were created through extrusion commands. The established surface model was extended into a solid model, while previously generated void entities were displayed in the software. The model origin and boundary dimensions were defined according to computational spatial requirements. Mining zone entities were embedded into the global model, forming internal mining districts as shown in Fig. 2. The model measures 3,130 m in length, 1,450 m in width, and 595 m in height.
Fig. 2Process of establishing the overall model of the research area (unit: m): a) surface topographic map; b) surface model established in software; c) design drawing for underground mining; d) underground mining ore body model; e) three-dimensional numerical model

Stope dimensions (50 m width × orebody thickness) were modeled at 1:1 scale using the mine’s latest design drawings. The model incorporates surface open pits, ore bodies, and various rock masses, totaling 233 entities. Materials including surface waste rock, biotite granulite, ore-rock, and tailings backfill were included. Surface soil layers were not separately modeled due to minimal thickness and negligible impact.
Three-dimensional mechanical analysis required mesh generation. Given the model’s large scale, non-critical regions were assigned coarse meshes (20 m density) to optimize computational efficiency, while critical components (ore bodies, backfill, crown pillars) received refined meshes (2 m density with 1 m node spacing). The final mesh contained 691,107 nodes and 593,762 elements.
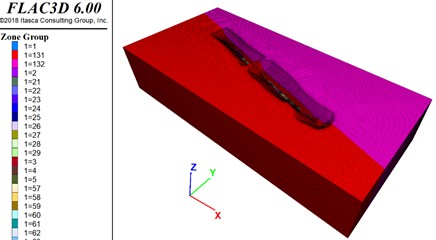
The global model was exported from MIDAS-GTS/NX as a neutral file containing node/element information [21]. Through the MIDAS-FLAC converter, this data was transformed into FLAC3D-compatible *.f3grid format. The FLAC3D model (Fig. 3) was generated via the import command in the Grid module.
Fig. 3FLAC3D computational model
Boundary conditions were applied as follows: -direction constraints on all nodes in -plane (sliding hinges). -direction constraints on all nodes in -plane (sliding hinges). Full fixation (--) on nodes in the lowest -plane (fixed hinges). Initial geostatic stress calculation considered gravitational effects exclusively, given the maximum mining depth (~220 m) and simple geological structure [22-24].
Fig. 4FLAC3D calculation model stress balance process
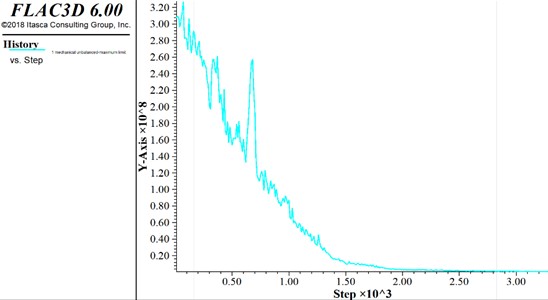
A mesh sensitivity analysis was conducted to ensure the numerical results were independent of element size (Fig. 4). Three global mesh densities with average element sizes of 25 m (coarse), 10 m (medium), and 5 m (fine) were tested, with proportional refinement in the critical regions (ore body, stopes, and boundary pillar). The key output parameters, namely the maximum vertical displacement at the crest of Open-Pit No. 2 and the maximum principal stress within the boundary pillar, were monitored. The results showed that the change in these values was less than 2 % when the mesh was refined from the 5 m (fine) configuration to an even finer 3 m configuration. Therefore, the 5 m global mesh (with 2 m local refinement in critical zones) was selected for all subsequent simulations, as it provided a converged solution with optimal computational efficiency. The final mesh contained 691,107 nodes and 593,762 elements.
4.2. Simulated mining scheme
Based on the content and objectives of this study, the main tasks include: 3D modeling and numerical simulation of the original open-pit slope mining and backfilling; 3D modeling and numerical simulation analysis of the isolation top pillar under the current mining conditions; stability analysis of different thickness schemes for the isolation top pillar; and determination of reasonable parameters for the isolation top pillar, underground mining sequence, and stope structure. To achieve the above research objectives, a 3D numerical simulation method will be employed to simulate the mining methods and sequence, reproducing the geo-stress and surrounding rock deformation of the mine. Based on the numerical simulation results, the designed mining plan will be evaluated.
The numerical simulation plan is as follows: Step 1: Geo-stress equilibrium → Step 2: Mining No. 1 open-pit → Step 3: Mining No. 2 open-pit → Step 4: Backfilling No. 1 open-pit → Step 5: Underground stope mining to the current status. Given the isolation layer thickness of 45 m designed for the mine, the mining process of the ore body in the underground stope will be simulated to investigate the deformation, displacement, and stress of the isolation layer, thereby determining whether the thickness of the isolation layer is reasonable.
The selection of this specific sequence was based on two primary criteria: (1) Historical Accuracy: to faithfully replicate the actual chronological order of excavation and remediation activities at the mine, ensuring the stress evolution in the model mirrors the field conditions. (2) Mechanical Criticality: this sequence creates a conservative scenario where the boundary pillar is first unloaded by open-pit excavation and then loaded by subsequent underground mining, allowing us to evaluate its stability under the most demanding conditions. The mining steps simulate the bulk extraction of entire stopes or large sections, a standard approach in elastoplastic models to analyze the final equilibrium state after each major phase of excavation. The model's equilibrium was confirmed after each step by a significant reduction in the maximum unbalanced force.
Given the isolation layer thickness of 45 m designed for the mine, the mining process of the ore body in the underground stope was simulated to investigate the deformation, displacement, and stress of the isolation layer, thereby determining whether the thickness of the isolation layer is reasonable. The impact of this key parameter (45 m thickness) on overall mining stability is presented and discussed in detail in Section 4 (Analysis of results), focusing on its effectiveness in controlling displacement, stress redistribution, and plastic zone development.
4.3. Stability assessment criteria
According to the allowable values for displacement and deformation required by different protection levels specified in relevant regulations [25-26], the criteria for determining the impact of underground mining on surface stability in mining areas are deformation ± 2 mm/m, inclination ± 3 mm/m, and curvature ± 0.2×10⁻³/m.
The criterion for determining the deformation and displacement of underground rock formations based on the analogy of underground mining experience is that displacements below 20 mm have little effect on the stability of the rock mass. A displacement of 20-50 mm can maintain the stability of the rock mass. Displacement on the order of 50-100 mm poses potential stability issues for the rock mass 100 mm belongs to the problem of large deformation displacement, and there is a phenomenon of rock mass failure, which may also occur on a large scale. In addition to using deformation displacement as a criterion, comprehensive judgment is assisted by stress magnitude and plastic zone distribution [27-28]. This numerical simulation used indicators such as maximum unbalanced force, rock stress, surface displacement, and plastic zone distribution to determine mining stability.
These quantitative criteria provide the benchmark for our stability assessment. In the following sections, the results from the numerical simulation – including the magnitude and distribution of displacements, the values of induced stresses compared to rock mass strengths, and the extent of plastic zones – will be rigorously evaluated against these standards to conclusively determine the stability of the open-pit slopes, underground stopes, and the boundary pillar.
5. Analysis of results based on numerical simulation
5.1. Stability of existing surface open pits
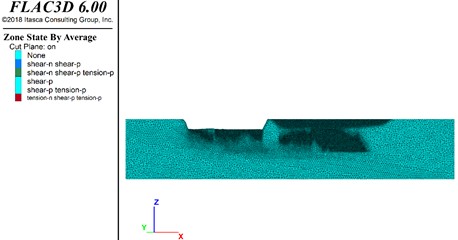
The mining process was simulated numerically to reproduce open-pit and underground extraction, yielding deformation displacements, rock stress distributions, and plastic zones (Fig. 5).
Fig. 5Stability calculation results of open pit mining site status
a) Deformation displacement
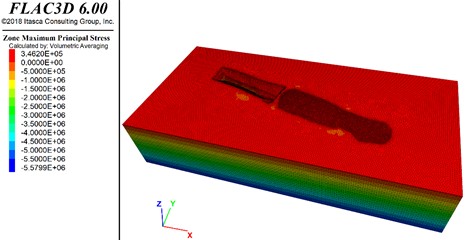
b) Rock stress
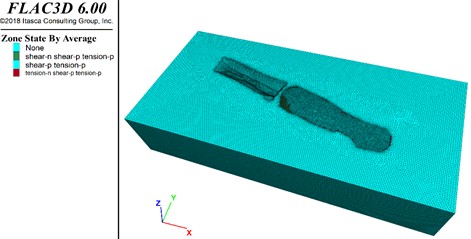
c) Distribution of plastic zone
Displacement nephograms indicate minimal deformation at No. 1 open-pit due to backfilling, with maximum displacements (~1 cm) localized in backfilled waste rock areas, attributed to compaction. No. 2 open-pit slopes exhibited displacements of 1.0-1.2 cm, below the 20 mm threshold for significant stability impacts. This confirms No. 2 open-pit slopes remain stable under current conditions, with no large-scale landslides or collapses observed.
Stress nephograms reveal compressive stress gradients increasing with depth. Stress redistribution and concentration occurred near slope toes and adjacent stope boundaries. Maximum compressive stresses in open-pit areas (1.5-3 MPa) and underground stopes (2-4.5 MPa) remain well below the compressive strengths of biotite granulite (9.6 MPa) and orebody (16.8 MPa), indicating low compressive failure risks. Tensile stresses (0.24-0.34 MPa) localized at slope faces and stope roofs are substantially lower than the tensile strengths of biotite granulite (0.64 MPa) and orebody (1.12 MPa), suggesting negligible tensile failure potential. Combined principal stress analysis confirms No. 2 open-pit slopes remain stable without underground-induced collapse risks.
Plastic zone distributions show no development at No. 2 open-pit slopes. Localized plastic zones in No. 1 open-pit backfill result from granular material compression. Underground backfill exhibits isolated plastic zones without inter-stope connectivity, demonstrating minimal upward stability impacts.
5.2. Stability of existing underground stop
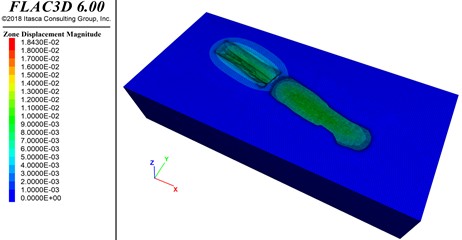
Underground mining processes were numerically reconstructed to assess deformation, stress, and plastic zones in overlying strata (Fig. 6).
Maximum roof displacements of 7-9 mm was recorded, below the 20 mm stability threshold. This confirms intact rock mass stability without large-scale collapses. Compressive stress distributions follow depth-dependent gradients, with maximum values (2-4.5 MPa) in underground stopes remaining below rock strength thresholds. Tensile stresses (0.24-0.34 MPa) at stope roofs are subcritical relative to material tensile strengths. Principal stress integration verifies current underground stability. Plastic zones are confined to backfill materials without propagation to adjacent stopes or surface operations, confirming effective stability control.
Fig. 6Stability calculation results of underground mining status
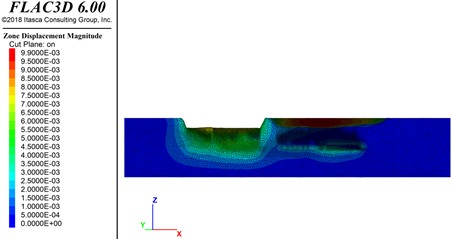
a) Deformation displacement
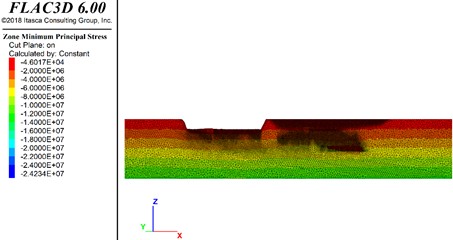
b) Rock stress
c) Distribution of plastic zone
5.3. Stability of boundary pillar
Three-dimensional simulations evaluated the designed 45m boundary pillar during phased mining: geostatic equilibrium → No. 1 open-pit extraction → No. 2 open-pit extraction → No. 1 open-pit backfilling → underground mining to current status → full underground depletion. The spatial relationship between the isolation layer and the open-pit and underground mining areas is shown in Fig. 7. Four monitoring points in the boundary pillar are shown in Fig. 8.
Fig. 7Spatial relationship between the isolation layer and the open-pit and underground mining areas
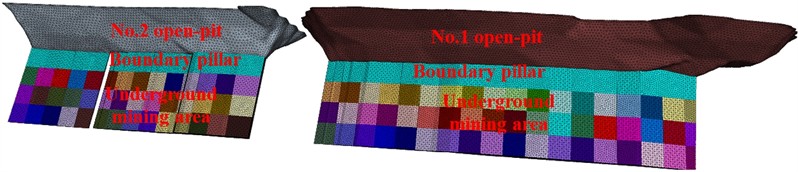
Fig. 8Four monitoring points in the boundary pillar
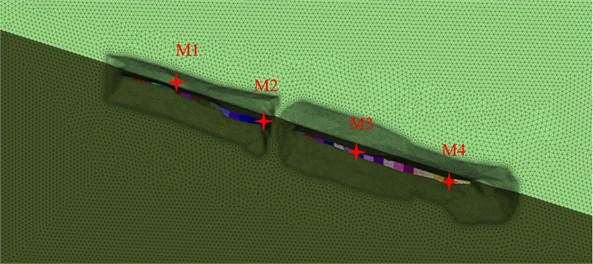
Displacement monitoring (Fig. 9) shows maximum displacements of 1.0 cm at eastern No. 2 open-pit (M1/M2), with other points below critical thresholds. The 45 m boundary pillar effectively decouples underground disturbances from surface operations, maintaining displacements under 20 mm.
The minimal deformations and the absence of failure mechanisms within the 45 m boundary pillar have significant practical engineering implications. Firstly, they validate the current design and provide confidence that underground mining activities will not induce catastrophic collapse or landslides into the upper open-pit, ensuring the safety of surface infrastructure and equipment. Secondly, the model demonstrates that the pillar successfully acts as a stress-cap, transferring mining-induced loads away from the pit bottom and preventing the development of a continuous failure path to the surface. This effectively mitigates the risk of one of the most critical hazards in transition mining: sudden and unpredictable subsidence.
Fig. 9Displacement of monitoring points in the model
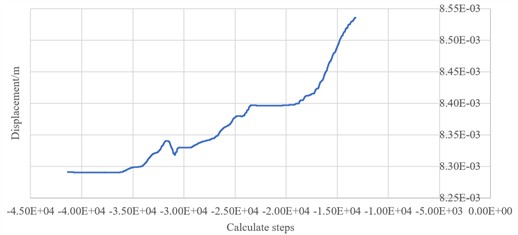
a) Monitoring point M1
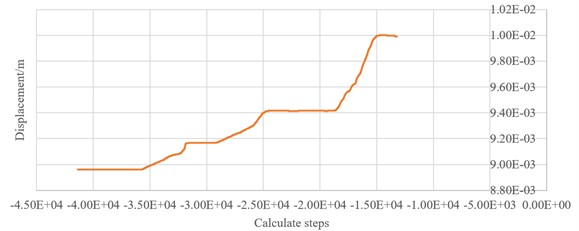
b) Monitoring point M2
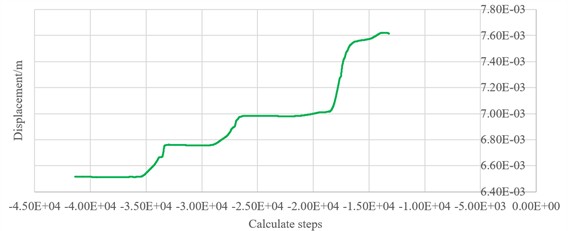
c) Monitoring point M3
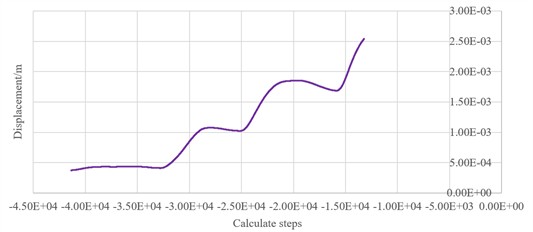
d) Monitoring point M4
5.4. Model validation
A crucial step in numerical simulation is to validate the model’s accuracy against real-world field measurements. To ensure the reliability of the constructed model in predicting the mechanical behavior of the mining area, a validation process was carried out by comparing the simulation results with on-site monitoring data.
Field monitoring included GNSS surface displacement stations installed around the perimeter of the No. 2 open-pit and inclinometers for measuring subsurface movement. The simulated displacements after the excavation of the open-pit were extracted at locations precisely corresponding to the monitoring points.
The comparison revealed a strong correlation between the simulated and measured data. For instance, the maximum simulated horizontal displacement at the slope crest was approximately 1.1 cm, while the monitored value averaged 1.15 cm. The spatial distribution of the displacement field from the simulation also matched the trends observed in the monitoring data. The minor discrepancies (within an acceptable margin of error of ~5 %) can be attributed to the inherent heterogeneity of the rock mass and simplifications in the model. The close agreement confirms that the calibrated numerical model accurately represents the geotechnical conditions and can be reliably used for subsequent analysis of the isolation pillar's stability.
6. Conclusions
Based on a specific mining engineering case, this study conducted a comprehensive stability analysis of open-pit slopes and underground stopes through field investigation and advanced numerical modeling. A high-fidelity 3D model of the mining area was constructed using a coupled MIDAS-GTS/NX and FLAC3D modeling technique. The deformation, stress evolution, and plastic zone development were systematically investigated under full lifecycle mining conditions. The key findings are summarized as follows:
1) Minimal displacement is observed at the backfilled No. 1 open-pit slopes. The unfilled No. 2 open-pit slopes exhibit deformations with maximum displacements of 1.0-1.2 cm, well below critical thresholds. Stress analysis indicates a low potential for tensile or compressive failure in the surrounding rock masses. No plastic zones are detected at the natural slopes of No. 2 open-pit, confirming their stability.
2) The underground stopes are in a stable state, with maximum roof displacements of 7-9 mm and compressive stresses within safe limits. Plastic zones are confined to the backfill materials without interconnection.
3) The 45 m boundary pillar effectively isolates mining disturbances, with deformations remaining below all established stability criteria. This validates the current design and confirms that underground mining activities have not induced significant impacts on the surface open-pit area.
References
-
D. Lu et al., “Research progress of rock mass movement and safety prevention and control in open-pit to underground mining of metal mines,” (in Chinese), Nonferrous Metals, Vol. 77, No. 1, pp. 13–30, 2025, https://doi.org/10.20238/j.issn.1671-4172.2025.01.002
-
Y. Zhang, X. He, and N. Zhang, “Characteristics analysis and prediction of heavy rainfall infiltration after transition from open-pit to underground mining,” Mining and Metallurgical Engineering, Vol. 44, No. 6, pp. 23–27, Jun. 2024, https://doi.org/cnki:sun:kygc.0.2024-06-005
-
Y. Zhou et al., “Analysis of roof failure and caving mechanism in multi-goaf areas of inclined orebodies,” (in Chinese), Metal Mines, Vol. 11, pp. 11–19, 2024, https://doi.org/10.19614/j.cnki.jsks.202411002
-
Z. Lan, P. Wang, and C. Wang, “Study on the subsidence mechanism of open-pit underground mining in the beiyi mining area of shilu iron mine,” Nonferrous Metals Engineering, Vol. 13, No. 10, pp. 105–117, Oct. 2023, https://doi.org/cnki:sun:yous.0.2023-10-013
-
Y. Hu et al., “Study on the technology of induced caving to control the hazard of slope rock movement in the open-pit underground wedge transition method,” (in Chinese), Metal Mines, Vol. 3, pp. 37–43, 2024, https://doi.org/10.19614/j.cnki.jsks.202403004
-
A. Jiang, Y. Dong, and X. Jiang, “Numerical simulation of open pit slope collapse caused by transition from open pit to underground mining,” Mining and Metallurgical Engineering, Vol. 42, No. 3, pp. 14–17, Mar. 2022, https://doi.org/cnki:sun:kygc.0.2022-03-004
-
Y. Lu et al., “Study on the reasonable thickness of overburden in open-pit to underground,” (in Chinese), Metal Mines, Vol. 2, pp. 23–28, 2021, https://doi.org/10.19614/j.cnki.jsks.202102004
-
Z. Long, L. Han, and Q. Meng, “Reasonable thickness of crown pillar for transition from open-pit to underground mining in gushan iron mine,” Mining and Metallurgical Engineering, Vol. 39, No. 2, pp. 24–29, Feb. 2019, https://doi.org/cnki:sun:kygc.0.2019-02-006
-
X. Li, L. Luo, and Y. Wang, “Slope angle effect on overburden strata response during transition from open pit to underground mining,” Mining and Metallurgical Engineering, Vol. 41, No. 4, pp. 33–37, Apr. 2021, https://doi.org/cnki:sun:kygc.0.2021-04-008
-
W. Cha, X. Liu, and S. Yao, “Influence of step-by-step excavation from open-pit to underground with reverse tendency on stability of high and steep slopes with faults,” Science Technology and Engineering, Vol. 21, No. 20, pp. 8403–8409, 2021, https://doi.org/cnki:sun:kxjs.0.2021-20-015
-
Li Xiaoshuang et al., “Research on deformation and failure character of underground surrounding rock and overlying strata transition from open pit to underground mining,” (in Chinese), Chinese Journal of Underground Space and Engineering, Vol. 14, No. 5, 2018, https://doi.org/10.20174/j.juse.2018.05.028
-
M. Wang, X. Li, and Y. Wang, “Stope stability under disturbance in transition of open?pit to underground room and pillar mining,” Mining and Metallurgical Engineering, Vol. 42, No. 2, pp. 32–37, 2022, https://doi.org/cnki:sun:kygc.0.2022-02-008
-
Y. Wang, X. Xu, and X. Gu, “Optimization method for thickness of open-pit tailings backfill to underground boundary pillars,” Metal Mines, pp. 1–12, Apr. 2020.
-
Z. Liu et al., “Determination and stability analysis of boundary pillar thickness for open-pit to underground mining of a certain iron mine,” (in Chinese), Mining Research and Development, Vol. 44, No. 7, pp. 1–6, 2024, https://doi.org/10.13827/j.cnki.kyyk.2024.07.002
-
Y. Li et al., “Deformation failure characteristics and evolution mechanism of open-pit slopes caused by open-pit to underground mining,” (in Chinese), Mining Research and Development, Vol. 44, No. 7, pp. 72–79, 2024, https://doi.org/10.13827/j.cnki.kyyk.2024.07.005
-
E. Zhao, Z. Wei, and Y. Shen, “Study on effect of blasting vibration on stability of safety roof pillar for open-pit to underground transition in Longshou mine,” Blasting, Vol. 41, No. 2, pp. 75–85+126, 2024.
-
Z. Lan et al., “Prediction and analysis on surface subsidence range in the open-pit to underground mining of shilu iron mine,” (in Chinese), Mining Research and Development, Vol. 43, No. 11, pp. 45–52, 2023, https://doi.org/10.13827/j.cnki.kyyk.2023.11.024
-
G. Li, L. Wang, and H. Zhang, “Investigation on safety thickness of isolation layer and mining stability for mine from open-pit to underground mining,” Journal of Safety Science and Technology, Vol. 18, No. 12, pp. 110–115, 2022.
-
S. Sun, W. Deng, and W. Liu, “Roof thickness of complex goaf in transition from underground to open-pit mining,” Mining and Metallurgical Engineering, Vol. 42, No. 2, pp. 5–8, 2022, https://doi.org/cnki:sun:kygc.0.2022-02-002
-
E. Hoek and E. T. Brown, “The Hoek-Brown failure criterion and GSI – 2018 edition,” Journal of Rock Mechanics and Geotechnical Engineering, Vol. 11, No. 3, pp. 445–463, Jun. 2019, https://doi.org/10.1016/j.jrmge.2018.08.001
-
Y. Hao and H. Jin, “Study on the catastrophe and stability analysis and prevention technology of giant traction landslide,” Journal of Hunan City University (Natural Science), Vol. 32, No. 2, pp. 12–18, 2023, https://doi.org/cnki:sun:hncg.0.2023-02-003
-
M. S. Ismail and J. Purbolaksono, “Analysis using finite element method of the buckling characteristics of stiffened cylindrical shells,” Australian Journal of Structural Engineering, Vol. 26, No. 4, pp. 321–331, Oct. 2025, https://doi.org/10.1080/13287982.2024.2414735
-
O. Ifayefunmi, M. S. Ismail, and M. Z. A. Othman, “Buckling of unstiffened cone-cylinder shells subjected to axial compression and thermal loading,” Ocean Engineering, Vol. 225, p. 108601, Apr. 2021, https://doi.org/10.1016/j.oceaneng.2021.108601
-
M. S. Ismail, O. Ifayefunmi, and S. H. S. Md Fadzullah, “Buckling analysis of stiffened cone-cylinder intersection subjected to external pressure,” Key Engineering Materials, Vol. 833, pp. 223–227, Mar. 2020, https://doi.org/10.4028/www.scientific.net/kem.833.223
-
“Code for investigation of geotechnical engineering,” China Architecture and Building Press, Beijing, GB50021-2001, 2009.
-
“Code for design of nonferrous metal mining,” China Planning Press, Beijing, 2012.
-
X. Wang et al., “Forensic analysis and numerical simulation of a catastrophic landslide of dissolved and fractured rock slope subject to underground mining,” Landslides, Vol. 19, No. 5, pp. 1045–1067, Feb. 2022, https://doi.org/10.1007/s10346-021-01842-y
About this article

This work was supported by the Natural Sciences Funding Project of Hunan Province (2024JJ6110, 2024JJ8049), Hunan Province Natural Science Foundation regional joint fund project(2025JJ70386), Application Basic Research and Soft Science Research Plan of Yiyang City (2024YR02).
The datasets generated during and/or analyzed during the current study are available from the corresponding author on reasonable request.
Wang Feifei and Cui Zhenjun wrote the initial draft (including substantive translation). Jiang Anmin and Kuan Wu carried out the software analysis. Yang Qi and Xue Yangbing carried out the site investigation.
The authors declare that they have no conflict of interest.
