Abstract
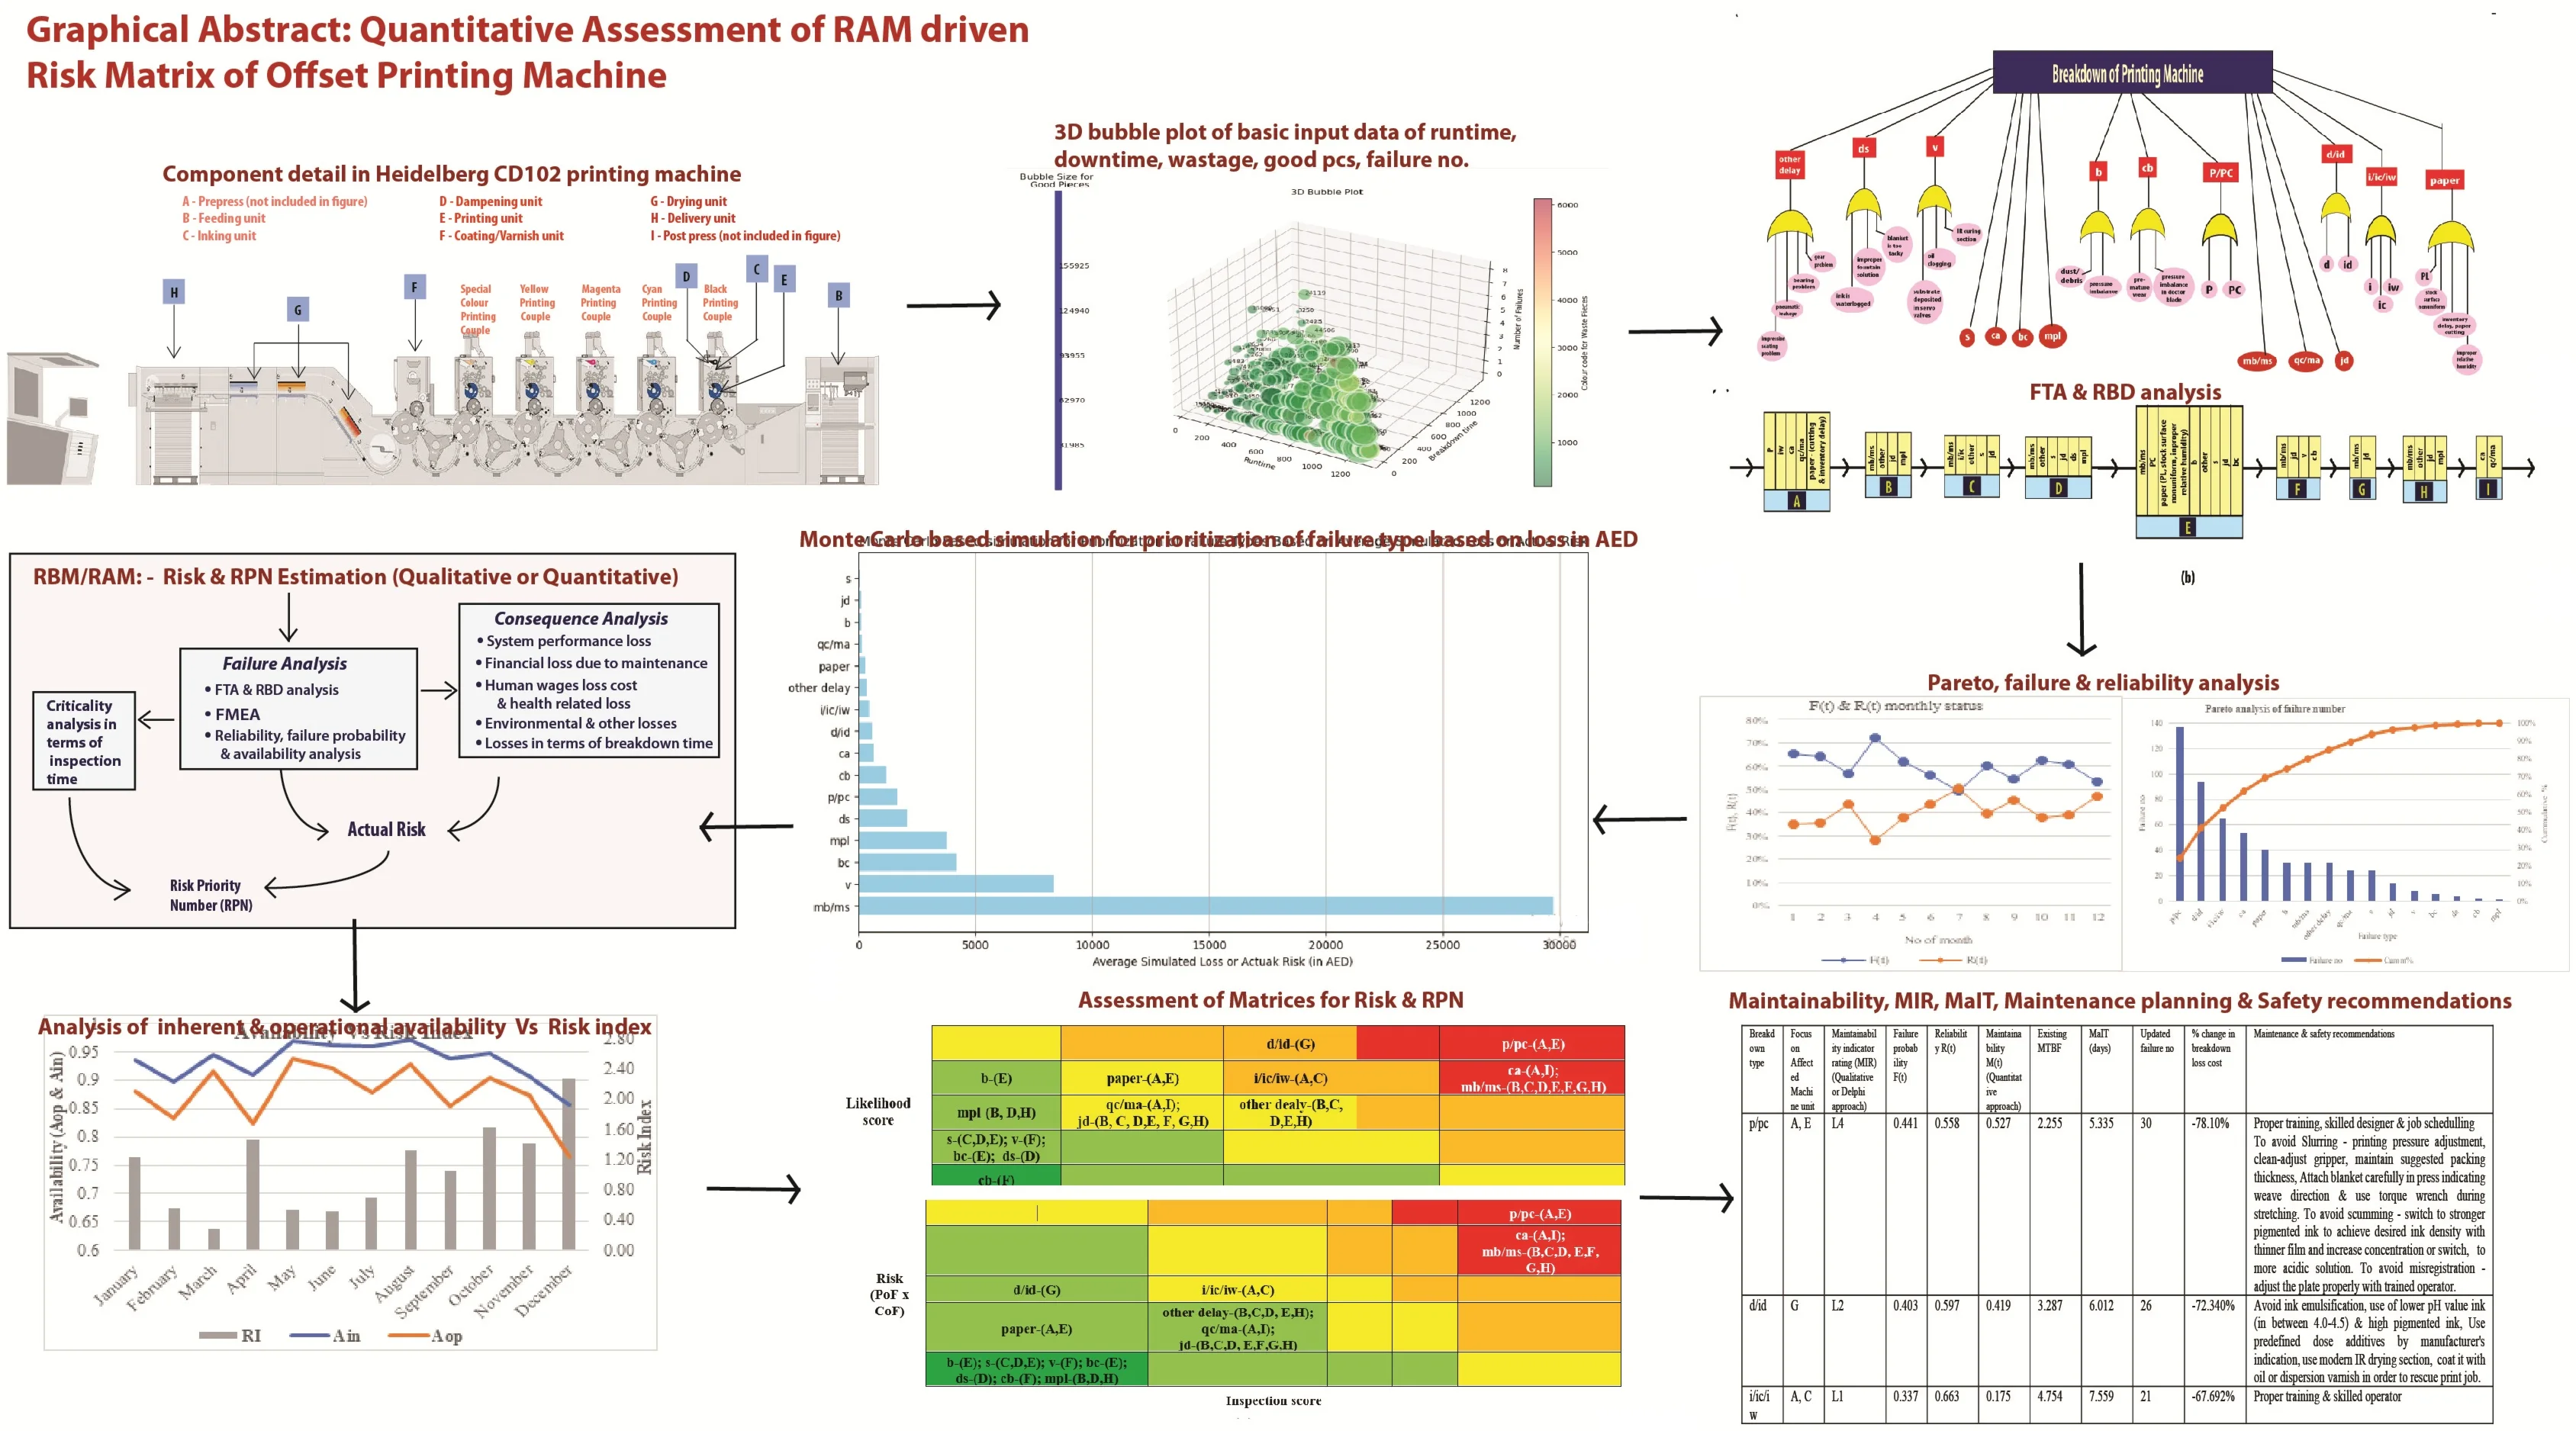
Quantitative assessment of risk matrix through analysis of reliability, availability and maintainability (RAM) is used as quick visual tool for managing potential risk in any continuous production system which can be used for further improved maintenance planning. Fault tree analysis along with failure mode and effect analysis support in assessing risk of minor or major failures associated with different consequences of human impact, production loss, maintenance loss etc. For developing risk matrix, scoring of likelihood and severity are necessary to identify the potential risk zone. An attempt has been made in the present study to assess overall failure scenario of offset-printing machine by analysing reliability of different machine component. Different types of failure frequencies and corresponding failure probability of the machine are set as a value representative likelihood failure data. The critical consequences of these failures are discussed for estimation of actual risk and risk index. Matrix of risk and risk priority number is developed here on the basis of likelihood scores of each kind of failure probability and severity scores by considering different types of breakdown and their associated responsible machine component. Moreover, prioritization of different failure types is validated by MonteCarlo simulation. Based on the risk matrix developed, maintainability and maintenance interval time has been determined which seems to be a novel approach for reduction of risk and breakdown time. Finally, maintenance and safety recommendation on the basis of corresponding risk level and maintainability indicator rating are discussed.
Highlights
- A noble approach to estimate the risk matrix in terms of actual risk and risk priority number is presented for different breakdown types and different components of offset printing machine by using its internal productivity data.
- The risk status of printing machine has been assessed both qualitatively and quantitatively by considering different factors of breakdown occurrence and its consequences in terms of both time and cost.
- Failure mode and effect analysis (FMEA) and pareto analysis have been conducted to prioritize different breakdown or failure types. Moreover, fault tree analysis (FTA) and reliability block diagram (RBD) analysis have also been conducted to understand the failure mode of each basic failure event.
- The analysis of Monte Carlo simulation for prioritization of failure types validates that nearly 20% of the breakdown types causes extremely high risk whereas remaining 80% causes comparatively less risk.
- Based on the risk matrix developed, maintainability and maintenance interval time have been determined. It is observed that updated maintenance time and failure number leads to potential saving in breakdown loss cost for most of the breakdown types.
1. Introduction
The printing industry comprises of different kind of printing machines which generally aims at client satisfaction, prerequisite profitability and high productivity with quality output. The commercial printing houses are one of such production units where meeting deadline is of utmost importance hence any unforeseen failure or downtime can affect the productivity detrimentally. The high-class quality and efficiency of printing production is achieved by minimizing the failure frequency and breakdown time with proper well-structured maintenance technique. Risk-based maintenance (RBM) management or reliability availability maintainability (RAM) methodology concerns the estimation of frequency of inspection and maintenance scheduling of any running equipment.
Research activities on RBM and RAM has been expanded in many domains throughout the decades. Some of the important research development from 2001 to till date are shown in Table 1. The significant related works carried out recently as illustrated in Table 1 represents a comparative overview of the approaches towards estimation of failures and risks of machineries in different industries like offshore, mining, marine, power generation, electrical, medical etc. Although there are considerable amount of reported works in risk matrix-based assessment in different manufacturing and engineering fields, but in printing industry such works are not well reported to the best of the knowledge of the authors. Considering the research gap the present investigation brings a new perspective on how the productivity parameters such as failure probability, reliability and risk index of the machine can be integrated with the estimation of risk matrix.
Table 1Summary of recent literature review of risk matrix and maintenance for risk assessment
Research or industry domain and year of paper published | Tools or technique used | Problem addressed | Benefits obtained | Research gap |
Circuit breaker of electrical devices (Polimac et. al., 2001) [1] | Maintenance scheduling and semi-quantitative analysis of interval | High maintenance cost w.r.t mean time between failure (MTBF) target | Improvement of performance | Semi-quantitative approach |
Heating, ventilation and air conditioning (HVAC) system - (Khan and Haddara, 2003) [2] | Probabilistic approach, fault tree analysis (FTA), quantitative risk estimation | High failure rate in separate subsystem | Exploring of different factors of consequence, risk analysis, primary maintenance planning | Complex quantitative assessment of different risk parameter and lesser focus on maintenance interval time (MaIT) estimation |
Power generating plant (Krishnasamy et al., 2005) [3] | Quantitative risk estimation, FTA, probabilistic approach | Higher criticality rate in discrete subsystem | Reduction of risk, scheduling maintenance, improved maintenance planning | Lesser focus on MaIT estimation |
Offshore industry (Siswanto and Kurniati, 2018) [4] | Optimal maintenance interval between preventive and corrective maintenance cycle | High failure rate (FR) and maintenance cost | Improvement of mean time to failure (MTTF), mean time to repair (MTTR), availability, maintainability | Need of risk matrix assessment |
Newspaper printing house - (Kar and Pal, 2019a) [5] | Pareto analysis, quantitative risk assessment of non-identical machines, availability analysis | High FR and maintenance cost | Finding of highest risky machine and suggestions for failure reduction in cost | Risk zone identification and estimation of maintenance interval time is missing |
Offshore industry (Leonia et al., 2019) [6] | Bayesian network for risk assessment, FTA, risk matrix, maintenance interval time (MaIT) | High risk for different component | Identifying of critical component on the basis of respective maintenance time, prediction of maintenance interval by failure probability of minor, major and catastrophic risk zones of each component | Study need on redundant and standby component for comparison, risk analysis on the basis of cost need to consider |
Silica sand production plant (Akaeje et al., 2021) [7] | FTA, reliability block diagram (RBD), failure mode, effect and criticality analysis (FMECA), Delphi exercise for maintainability indicator rating (MIR) | Breakdown and maintenance | Improvement of MTTR | Various attributes of maintainability assessment are qualitative and mostly based on linguistic scale |
mining industry (Tubis et al., 2022) [8] | Identification of fuzzy based risk | Safety issues, discrete failure scenarios on different machineries | Estimation and analysis of risk, maintenance decision | Absence of data driven model, resource allocation problem on maintenance, lacking multi-criteria decision-making methods |
Unmanned aerial vehical (UAV) drone industry (Imani et al., 2022) [9] | FTA, failure mode and effect analysis (FMEA) | Failure of costly components | Damage identification and analysis | Intensive analysis of reliability and maintenance are missing along with safety recommendation |
Propulsion machinery and marine industry (Domeh et al., 2022) [10] | Equipment based failure analysis, risk modelling, MaIT | Breakdown in different components in fishing vessel | Risk reduction, profitability analysis, easy MaIT estimation | Lacking consequence analysis of non-monitory event |
Medical instrumentation (Sukma et al., 2022) [11] | FMEA, risk priority number (RPN) estimation, fish bone diagram (FBD) | Failure, wastage, six big losses | Improvement of overall equipment effectiveness (OEE) and failure reduction | Qualitative RPN calculation, analysis needed for longer span with sensor data |
CNC production machineries (Atikno et al., 2022) [12] | FMEA, FBD, 5Why+1How technique, RPN estimation | high downtime | Qualitative estimation of RPN value | |
Nonwoven textile process (Pohlmeyer et al., 2022) [13] | FMEA, FTA, risk matrix | Unscheduled process downtime | Optimization of failure occurrence for availability increment | Need to analyse improvement of frequency and damage classes of risk matrix, also need large amount of production data for the model implementation |
Cement industry (Taufik et al., 2023) [14] | Reliability, availability and Maintainability (RAM) analysis, maintenance interval on the basis of age replacement model | High failure and downtime | Increased reliability and availability | Unchanged for maintainability |
Govt. and international agencies (Vaezi et al., 2023) [15] | Extension of different kind of risk formulation and resilience-based risk matrix | Local, national and global disaster risk due to socio-political and technological shifts | Improves accuracy for risk mapping in matrix | Resilience in terms of human error, human health, key human expert loss etc. may be more subjective for drawing final conclusion for risk matrix |
Offshore platform (Attia and Sinha, 2024) [16] | Generic failure frequency (GFF), variances of consequences, risk matrix | High failure rate and loss of containment | Risk comparison | Need of comparison between risk matrix and RPN matrix, need of availability, maintainability and MaIT estimation |
Construction project (Acebes et al., 2024) [17] | Monte Carlo simulation-based risk prioritisation, risk matrix | Risk impact on duration objective and cost objective | Quantitative approach for probability and impact of risk | Resilient factors of failure or severity are not considered, need MaIT and maintainability estimation and maintenance planning |
Newspaper printing house (Kar and Pal, 2024) [18] | Lean six-sigma and statistical techniques like SPC and ANOVA | High machine downtime, lower machine operating time and higher machine idle time | Improvement of productivity parameters | Integration of IIoT and machine learning |
Medical devices (Haimerl and Reich, 2025) [19] | Risk matrix, machine learning (ML) classification model | High risk events and their severity in terms of cost | Ranking of risk in w.r.t cost | Test performed on simple decision case with exemplary period of time. Need to focus on real life complex system where high maintenance cost is associated. Resilient factors are not considered, maintenance planning missing on the basis of risk prioritization etc. |
Printing and packaging (This Paper) | Quantitative resilient approach for risk Matrix estimation, RBM, reliability, availability, FTA, FMEA, Pareto analysis, Monte Carlo simulation-based risk prioritization, risk index (RI), RPN, maintainability, MaIT, IIoT, maintenance recommendation guidelines | Breakdown causes and affects machine unit. High inspection-repair time and breakdown loss cost | Analysis and improvement scope for reliability, maintainability, availability and MaIT, MIR etc. and reduction of risk, failure, downtime and breakdown cost, improved maintenance planning, etc. |
The risk matrix approach has been widely practiced in several industries as a straightforward technique for analysing risks and aiding in decision-making regarding priority actions. Risk matrix serves as a tool for subjective assessment and mapping of a discrete risk category to each combination of consequence and likelihood. Risk-based maintenance (RBM) allows the company to improve machine performance and reduce maintenance costs. RBM methodology mainly depends on statistical or historical data, and it accurately measures the detectability and probability of failure along with its consequences which helps the study to reduce the dependency on expert opinion and make it proper for quantitative assessment of matrix of actual risk status of risk priority number (RPN) of a system.
In the present investigation, the offset printing machine of a commercial printing company is considered where different root causes of breakdown and their effect are analyzed by fault tree analysis (FTA) and systematic failure mode and effect analysis (FMEA) technique. The monthly availability and reliability is checked along with their failure probability and consequences. Different types of causes for breakdown are identified and scored in terms of likelihood, severity and inspection (or detectability) etc. which are mapped in the risk matrix and RPN matrix to identify the high-risk zone. Then 80-20 % rule of Pareto analysis and MonteCarlo simulation is used for the validity of estimated high risk zone. Maintenance interval time (MaIT) are also estimated for individual breakdown types. In this study quantitative resilience factors are considered for the estimation of severity in terms of breakdown time, breakdown loss cost and detection in terms of inspection time to develop the RPN matrix. Apart from this, presented work also provides an outline of improved maintenance planning based on both the risk matrix and RPN matrix.
The objective of this research is to estimate the risk matrix in terms of actual risk and risk priority number for the different breakdown causes along with responsible machine components by considering both breakdown time and breakdown loss cost. It is also aimed to determine the maintenance interval time for different breakdown causes for improved maintenance planning.
2. Materials and methods
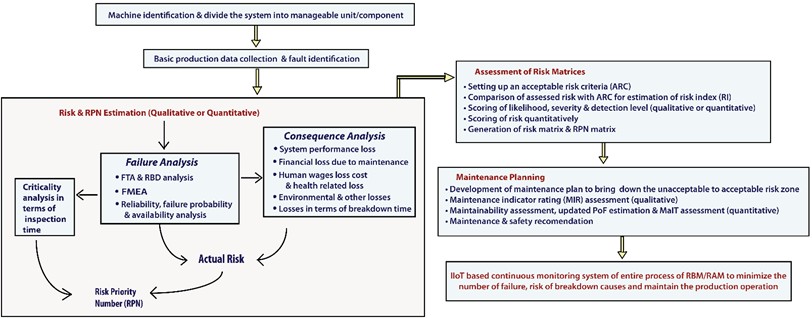
This section deals mainly with the details of the machine under study followed by representation of basic data of failure number, breakdown time, runtime, good pieces and wastages for a period of one year. Then breakdown details, causes and the responsible machine components are analyzed by both fault tree analysis (FTA) and failure mode and effect analysis (FMEA). Lastly, the procedure for assessment of risk index has been discussed. Also scores for criteria of different levels of failure, risk and interval time have been assessed for the purpose of evaluation of risk matrix. The proposed methodology for conducting this study has been demonstrated in the framework as shown in Fig. 1.
Fig. 1Proposed framework of RBM/RAM methodology for risk assessment
2.1. Machine details
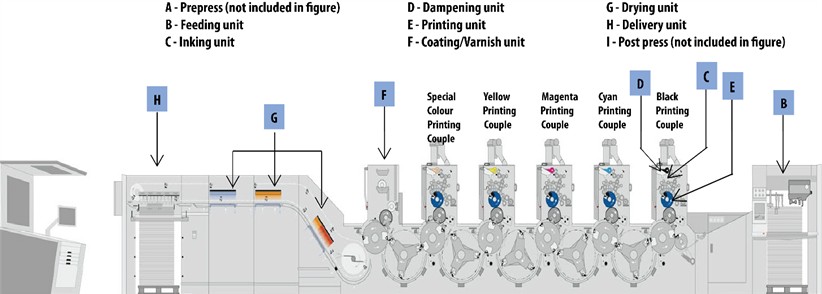
The proposed assessment was conducted on a sheetfed offset printing machine (make: Heidelberg, Germany; model No.: CD102). It was manufactured in 2002 and installed in 2005 at United Arab Emirates (UAE) based printing company. It is four-color printing machine having black, cyan, magenta, yellow printing couple with one special colour printing couple. This machine also consists of seven units namely feeding unit, inking unit (in each couple), dampening unit (in each couple), printing unit (in each couple), coating/varnish unit, drying unit, delivery unit as illustrated in Fig. 2. Special printing couple and varnishing unit are generally used for specialty printing. It is to be mentioned that prepress section and post press section are not included in Fig. 2 but play an important role for print production. The machine components as mentioned are marked in Fig. 2 for further processing.
Its plate size is 79×103 cm, maximum paper size is 72×102 cm and maximum print format is 71×102 cm. Different types of coated, uncoated, recycled, texture, matte, glossy, wood-free paper are used on the basis of job. Paper grammage is used in the printing machine in between 80-450 gsm as per job requirement. Offset inks and normal consumables are used for printing. Inside the printing press, the temperature is maintained between 20-26 °C and average relative air humidity was 75-85 %. Most of the printing jobs were scheduled mainly in day shift, however it has both 2-shift roaster and 3-shift roaster depending on job load. Though its maximum speed is up to 15000 impressions per hour, hence it operates at an average printing speed of 4560 impressions per hour as per job requirement from client and availability of paper type and paper grammage. Out of many printing machines, CD102 printing machine is chosen due to its age and failure scenario however it is assumed that the operational condition of the machine is the same.
Fig. 2Four colour sheetfed offset printing machine with special colour couple
2.2. Data representation
The basic operational data of failure number, breakdown time, runtime, good pieces and wastages has been obtained for 309 days out of 365 days which are represented in 3D bubble plot as shown in Fig. 3. The plot shows the numerical values of runtime, breakdown time and number of failures in a 3-Dimensional space best on their X-Y-Z coordinates. Each bubble represents the category of all input variables namely runtime, breakdown time, number of failures, number of good pieces and number of waste pieces. The size of each bubble indicates the number of good pieces obtained from the machine while the colour (from green to red) of each bubble represents the number of waste pieces obtained from the machine. Effect of runtime and breakdown time and good pieces and waste pieces on failure number is also observed here. It is seen that failure number is well dependent on the breakdown time and number of wastages.
2.3. Breakdown details and causes
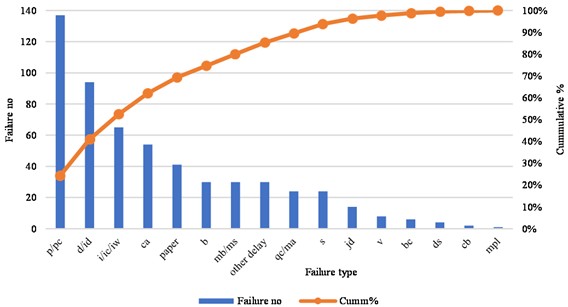
The basic data are failure number, runtime, breakdown time, number of wastage and good pieces of the printing machine which are observed and then collected from the daily management information system (MIS) during the period of 1st January 2021 to 31st December 2021. From the collected data, various breakdown times and number of failures are identified and the total number of 16 breakdown causes are analysed yearly by failure mode and effect analysis (FMEA) approach which is shown in Table 2. Here the responsible machine components or units are identified for respective breakdown causes. Fig. 4 shows the corresponding pareto analysis of failure number in where dominant failures for different breakdown types will be prioritized for improvement based on the FMEA results. This analysis will again lead to risk estimation both qualitatively and quantitatively later in this study.
Fig. 33D Bubble plot of runtime, downtime, failure number, good pieces and waste pieces on daily basis
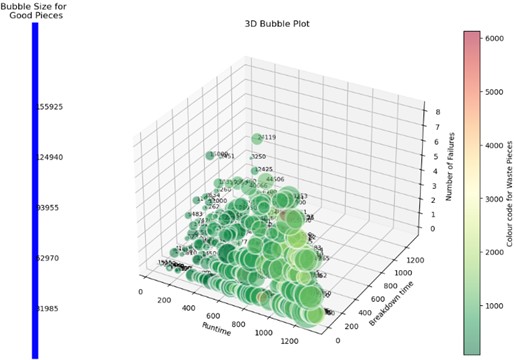
Table 2Failure mode and effect analysis of CD102 printing machine in terms of failure types and affected responsible machine unit
Breakdown cause | Breakdown effect | Abbreviation of breakdown type | Combination of affected responsible machine unit | Breakdown time (in minute) | Failure number |
• Plate delay (p) due to prepress. • Plate change (pc) due plate tear or damage. | • Printing operation is delayed. • Printing quality will deteriorate leading to slurring, misregistration, scumming etc. and gave unwanted mark or presence of debris in paper etc. | p/pc | A, E | 6785 | 137 |
• Drying of printed ink (id) on paper (i). Malfunction in IR dryer section or improper mixture of drying solvent (drying accelerators) to the ink. | • Witnessed issue of printing quality and smeared on the backside of the printed paper which will delay the post press operation. | d/id | G | 2600 | 94 |
• Ink mix (i) due to pantone colour generation. • Ink change (ic) due to new job. • Ink waiting (iw) for prepress confirmation or inventory or logistic delay. | • Delay on printing | i/ic/iw | A, C | 2340 | 65 |
• Client approval delay. | • Delay on printing and affected other scheduled jobs. | ca | A, I | 4320 | 54 |
• Paper delay due to inventory management or availability. Paper loading (pl) and paper cutting. • Paper change due to non-uniform stock surface, paper unable to withstand the tack of ink or printing force. • High or low relative humidity (RH) affected on paper printing quality. | • Delay on printing • Mottling and delamination observed. • Due to high RH, paper curled and observed dot doubling, smudging dots on paper, sticking of multiple printed sheets together which affect the overall printing operation. Also, due to low RH, paper faced problem of stacking, trimming and folding. As dry paper is more prone to static electricity thus frequent paper jam is observed. | paper | A, E | 1515 | 41 |
• Blanket clean of foreign particle and dust including blanket pressure balance | • Showed several problems like slurring, hickeys, piling, picking/contamination, mottling on print. | b | E | 930 | 30 |
• Breakdown or schedule maintenance | • Production are delayed for maintenance action | mb/ms | B, C, D, E, F, G, H | 6647 | 30 |
• Other delay (Plate tear, pneumatic leakage, gear failure, impression seating problem etc.) | • Observed mark on paper, colour mismatch, paper mis-registration problem and other problems etc. | other delay | B, C, D, E, H | 2865 | 30 |
• Quality check or management approval delay | • Delay on printing and reworks | qc/ma | A, I | 1465 | 24 |
Setting error | Printing quality | s | C, D, E | 770 | 24 |
• Job down for several minor reasons but repairable by in press worker | • Minor or moderate effect on printing quality and quantity | jd | B, C, D, E, F, G, H | 1205 | 14 |
• Varnish section problem due to IR curing section malfunction. • Residue of varnish substance deposited in servo-valves, clogging of oil etc inside flow lines | • Low printing quality, print looks milky or cloudy. • As a result caused premature bearing and gear wear in compressor. | v | F | 805 | 8 |
• Blanket damage | • Printing quality issue and monetary loss | bc | E | 200 | 6 |
• Dampening setting problem due to improper fountain solution mix, ink is waterlogged and blanket is too tacky | • Piling problem | ds | D | 215 | 4 |
• Coating blade damage due to premature wear, imbalance pressure or scoring problem in doctor blade | • Loss of volume in anilox roll or loss of ink transfer to substrate thus blade repaired or completely replaced. | cb | F | 145 | 2 |
• Maintenance for pipe leakage | • Printing quality and malfunction of system | mpl | B, D, H | 150 | 1 |
Total | 32957 | 564 |
Fig. 4Pareto analysis of failure number of individual breakdown type
2.4. Risk assessment
Risk assessment of any machine identifies the present status of the machine and helps production team to plan for the reduction of the probable risk of hazards, continuous production and improve production efficiency along with its economical profitability. It is a technique that identifies, characterizes, quantifies and evaluates the loss from an event. The risk assessment needs failure mode and effect analysis (FMEA) and pareto analysis for each failure. After estimation of probability of these breakdown occurrences, the effects are monitored in terms of time, cost, performance loss, human, environment, business interruption etc. Then the combination of these failures and its effects are used to understand and compare the risk scenario to minimize each kind of risk present in the machine.
Risk assessment of any machine might either be quantitative or qualitative depending on the resource availability in the existing setup. Quantitative risk estimation is the product of probability of failure (PoF) and consequence of a failure (CoF) events. The proposed risk-based maintenance (RBM) based on RAM aims to reduce the overall risk scenario of the operating printing facility. RBM/RAM implementation will reduce the occurrence of unexpected failure by implementing three modules namely risk determination, risk index evaluation and maintenance planning.
The first module of RBM/RAM methodology consists of the combination of sequential failure event which is to be quantified and calculated probability. To do that, time-motion study are conducted to identify the failures with proper systematic fault-finding techniques like FTA, reliability block diagram (RBD) and FMEA. Then an in-depth analysis are made with those identified failures for further reliability assessment. However, reliability assessment is one of most popular and important parameters to analyse potential failure scenarios of a machine. By definition, it is the ability of an item to perform a required function under given conditions for a given interval of time before it is undergone a breakdown. Mathematically, reliability function is derived from Eq. (1) where, is the reliability at time , is cumulative failure distribution (CDF) function or correlation coefficient and is failure probability density function (PDF). This probabilistic failure model can be estimated by Pearson correlation technique as shown in Eq. (2):
where, – breakdown time (in minute), – Cumulative % of failure (calculated from number of failures per day and sum of number of failures for one year), – sum of total operating time for one year (in minute) and – correlation coefficient.
From the concept of probability, it is known that the correlation coefficient must be in between +1.0 to –1.0 [5]. If the correlation coefficient estimates positive value, then the failure rate is increasing, otherwise the rate is decreasing. The analysis of bathtub curve [20] explains the different significant stages of failure i.e. showing infant mortality, useful life and wear-out stage of machine by the help of estimated failure rate () as shown in Eq. (3) where MTBF is mean time between failure:
During risk analysis availability is also important factor as it explores the availability of a machine during breakdown and repairment. Hence, availability and reliability are two different and necessary criteria in practicing maintenance methodologies. Reliability deals with the system in use which completes its task before failure occurs within a specified period of time. By definition availability is the probability of a system that has been failed and experienced by a repair action during its available time. It can also be defined as the probability of system which is readily available to perform the required function in the given work environment for a specified period of time and under stipulated working conditions. In general the availability of a system is a complex function of reliability , maintainability and supply effectiveness which can also be expressed by Eq. (4):
Mathematically availability can be sub-categorized into inherent availability () and operational availability () which is defined by Eq. (5) and Eq. (6) for better understanding:
Here, mean time to repair or MTTR is the ratio of repair time to failure number and mean downtime or MDT is the ratio of breakdown time to failure number where breakdown time is the summation of inspection time and repair or replacement time of each and every failure causes etc.
After reliability or failure assessment, consequence assessment are conducted whose main objective is to prioritize equipment and their components on the basis of their contribution to a system failure. So, consequence or severity of failure are estimated on the basis of different accounted loss caused from human wages loss cost, system performance loss, financial loss due to maintenance, environment loss, human health loss, any other losses etc.
Human wages loss cost (HWLC) is the loss which includes the cost of workers idleness due to machine breakdown. Breakdown time-period (DT) is the combination of both inspection time and repair time. System performance loss during production due to component failure which can be assessed [10, 20] either by expert’s opinion or by calculating the production loss cost (PLC). Maintenance loss cost (MLC) accounts for damage to the property or asset which is the summation of different cost of inspection, specialized equipment or personnel hired, maintenance, spare parts repair or replacement etc. Human health loss cost (HHLC) is the cost of health-related expenses of all the affected staffs during production due to illness or accident or hospitalization or disability etc. Environment loss cost (ELC) is the cost of damage per area zone within the building, plant, residence, agricultural land etc. to restore from the damaged state to natural ecofriendly state. However, in this study environmental loss is neglected and human health loss didn’t occur during production. All the losses and consequences of failure (CoF) are summarized in Eqs. (7) to (10):
In the second module of RBM/RAM acceptable risk criteria (ARC) is set according to the ALARP (as low as reasonably possible) to determine the risk index (RI) as shown in Eq. (11). If the RI value is more than 1 then it is said to be highly risky:
Risk of the machine in terms of both breakdown causes and machine components can be assessed quantitatively with the help of risk matrix by representing possible system risk levels or risk score values. The components of the risk matrix are likelihood, severity and risk impact. The likelihood of risk or probability of failure occurrence from an event or historical data has been considered as five ranges like remote, unlikely, possible, probable and highly probable which is quantified by giving scores from 1 to 5 as illustrated in Table 3. The failure impact is the severity or consequence of failures which have been considered as five ranges i.e. negligible, minor, significant, major, catastrophic which is again quantified by giving scores from 1 to 5 which is also illustrated in Table 3. The risk level criteria have been set as per industrial norms and regulations which is illustrated in Table 4. Table 5 shows also the criteria for setting scores for different level of inspection time.
Risk priority number (RPN) measurement is important for subjective assessment of risk and for prioritizing breakdown occurrence for corrective actions where inspection (or detectability) factor is considered. It can be said that if inspection time can be lowered then downtime can be reduced and if inspection is zero then downtime consists of repair time only. As per availability analysis, breakdown time is the combination of time of inspection (or detection) and repair. An attempt has been made to quantify the detection score level by assessing the inspection time (or detection time). Risk priority number (RPN) is the product of PoF or likelihood or occurrence (O), CoF or severity (S) and inspection or detection (D) level as shown in Eq. (12). Finally, in RPN matrix format, detection or inspection score and risk score (product of PoF and CoF) is set on -axis and -axis respectively for matrix visualization:
In the third module of RBM/RAM methodology, reduction of risk level is executed by reducing PoF with the help of proper maintenance planning and managerial implication. Maintenance planning includes maintainability parameters and proper implementation of maintenance decisions made by management. For proper maintenance action implementation, estimation of optimal maintenance duration along with re-estimation of the updated PoF, CoF and RI are generated to account for the probable profit gain or improvement of other parameter. Maintainability can be derived both qualitatively and quantitatively, which is the characteristics of maintenance planning, material design and installation.
Table 3Scores for criteria of likelihood and severity of failure
Likelihood criteria | |||||||||||
PoF category | Probability (quantitative) | Likelihood (qualitative) | Industry norms (qualitative) | Historical data (quantitative) | Management opinion (qualitative) | Score | |||||
Highly probable (near certain) | 0.8-1 | Regularly | Very common in industry | Extensive record of occurrence | Almost certain | 5 | |||||
Probable (or likely) | 0.6-0.8 | Often | Often happens in industry | Record of frequent occurrence | Likely | 4 | |||||
Possible | 0.4-0.6 | Sometimes | Sometime occurs in industry | Record of occasional occurrence | Possible | 3 | |||||
Unlikely | 0.2-0.4 | Rare | Rarely expected in industry | Few records of occurrence | Unlikely | 2 | |||||
Remote (or near zero) | 0-0.2 | Almost never | Not expected in industry | No record of occurrence | Very unlikely | 1 | |||||
Severity criteria | |||||||||||
CoF category | People (quantitative) | Property (quantitative) | Economic assets (quantitative) | Information (qualitative) | Human health, industrial and market reputation (qualitative) | Score | |||||
Catastrophic | Multiple fatalities | Complete destruction of property | Bankruptcy or severe financial loss | Total loss of critical data | Catastrophic damage to public image, company integrity irreparably damaged | 5 | |||||
Major | Serious injuries leading to hospitalization | Major damage requires extensive repair | Major financial loss | Major loss of data, partially recoverable | Major damage to public image, long term impact | 4 | |||||
Significant | Major injuries requiring medical treatment | Significant damage requiring extensive repair | Significant financial loss | Significant loss of data, recoverable with effort | Significant damage to public image, recoverable with effort | 3 | |||||
Minor | Minor injuries requiring first aid | Minor damage or easily repairable | Minor financial loss | Minor loss of data, quickly recoverable | Minor public image damage, easily recoverable | 2 | |||||
Negligible | Nil or insignificant injury | Minimum or no damage | Negligible financial loss | No loss of data | Negligible impact on public image | 1 | |||||
Maintainability indicator rating (MIR) can be derived by Delphi technique [7, 21] for easy and quick analysis of maintenance. It is a qualitative approach on the basis of scaling of maintenance complexity level criteria as tabulated in Table 6 with a expert panel made up of managers, engineers, technicians and operators who are operating and maintaining the required assets or equipment. It may also require repetitive sets of structured questionnaires session for probable best fitted maintenance criteria outcome.
Table 4Scores for criteria of different risk level
Category | Risk zone | Risk level criteria | Score |
Extreme | Very risky | Highly intolerable, executive or topmost management should address immediately | 21 to 25 |
High | Risky | Intolerable, senior management need to address urgent basis | 16 to 20 |
Medium | Medium | Tolerable or moderate, senior or mid-level management should monitor and reduce as low as reasonably practicable (ALARP) | 11 to 15 |
Low | Safe | Risk should be managed by frontline manager using routine procedures to reduce them to ALARP | 6 to 10 |
Very low | Very safe | Acceptable risks managed by routine check-up | 1 to 5 |
Table 5Scores for criteria of different level of inspection time
Inspection level criteria | |||
Category | Inspection period | Significance | Score |
Extreme | Very high time period | Very critical breakdown and very hard to identify the problem with very high inspection cost | 21 to 25 |
High | High time period | Critical breakdown and hard to identify the problem with high inspection cost | 16 to 20 |
Medium | Medium time period | Moderate breakdown and normal inspection time with medium inspection cost | 11 to 15 |
Low | Low time period | General breakdown and easy to inspect with lower inspection cost | 6 to 10 |
Very low | Very low time period | Minor breakdown and very easy to inspect with zero inspection cost | 1 to 5 |
Table 6MIR criteria under Delphi approach
Level of maintenance complexity along with its criteria remark |
L1 Basic maintenance approach is performed when the unit is online or semi-operative. It includes easy repair, adjustment or replacement of small components without total shutdown, dismantling or disassembling etc. |
L2 Maintenance action require repair or replacement of machine components in partial offline or online mode of machine operations. As such intensive failure finding is not required as the maintenance task are known scheduled or corrective actions |
L3 Maintenance action as complaint approach which requires failure identification and diagnosis keeping the unit off-line or partial shutdown mode |
L4 It undergoes predictive maintenance actions, requiring extensive amount of inspection, testing or corrective task whenever the unit is in total off-line mode |
L5 It undergoes pro-active maintenance approach with total unit modification or upgradation which includes total unit shut down before maintenance action is performed |
It is known that maintainability of an equipment is the restoration property from breakdown to its original position within a specific time period after completion of the recommended maintenance action. Similar to reliability investigation, theory of probability distributions plays a significant role in maintainability analysis as well. Maintainability percentage of the machinery was predicted according to the repair time, begins with time 0 and will be finished at time [20, 22]. The mathematical form of maintainability function is mentioned in Eq. (13), where indicates the time to repair, denotes the repair time of probability density function (PDF) and indicates the function of maintainability:
However, for quantitative approach, the percentage of maintainability is estimated by using Pearson correlation technique and shown in Eq. (14), where, – repair or replacement time of said breakdown (in minute), – cumulative % of repairment of existing failure (which is calculated from number of repair per day and sum of number of repairs for one year), – sum of total operating time for one year (in minute) and – correlation coefficient:
Here prediction of optimal maintenance duration is accomplished for affected machine or subsystem by determining maintenance interval time (MaIT). It is estimated for the justification of the improved maintenance planning, reliability or efficiency of machine in a production system. The mathematical expression of MaIT is shown in Eq. (15) [6, 10]:
where is the updated failure probability after maintenance planning and is the existing failure probability and is the annual runtime (in days) for maintenance interval.
3. Results
This section shows the results of probability of failure, consequences of failure and availability of the machine under study which are analysed both monthly and annually. Based on these results, actual risks and risk indices are estimated. Prioritization of actual risks is obtained using MonteCarlo simulation method. Also, different interval criteria of scoring of different risk parameters are analysed and status of score results of risk values and RPN values for different combinations of breakdown types are assessed. Based on these score values, different types of risk matrices and RPN matrices are generated. Then maintenance interval time for each cause of breakdown type is estimated for improved maintenance planning.
3.1. Failure and system vulnerability analysis
The production system line investigation in Table 2 shows that the main systems that affect the product quality are caused by different failure causes of different units of sheetfed printing machine of Heidelberg CD102. To identify all these possible causes of failure leading to undesired system stoppage fault tree analysis (FTA) is conducted [23]. It is a probabilistic top-down approach and used in safety and reliability engineering to show how a system can fail and to determine the best ways to reduce risk. To perform FTA, failures are identified and defined then it is constructed with graphical logic representation of fault events as shown in Fig. 5(a). Here the basic events namely the reasons or items are placed at the bottom, then they are connected with respective logic gates to form intermediate events and finally top undesired event of ‘breakdown of machine’. It is important to note that OR gates are used only when any one input event happens/occurs from all the input events then the output event will occur whereas AND gate are used when all inputs have occurred then output event occurs. For example, failure cause of ‘p/pc’ is formed with ‘OR’ logic gate by the basic events of plate change (p) and plate crack (pc). Similarly, ‘paper’ is constructed with paper loading (PL), paper cutting, inventory delay, non-uniform stock of paper, improper relative humidity (RH) etc. There are few individual and undeveloped events like ‘ca’, ‘qc/ma’, ‘s’, ‘mpl’, ‘bc’ etc. which are directly connected to top event for machine failure. The corresponding failure probabilities for each breakdown causes are also analysed later.
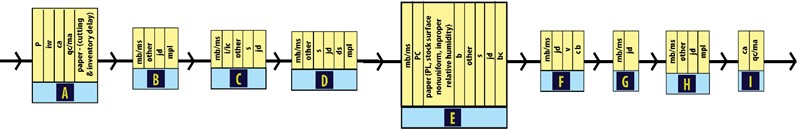
The vulnerability of the said production system under investigation is analysed by applying reliability block diagram (RBD) analysis tool [7]. RBD is an important tool in maintenance operation that can be applied in prospective and retrospective events (redesign, modification or continuous improvement) of a machine. It displays the logical connections and interaction among the different components that make up the system using asset blocks. Then these blocks can be analysed using mathematical methods to determine the level of system vulnerability. The input of the RBD is obtained from the FTA in Fig. 5(b), since RBD is the natural outcome of FTA. In designing the equivalent RBD of the FTA as shown in Fig. 5(b), the OR-gate was represented in a series, whereas the AND-gate is a parallel arrangement in the RBD.
However, FTA is the complementary tool of FMEA in risk analysis but the only difference is that it does not give account on the prioritization of failure event modes whereas FMEA can capture potential failures and their impact and risk which can be used for prioritizing and scaling for the estimation of risk priority number for failure mode effect and criticality (FMEA/FMECA) assessment as shown earlier in Table 2. Thus, after completing the system failure investigation and its vulnerability to producing poor quality products or system breakdown, FMEA analysis is carried out to drill down to component level. This is vital to understand the failure mode of each basic event from the FTA and thus gives clarity to the risk priority of individual event and later directs to the estimation of RI and RPN in terms of both breakdown time and breakdown loss cost.
Fig. 5Analysis of CD102 on the basis of breakdown causes or type in their respective printing machine unit a) FTA and b) RBD
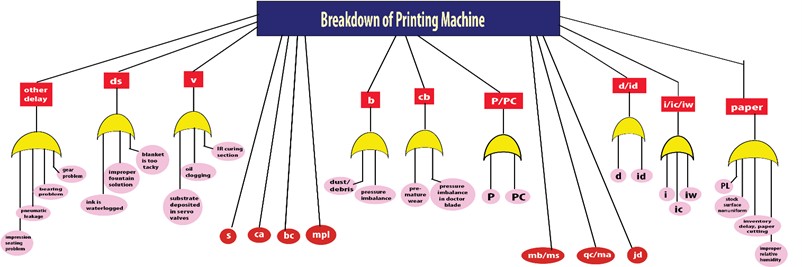
a)
b)
3.2. Probability of failure (PoF)
Failure probability is estimated from the collected press data as it is the function of runtime, breakdown time and failure number. Table 7 represents the monthly reliability; probability of failure and failure rate estimated from Eqs. (1), (2) and (3). Applying Pearson’s correlation method, the PoF and reliability value of the printing machine is 0.6228 and 0.3772 for 309 production day in a year. Also, failure rate is used for the representation of bath-tub curve obtained from the daily production data of one year as shown in Fig. 6. Fig. 7 shows the graphical representation of monthly failure probability and its reliability analysis. The bathtub curve presented here indicates that the machine under study is entering into the ‘wear-out’ stage from its ‘useful life cycle’ stage.
Table 7Failure analysis
No of months | No of days | |||
Jan | 27 | 65.32 % | 34.68 % | 0.00336 |
Feb | 24 | 64.26 % | 35.74 % | 0.00581 |
Mar | 26 | 56.45 % | 43.55 % | 0.0023 |
Apr | 23 | 72.12 % | 27.88 % | 0.00317 |
May | 23 | 61.95 % | 38.05 % | 0.00132 |
June | 26 | 56.20 % | 43.80 % | 0.00131 |
July | 26 | 49.46 % | 50.54 % | 0.00163 |
Aug | 27 | 60.33 % | 39.67 % | 0.00101 |
Sep | 26 | 54.65 % | 45.35 % | 0.0016 |
Oct | 25 | 62.34 % | 37.66 % | 0.00146 |
Nov | 29 | 60.77 % | 39.23 % | 0.00337 |
Dec | 27 | 53.14 % | 46.86 % | 0.00438 |
Total for 1 year | 309 | 62.28 % | 37.72 % | 0.00247 |
Fig. 6Bath-tub curve for 309 operational days out of 365 days
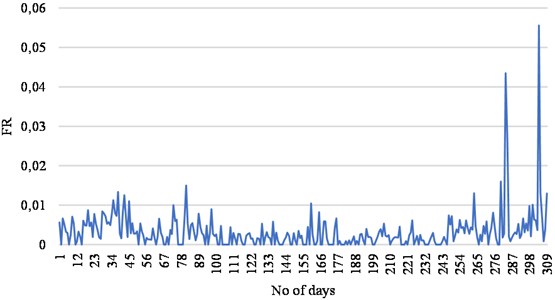
Fig. 7Monthly failure probability and reliability analysis

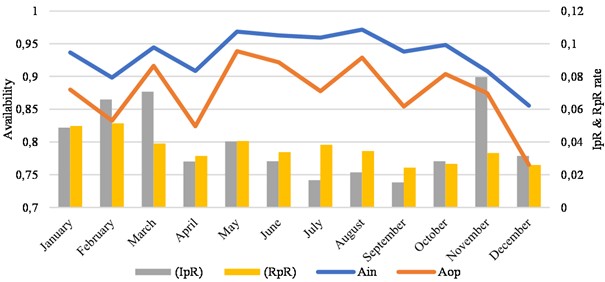
After reliability and failure analysis, different availability parameters are checked to understand the inspection and repair status and scenario of printing machine which are tabulated in Table 8 and illustrated in Fig. 8 on monthly basis. It is important to note that the inspection rate (IpR) is the ratio of failure number to inspection time. Also repair rate (RpR) is the ratio of failure number and repair time. IpR and RpR is the integral part of availability analysis and also linked to maintenance analysis. It is seen that lower the failure rate in terms of IpR and RpR, higher the availability of a machine which implies improved productivity. But as the machine is slowly entering into wear-out stage from useful life period, the failure rate is increasing with respective inspection and repairment operation and as a result availability is decreasing gradually.
Table 8Availability analysis of CD102
Ain | Aop | (IpR) | (RpR) | |
January | 0.936721 | 0.879885 | 0.0487627 | 0.049777 |
February | 0.898454 | 0.832527 | 0.0659631 | 0.05144 |
March | 0.944459 | 0.916267 | 0.0706638 | 0.039146 |
April | 0.908451 | 0.824144 | 0.0281426 | 0.031447 |
May | 0.968452 | 0.938705 | 0.0403587 | 0.040541 |
June | 0.962805 | 0.9218 | 0.0282486 | 0.033784 |
July | 0.959171 | 0.877506 | 0.0167742 | 0.038235 |
August | 0.971439 | 0.92892 | 0.0214876 | 0.034437 |
September | 0.938008 | 0.854313 | 0.0153527 | 0.024262 |
October | 0.948097 | 0.903764 | 0.0282158 | 0.026667 |
November | 0.908097 | 0.874495 | 0.0796964 | 0.03332 |
December | 0.855595 | 0.764886 | 0.0315754 | 0.025931 |
Fig. 8Availability analysis of CD102
3.3. Consequence of failure (CoF)
The CoF analysis of printing machine under study has been conducted by using the Eqs. (7), (8), (9) and (10). It is also important to note that PLC estimation obtained from the product of percentage wastage and raw material cost (which is the summation of the daily plate and exposing cost, paper cost, thinner and chemical cost, other material cost etc.). HWLC is obtained from the product of breakdown time or downtime and human labour cost per minute (i.e. salary of printer, feeder man, helper per month converted to United Arab Emirates Dirham (AED) considering 26 working days per month and 8 hours shift per day). MLC is the summation of inspection, repair or replacement and maintenance cost of different breakdown and here observed major costs are the blanket change, breakdown/scheduled/preventive maintenance, pipeline leakage, varnish section, coating blade replacement/repair, dampening section and other costs etc. However, there is less impact on environment due to these breakdowns and wastage/ink/chemical residual etc. and no injuries or accidents witnessed during the period of study due to different preventive measures taken in advance by the company thus the environmental loss and human health loss has taken as zero severity in this study and not included. The other losses observed during this period are considered as negligible and therefore not considered. Finally, the CoF calculation is done using Eq. (10) and the results are tabulated below in Table 9.
Table 9Consequence analysis
Month | No. of days | PLC (AED) | HWLC (AED) | MLC (AED) | CoF (AED) |
January | 27 | 10775.6 | 1525.64 | 23500 | 35801.24 |
February | 24 | 7783.428 | 1455.528 | 7000 | 16238.96 |
March | 26 | 8981.185 | 734.7751 | 0 | 9715.96 |
April | 23 | 10237.34 | 1699.518 | 26400 | 38336.85 |
May | 23 | 8847.069 | 499.1983 | 6800 | 16146.27 |
June | 26 | 13147.67 | 911.4576 | 3500 | 17559.13 |
July | 26 | 11468.78 | 1250.8 | 13800 | 26519.58 |
August | 27 | 14414.08 | 1102.163 | 25800 | 41316.25 |
September | 26 | 16070.93 | 2207.13 | 18500 | 36778.06 |
October | 25 | 16938.91 | 1391.025 | 30900 | 49229.94 |
November | 29 | 17679.92 | 2005.207 | 24100 | 43785.12 |
December | 27 | 15053.81 | 3703.042 | 62500 | 81256.85 |
Total for 1 year | 309 | 151149.9 | 18485.48 | 242800 | 412435.4 |
3.4. Actual risk and RI estimation
From the above results, actual risk in United Arab Emirates Dirham (AED) is estimated on both annual basis and monthly basis to understand the current risk status of machine using Eq. (11) as shown in Table 10. This actual risk is then needed to compare with the allotted yearly or monthly budget for maintenance. The yearly acceptable risk criteria (ARC) for an annual or monthly basis is 227280 AED or 18940 AED which has been collected from the accounts department of the printing company. The estimated overall risk index is 1.13 which is greater than 1 by using Eq. (11). This implies the machine needs a maintenance action for reduction of risk in terms of failure and its corresponding cost. As the overall risk index is higher than 1, it indicates that the system needs to reduce the risk index. This motivates the analysis of risk factors for individual breakdown causes for which scoring of actual risk and RPN is useful to generate risk matrix.
Table 10Actual risk (AED) and corresponding risk index (RI)
Month | No of days | Actual risk (AED) | Risk index (RI) |
Jan | 27 | 23383.93 | 1.23 |
Feb | 24 | 10435.83 | 0.55 |
Mar | 26 | 5484.37 | 0.29 |
Apr | 23 | 27648.66 | 1.46 |
May | 23 | 10003.42 | 0.53 |
June | 26 | 9867.43 | 0.52 |
July | 26 | 13115.34 | 0.69 |
Aug | 27 | 24924.64 | 1.32 |
Sep | 26 | 20098.32 | 1.06 |
Oct | 25 | 30689.01 | 1.62 |
Nov | 29 | 26608.60 | 1.40 |
Dec | 27 | 43180.68 | 2.28 |
Total for 1 year | 309 | 256850.4 | 1.13 |
Fig. 9. shows the comparative analysis between different kinds of availability parameters (like and ) and risk index on monthly basis. Availability percentage was measured by the dataset distribution which includes failure and repair times but excludes inspection times to understand how fast the maintenance, repair or replacement was made after inspection. While the availability ratio or percentage is reducing, the risk on that respective period or month is increasing again which validate the previous failure and reliability analysis.
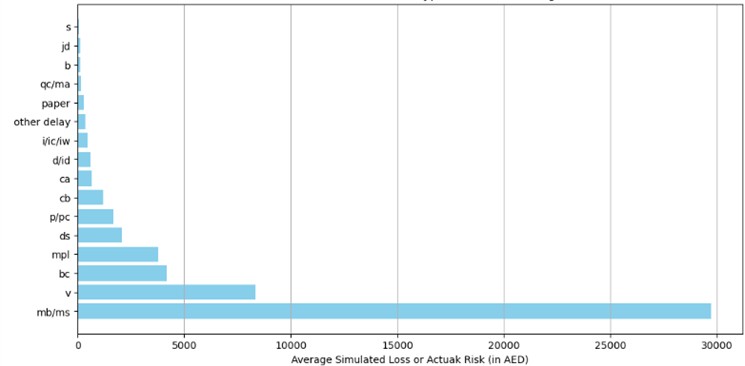
Moreover, once the risks is identified, their probabilities of failure along with their impacts have been modelled in terms breakdown loss cost or breakdown time. It is then needed to conduct quantitative risk prioritisation for better understanding of priority-based scenario of risk pattern of every failure causes present in the machine components. To accomplish this, Monte Carlo Simulation (MCS) method has been performed by considering only the stochastic uncertainty of activities to learn the total failure duration or cost. Generally, in MCS, expert judgement and numerical methods are combined to generate a probabilistic result through simulation routine. This mathematical approach is noted for its ability to analyse uncertain scenarios from a probabilistic perspective. MCS also allows the analysis of opportunities, uncertainties, and threats. This technique can be invaluable to risk managers and helpful for estimating project durations and costs [17]. Fig. 10 shows the MCS based prioritization of failure type based actual risk in terms of breakdown loss cost. This simulation has been generated with the assistance of Python Jupyter Network and Anaconda Prompt environment. The Numpy and Pandas library with 10,000 simulations are utilised to achieve accurate prioritization. Similarly, simulation based on MCS based prioritization of failure type on actual risk in terms of breakdown time can also be generated for better understanding of risk. This analysis will help for the scaling of actual risk and can be extended to RPN as well.
Fig. 9Comparative analysis between availability vs risk index
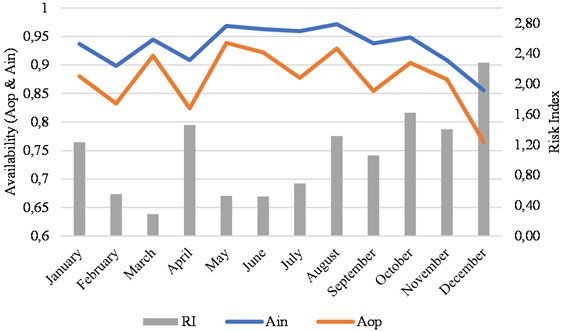
Fig. 10Monte Carlo based simulation for the prioritization of failure type based on actual risk or loss in terms of cost
3.5. Risk scoring and RPN scoring
In this section an attempt has been made to develop risk matrices by considering failure number as likelihood and breakdown time and its loss cost both as severity. The criteria of likelihood is fixed by considering highest failure occurrence value of 137 which is divided by 5 (due to 5 levels of likelihood) to estimate the criteria intervals of 27.4, 54.8, 82.2, 109.6 and 137 respectively and fix the scores of likelihood from 1 to 5 accordingly as shown in Table 11 (Part a). On the basis of opinion of management and finance department, severity in terms of both breakdown time and breakdown loss cost are given by different levels of score interval from 1 to 5 as shown in Table 11 (Part b) and Table 11 (Part c). Similar methodology has been adopted to estimate the risk interval and inspection interval as illustrated in Table 11 (Part d) and Table 11 (Part e) respectively.
Table 11Interval criteria for scoring of likelihood (Part A), severity (w.r.t time) (Part B), severity (w.r.t cost) (Part C), risk (Part D) and inspection time (Part E)
A | B | C | |||
Failure probability | Likelihood score | Breakdown time (minute) | Severity score | Breakdown loss cost (AED) | Severity score |
up to 0.0882 | 1 | upto 1000 | 1 | Up to 900 | 1 |
0.0882 to 0.1765 | 2 | 1000 to 2000 | 2 | 900 to 1700 | 2 |
0.1765 to 0.2647 | 3 | 2000 to 3000 | 3 | 1700 to 4000 | 3 |
0.2647 to 0.3530 | 4 | 3000 to 4000 | 4 | 4000 to 30000 | 4 |
0.3530 to 0.4412 | 5 | above 4000 | 5 | above 30000 | 5 |
D | E | ||||
Risk interval | Risk score | Inspection interval (minute) | Inspection score | ||
1 to 5 | 1 | up to 789 | 1 | ||
6 to 10 | 2 | 789 to 1578 | 2 | ||
11 to 15 | 3 | 1578 to 2367 | 3 | ||
16 to 20 | 4 | 2367 to 3156 | 4 | ||
21 to 25 | 5 | 3156 to 3945 | 5 | ||
Table 12Results of likelihood, severity, risk and RPN scoring for combination I
Failure type | Affected machine unit | PoF | Likelihood score | Breakdown time (minute) | Severity score | Risk value | Risk score for RPN calculation | Inspection time (minute) | Inspection scale | RPN value |
p/pc | A, E | 0.4413 | 5 | 6785 | 5 | 25 | 5 | 3400 | 5 | 25 |
d/id | G | 0.4034 | 5 | 2600 | 3 | 15 | 3 | 308 | 1 | 3 |
i/ic/iw | A, C | 0.3369 | 4 | 2340 | 3 | 12 | 3 | 800 | 2 | 6 |
ca | A, I | 0.2662 | 4 | 4320 | 5 | 20 | 4 | 3945 | 5 | 20 |
paper | A, E | 0.3393 | 4 | 1515 | 2 | 8 | 2 | 505 | 1 | 2 |
b | E | 0.2723 | 4 | 930 | 1 | 4 | 1 | 118 | 1 | 1 |
mb/ms | B, C, D, EF, G, H | 0.2810 | 4 | 6647 | 5 | 20 | 4 | 3560 | 5 | 20 |
other delay | B, C, D, E, H | 0.2304 | 3 | 2865 | 3 | 9 | 2 | 1160 | 2 | 4 |
qc/ma | A, I | 0.2064 | 3 | 1465 | 2 | 6 | 2 | 1213 | 2 | 4 |
s | C, D, E | 0.1757 | 2 | 770 | 1 | 2 | 1 | 95 | 1 | 1 |
jd | B, C, D, E, F, G, H | 0.1772 | 3 | 1205 | 2 | 6 | 2 | 840 | 2 | 4 |
v | F | 0.1518 | 2 | 805 | 1 | 2 | 1 | 180 | 1 | 1 |
bc | E | 0.1545 | 2 | 200 | 1 | 2 | 1 | 15 | 1 | 1 |
ds | D | 0.0904 | 2 | 215 | 1 | 2 | 1 | 100 | 1 | 1 |
cb | F | 0.0740 | 1 | 145 | 1 | 1 | 1 | 10 | 1 | 1 |
mpl | B,D,H | 0.2294 | 3 | 150 | 1 | 3 | 1 | 65 | 1 | 1 |
For risk assessment of the printing machine, it is now necessary to evaluate the risk values and RPN values for each type of breakdown causes by considering the following combination.
Combination I: Failure numbers, breakdown times and inspection times for each breakdown type
Combination II: Failure numbers, breakdown loss cost and inspection times for each breakdown type
Table 12 and Table 13 represent the results of risk values and RPN values of each breakdown type for combination I and combination II respectively. It is to be noted here that during estimation of breakdown loss cost (as shown in Table 13), production loss cost (PLC) is considered as zero because of zero wastage due to non-functioning of the machine at the stage of failure condition.
Table 13Results of likelihood, severity, risk and RPN scoring for combination II
Failure type | Affected machine unit | PoF | Likelihood score | Breakdown loss cost (AED) | Severity score | Risk value | Risk score for RPN calculation | Inspection time (minute) | Inspection scale | RPN value |
p/pc | A, E | 0.4413 | 5 | 3805.69 | 3 | 15 | 3 | 3400 | 5 | 15 |
d/id | G | 0.4034 | 5 | 1458.33 | 2 | 10 | 2 | 308 | 1 | 2 |
i/ic/iw | A, C | 0.3369 | 4 | 1312.50 | 2 | 8 | 2 | 800 | 2 | 4 |
ca | A, I | 0.2662 | 4 | 2423.08 | 3 | 12 | 3 | 3945 | 5 | 15 |
paper | A, E | 0.3393 | 4 | 849.76 | 1 | 4 | 1 | 505 | 1 | 1 |
b | E | 0.2723 | 4 | 521.63 | 1 | 4 | 1 | 118 | 1 | 1 |
mb/ms | B, C, D, EF, G, H | 0.2810 | 4 | 108728.28 | 5 | 20 | 4 | 3560 | 5 | 20 |
other delay | B, C, D, E, H | 0.2304 | 3 | 1606.97 | 2 | 6 | 2 | 1160 | 2 | 4 |
qc/ma | A, I | 0.2064 | 3 | 821.71 | 1 | 3 | 1 | 1213 | 2 | 2 |
s | C, D, E | 0.1757 | 2 | 431.89 | 1 | 2 | 1 | 95 | 1 | 1 |
jd | B, C, D, E, F, G, H | 0.1772 | 3 | 675.88 | 1 | 3 | 1 | 840 | 2 | 2 |
v | F | 0.1518 | 2 | 54851.52 | 5 | 10 | 2 | 180 | 1 | 2 |
bc | E | 0.1545 | 2 | 27112.18 | 4 | 8 | 2 | 15 | 1 | 2 |
ds | D | 0.0904 | 2 | 23320.59 | 4 | 8 | 2 | 100 | 1 | 2 |
cb | F | 0.0740 | 1 | 17081.33 | 4 | 4 | 1 | 10 | 1 | 1 |
mpl | B, D, H | 0.2294 | 3 | 16284.13 | 4 | 12 | 3 | 65 | 1 | 3 |
3.6. Risk matrix
A risk matrix is generally used to assess the level of risk of a machine and assist the management decision making process. It takes into consideration the category of probability or likelihood against the category of consequence severity. In this present investigation the risk assessment matrix of printing machines under study for different types of breakdown causes has been developed by considering both breakdown time and breakdown loss cost. Table 14 represents the risk matrix for different breakdown causes on the basis of breakdown time and breakdown loss cost respectively. Whereas Table 15 represents the RPN matrix for different breakdown causes by considering breakdown time and breakdown loss cost respectively. These risk matrices help the management to prioritize the risk for different causes of breakdown and develop an appropriate mitigation strategy. Here the extremely lower risk values for the particular breakdown causes are positioned in the first cell situated in an extreme downward left side of the matrix. Higher the risk, it tends to the extreme right side of the topmost corner in the matrix. In other words, it can be said that red colored situated in the top right corner of the matrix indicates the high-risk zone whereas green color situated in the left bottom corner indicates the low-risk zone. It is recommended for organizations to schedule periodic assessments of risk matrix as it needs regular monitoring and iteration to meet the challenges of constantly changing scenario of production process. With the help of an up-to-date risk assessment matrix, it is possible to identify emerging threats and properly allocate resources to mitigate their impact.
The mapping of risk is based on the different levels of consequences of failure probability for each type of breakdown. It is not necessary that highest PoF should possess highest consequence level thus it may vary case to case. For example, ‘p/pc’ has highest PoF of 0.4413 with different consequence level of breakdown time of 6785 minutes and inspection time of 3400 minutes and breakdown loss cost of 3805.69 AED thus it gives a result of different risk zones in risk matrix and RPN matrix under study. It is also observed that the breakdown cause ‘p/pc’ under machine component ‘A’ and ‘E’ falls on the high-risk zone for both risk matrix and RPN matrix with respect to breakdown time, whereas these causes under machine component ‘A’ and ‘E’ shifts to the medium risk zone for both matrix zone with respect to breakdown loss cost. This may be due to the effect of less running cost required for this cause i.e. ‘p/pc’. The position of the maintenance time for breakdown or schedule (mb/ms) remains same in the risk and RPN matrices for both breakdown time and breakdown loss cost due to negligible consequences for these causes. Therefore, it can be said that overall, three breakdown causes namely ‘p/pc’, ‘ca’ and ‘mb/ms’ are responsible for high-risk zones during the study period. In other words, it can be stated that all nine number of machine components falls under high-risk zone when breakdown time is considered. While seven number of machine components falls under high-risk zone when breakdown loss cost is considered.
Table 14Risk matrix for different breakdown types along with its affected responsible machine units on the basis of failure number and breakdown time, failure number and breakdown loss cost
Failure number and breakdown time | |||||
Likelihood score | d/id-(G) | p/pc-(A,E) | |||
b-(E) | paper-(A, E) | i/ic/iw-(A, C) | ca-(A,I); mb/ms-(B, C, D, E, F, G, H) | ||
mpl-(B, D, H) | qc/ma-(A, I); jd-(B, C, D, E, F, G, H) | other dealy-(B, C, D, E, H) | |||
s-(C, D, E); v-(F); bc-(E); ds-(D) | |||||
cb-(F) | |||||
Severity score | |||||
Failure number and breakdown loss cost | |||||
Likelihood score | d/id-(G) | p/pc-(A,E) | |||
paper-(A, E); b-(E) | i/ic/iw-(A, C) | ca-(A, I) | mb/ms-(B, C, D, E, F, G, H) | ||
qc/ma-(A, I); jd-(B, C, D, E, F, G, H) | other delay-(B, C, D, E, H) | mpl-(B, D, H) | |||
s-(C, D, E) | bc-(E); ds-(D) | v-(F) | |||
cb-(F) | |||||
Severity score | |||||
3.7. Maintenance interval (MaIT)
The risk of operation consisting of five aforementioned levels of 5×5 matrix for both actual risk and RPN are shown into the study. For high profitability point of view, the updated PoF is assumed to be 0.01 (on the basis of ALARP methodology) for lowest risk zone located at the extreme bottom left cell in the matrix which also lies under the lowest score criteria of the likelihood interval scale. Now out of 365 days of financial year of 2021, 309 operational days are used as for the estimation of MaIT as shown in Eq. (15). The maintenance interaval time in days for different breakdown causes/types are shown in Table 16. It is observed that the printing machine under study must undergo an overall maintenance interval of 76 days annually by considering all the breakdown types. It is also seen that the maximum probability of failure for breakdown type ‘p/pc’ requires lowest needed maintenance interval and minimum failure probability for breakdown type ‘cb’ requires highest maintenance interval time. However very few breakdown types seem to have higher MaIT for higher failure probability due to the effect of severity factor of the same. Thus, this will help the printing machine to be more reliable to the press organization for their improved printing production as well as it will prevent the machine from entering to ‘wear-out stage’ from its ‘useful life cycle’.
Table 15RPN matrix for different breakdown types along with its affected responsible machine units on the basis of inspection time and risk (in terms of breakdown time), inspection time and risk (in terms of breakdown loss cost)
Inspection time and risk (in terms of breakdown time) | |||||||
Risk (PoF × CoF) | p/pc-(A, E) | ||||||
ca-(A, I); mb/ms-(B, C, D, E, F, G, H) | |||||||
d/id-(G) | i/ic/iw-(A, C) | ||||||
paper-(A, E) | other delay-(B, C, D, E, H); qc/ma-(A, I); jd-(B, C, D, E, F, G, H) | ||||||
b-(E); s-(C, D, E); v-(F); bc-(E); ds-(D); cb-(F); mpl-(B, D, H) | |||||||
Inspection score | |||||||
Inspection time and risk (in terms of breakdown loss cost) | |||||||
Risk (PoF × CoF) | |||||||
mb/ms-(B, C, D, E, F, G, H) | |||||||
mpl-(B, D, H) | ca-(A, I); p/pc-(A, E) | ||||||
d/id-(G); v-(F); bc-(E); ds-(D) | i/ic/iw-(A, C); other delay-(B, C, D, E, H) | ||||||
paper-(A, E); b-(E); s-(C, D, E); cb-(F) | qc/ma-(A, I); jd-(B, C, D, E, F, G, H) | ||||||
Inspection score | |||||||
4. Discussion
From the analysis of risk matrix, it is evident that for both risk matrices and RPN metrices approximately 6 % to 20 % of the breakdown causes possess in the extremely high-risk zone. Remaining portions of breakdown causes are situated in the lesser zones of risk metrices. So, it can be postulated that the results obtained from both metrices validate the 80 %-20 % rule of Pareto analysis in RBM and reliability study. To enhance the precision and accuracy of risk assessment different resilience factors are considered. Different types of losses such as human wage loss, inspection time loss, material loss, production loss are considered as resilience factors in respect of both breakdown time and breakdown cost. Resilience factors associated with breakdown time cause a huge amount of production time loss whereas resilience factors associated with breakdown cost also causes a huge amount of loss of money. Obviously, these factors have a great effect on the productivity of the machine as well as its risk assessment. Again, inspection time is considered to convert the risk matrix into RPN matrix to understand the detectability status of the breakdown of the printing machine. So, it can be said that the targeted minimization of the overall failure probability up to 0.01 % machine needs a maintenance schedule of 76.16 days interval.
Table 16Maintenance interval time (MaIT) for different causes
Breakdown type | Existing PoF | MaIT (day) |
p/pc | 0.4413 | 5.3350 |
d/id | 0.4034 | 6.0118 |
i/ic/iw | 0.3369 | 7.5594 |
ca | 0.2662 | 10.0343 |
paper | 0.3393 | 7.4918 |
b | 0.2723 | 9.7689 |
mb/ms | 0.2810 | 9.4128 |
Other delay | 0.2304 | 11.8556 |
qc/ma | 0.2064 | 13.4303 |
s | 0.1757 | 16.0752 |
jd | 0.1772 | 15.9220 |
v | 0.1518 | 18.8596 |
bc | 0.1545 | 18.5026 |
ds | 0.0904 | 32.7595 |
cb | 0.0740 | 40.3980 |
mpl | 0.2294 | 11.9172 |
Overall PoF and MaIT | 0.623 | 76.16 |
5. Improved maintenance planning and safety recommendation
Reliability based maintenance planning is very important in maintenance management, specially in RBM methodology. Reliability is the probability of success or not failing of an substance. But with time all machines will degrade and reduce its performance and fails over time. Now the challenge or task for maintenance team is to keep the machine in operative condition with proper technical and maintenance skills. Reliability metrics along with high-risk zone helps to identify risky parts, machine units due to breakdown causes so that correct maintenance action can be implemented. Based on the result of repair rates, maintainability of each critical parts has been estimated. Maintainability is also useful, the same as reliability as it gives an account of MTTR i.e. how well and fast machines are coming back to operative state from breakdown. In fact, maintainability illustrates the measure of the time required to restore the operational status in a given percentage of the whole system failures. Table 17 shows the present status of the failure probability, MTBF, reliability and maintainability for each breakdown causes and affected machine units. In improved maintenance planning, an increase of maintenance interval time is observed for most of the breakdown types when compared with existing mean time between failure and updated failure number. It is also found that updated maintenance interval time and failure number leads to potential savings in breakdown loss cost for most of the breakdown types. The breakdown loss cost increases drastically for a few breakdown types which can be ignored during improved maintenance planning as these breakdown types are observed in the less risky zone in risk matrices. Based on these recommendations on maintenance and safety are proposed for each affected machine components.
Table 17Maintenance and safety recommendations based on improved maintenance planning
Breakdown type | Focus on Affected Machine unit | Maintainability indicator rating (MIR) (Qualitative or Delphi approach) | Failure probability | Reliability | Maintainability M(t) (Quantitative approach) | Existing MTBF | MaIT (days) | Updated failure no | % change in breakdown loss cost | Maintenance and safety recommendations |
p/pc | A, E | L4 | 0.441 | 0.558 | 0.527 | 2.255 | 5.335 | 30 | –78.10 % | Proper training, skilled designer and job scheduling. To avoid Slurring – printing pressure adjustment, clean-adjust gripper, maintain suggested packing thickness, attach blanket carefully in press indicating weave direction and use torque wrench during stretching. To avoid scumming – switch to stronger pigmented ink to achieve desired ink density with thinner film and increase concentration or switch, to more acidic solution. To avoid misregistration – adjust the plate properly with trained operator |
d/id | G | L2 | 0.403 | 0.597 | 0.419 | 3.287 | 6.012 | 26 | –72.340 % | Avoid ink emulsification, use of lower pH value ink (in between 4.0-4.5) and high pigmented ink, Use predefined dose additives by manufacturer's indication, use modern IR drying section, coat it with oil or dispersion varnish in order to rescue print job |
i/ic/iw | A, C | L1 | 0.337 | 0.663 | 0.175 | 4.754 | 7.559 | 21 | –67.692 % | Proper training and skilled operator |
ca | A, I | L1 | 0.266 | 0.734 | 0.236 | 0.072 | 10.034 | 16 | –70.370 % | Interference of management for approval and efficient client handling |
paper | A, E | L3 | 0.339 | 0.661 | 0.353 | 7.536 | 7.492 | 21 | –48.780 % | Efficient inventory management with modern ERP software Proper management and scheduling Consult with paper manufacturer, adjust printing pressure or maintenance of roller or blanket with proper setting. Reduction of ink tack on roll or operate at different production run of paper Maintain at optimal RH environment |
b | E | L2 | 0.272 | 0.728 | 0.274 | 10.3 | 9.768 | 16 | –46.667 % | Picking/contamination (as a result void is made in print). To avoid piling problem – cleanup rubber blanket, change the printing velocity, check the compatibility of ink and paper change the ink if required or add antioxidant, adjust dampening stability |
mb/ms | B, C, D, E, F, G, H | L5 | 0.281 | 0.719 | 0.311 | 10.3 | 9.413 | 17 | –43.333 % | Predictive maintenance for failure and efficient production management by experienced manager or engineer |
Other delay | B, C, D, E, H | L2 | 0.230 | 0.769 | 0.228 | 10.3 | 11.855 | 13 | –56.667 % | Corrective and breakdown maintenance |
qc/ma | A, I | L1 | 0.206 | 0.794 | 0.223 | 12.875 | 13.430 | 12 | –50.00 % | Continuous monitoring and commissioning of expert/experience personnel |
s | C, D, E | L1 | 0.176 | 0.824 | 0.176 | 12.875 | 16.075 | 10 | –58.333 % | Corrective maintenance |
jd | B, C, D, E, F, G, H | L1 | 0.177 | 0.823 | 0.138 | 22.071 | 15.922 | 10 | –28.571 % | Corrective and breakdown maintenance |
v | F | L3 | 0.152 | 0.848 | 0.156 | 38.625 | 18.859 | 8 | 0.00 % | Check and repair the IR or UV lamp for curing. Use of good quality varnish chemical |
bc | E | L3 | 0.155 | 0.845 | 0.151 | 51.5 | 18.503 | 9 | 50 % | Change of blanket |
ds | D | L2 | 0.090 | 0.909 | 0.103 | 77.25 | 32.759 | 5 | 25 % | Run the press with ideal ink/water stability. Maintenance of blanket or change to less tacky blanket. To avoid piling - adjust dampening stability |
cb | F | L3 | 0.074 | 0.926 | 0.076 | 154.5 | 40.398 | 4 | 100 % | use of noncorrosive substance during cleaning, proper adjustment of pressure and alignment are maintained, replacement on total breakdown |
mpl | B, D, H | L4 | 0.229 | 0.771 | 0.229 | 309 | 11.917 | 13 | 1200 % | Proper monitoring and scheduled maintenance |
6. Integration of industrial internet of thing (IIoT)
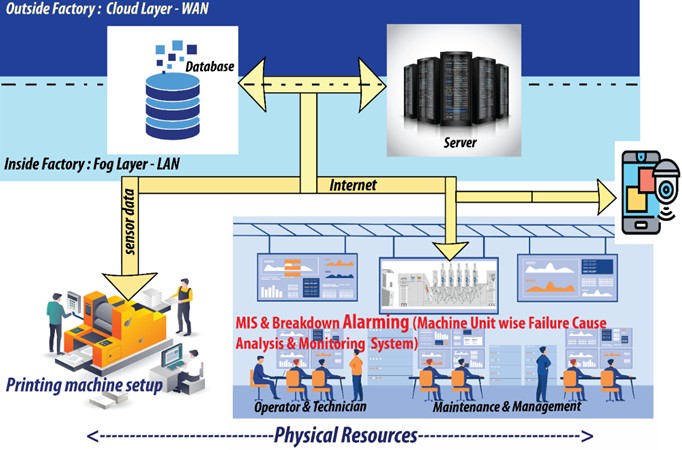
In modern print production houses all the activities are synchronized using workflow management system (WMS). This WMS is driven by job definition format (JDF) with an extensible mark-up language (XML) based communication language which can convey the internal productivity parameters as well as machine information between different production module. It can also interact with management information system (MIS) which can be accessed through internet. Moreover, with the advent of artificial intelligence (AI) technology in intelligent manufacturing and IIoT, various types of cyber physical systems including machine/deep learning algorithms can be applied to print production houses [24]. Hence, management as well as clients can get actual current status of the machine and assigned works from any corner of the work using MIS interface through the dashboard placed in the machine. Users may also use the web-based or android based interactive system for convenience. Taking the advantage of databases, cloud computing services, big data processing and data analytics module, the proposed prediction model for quantitative risk assessment can be integrated to workflow system. Fig. 11 shows a possible integration schematics for the same. This cyber-physical system will help the machine operators to identify the risky zones instantly. With the help of integration of IIoT, each type of failures will be identified and displayed in risk matrix as well as in machine dashboard which may lead to improved maintenance as well as safety recommendations for better productivity of the machine.
Fig. 11Schematic workflow diagram of job description for printing operation and its maintenance management
7. Conclusions
In this study, the risk status of a printing machine in a printing production house has been assessed both qualitatively and quantitively by considering different factors of breakdown occurrence and its consequences in terms of both time and cost. The results based on FTA and FMEA analysis demonstrate that there is a correlation between risk index and risk priority number of a machine. The analysis of MonteCarlo simulation for risk prioritization shows that nearly 20 % of the breakdown types causes extremely high risk whereas remaining 80 % causes comparatively less risk. It is also observed that improved maintenance interval time can be achieved by considering the probability of failure of the corresponding breakdown times. Assessment of RAM driven risk matrices in this study will help the management to design suitable maintenance planning, to track the repair rate scenario and reduce maintenance cost which leads to improved maintenance planning.
Two key contributions have been made by this study which may reflect the novelty of this research work. Firstly, the mapping and comparison of risk matrix and RPN matrix developed make this analysis unprecedented and it will significantly help the management to focus on those severe breakdown types along with the affected machine components which can be used for further improvement of productivity. Secondly the estimation of maintainability and its indicator rating for different breakdown types make the analysis quantitative for risk-based maintenance. Finally it can be concluded that the proposed methodology may be considered as a promising and potential tool for any continuous production process to implement Industry 4.0/5.0.
With the advent of artificial intelligence technology, the emerging field of maintenance management can be explored by the application of machine learning algorithms. The present study can also be extended explicitly to hardware implementation of automated sensing and continuous monitoring of internal productivity data of machines. Thus, considering the findings and the scope of future work, the proposed approach for quantitative assessment of risk matrix may be considered as an important tool for RBM/RAM methodology.
References
-
J. Polimac, “Maintenance scheduling according to reliability targets and actual equipment performance [circuit breakers],” in 16th International Conference and Exhibition on Electricity Distribution (CIRED 2001), Vol. 2001, Jan. 2001, https://doi.org/10.1049/cp:20010798
-
F. I. Khan and M. M. Haddara, “Risk-based maintenance (RBM): a quantitative approach for maintenance/inspection scheduling and planning,” Journal of Loss Prevention in the Process Industries, Vol. 16, No. 6, pp. 561–573, Nov. 2003, https://doi.org/10.1016/j.jlp.2003.08.011
-
L. Krishnasamy, F. Khan, and M. Haddara, “Development of a risk-based maintenance (RBM) strategy for a power-generating plant,” Journal of Loss Prevention in the Process Industries, Vol. 18, No. 2, pp. 69–81, Mar. 2005, https://doi.org/10.1016/j.jlp.2005.01.002
-
A. Siswanto and N. Kurniati, “Determining optimal preventive maintenance interval for component of Well Barrier Element in an Oil and Gas Company,” in IOP Conference Series: Materials Science and Engineering, Vol. 337, p. 012066, Apr. 2018, https://doi.org/10.1088/1757-899x/337/1/012066
-
A. Kar and A. K. Pal, “An approach to risk-based maintenance strategy of a printing press,” Journal of Print and Media Technology Research, Vol. 8, No. 3-2019, pp. 155–165, Jan. 2019, https://doi.org/10.14622/jpmtr-1907
-
L. Leoni, A. Bahootoroody, F. de Carlo, and N. Paltrinieri, “Developing a risk-based maintenance model for a Natural Gas Regulating and Metering Station using Bayesian Network,” Journal of Loss Prevention in the Process Industries, Vol. 57, pp. 17–24, Jan. 2019, https://doi.org/10.1016/j.jlp.2018.11.003
-
O. Akaeje, M. Billington, and J. Sinha, “PM4 SMP model proposed for system reliability criticality assessment and maintainability improvement,” Maintenance, Reliability and Condition Monitoring, Vol. 1, No. 1, pp. 10–25, Jun. 2021, https://doi.org/10.21595/mrcm.2021.22111
-
A. Tubis, S. Werbińska-Wojciechowska, P. Sliwinski, and R. Zimroz, “Fuzzy risk-based maintenance strategy with safety considerations for the mining industry,” Sensors, Vol. 22, No. 2, p. 441, Jan. 2022, https://doi.org/10.3390/s22020441
-
K. Imani, A. Gholami, and M. Bagherian Dehaghi, “Reliability calculation with error tree analysis and breakdown effect analysis for a quadcopter power distribution system,” Maintenance, Reliability and Condition Monitoring, Vol. 2, No. 2, pp. 45–57, Dec. 2022, https://doi.org/10.21595/marc.2022.23054
-
V. Domeh, F. Obeng, F. Khan, N. Bose, and E. Sanli, “A novel methodology to develop risk-based maintenance strategies for fishing vessels,” Ocean Engineering, Vol. 253, p. 111281, Jun. 2022, https://doi.org/10.1016/j.oceaneng.2022.111281
-
D. I. Sukma, H. A. Prabowo, I. Setiawan, H. Kurnia, and I. M. Fahturizal, “Implementation of total productive maintenance to improve overall equipment effectiveness of linear accelerator synergy platform cancer therapy,” International Journal of Engineering, Vol. 35, No. 7, pp. 1246–1256, Jan. 2022, https://doi.org/10.5829/ije.2022.35.07a.04
-
E. O. Wijaya, W. Atikno, I. Setiawan, R. Susanto, and H. Kurnia, “Analysis of BTA16 CNC machine performance improvement with total productive maintenance approach,” IJIEM – Indonesian Journal of Industrial Engineering and Management, Vol. 3, No. 3, p. 200, Oct. 2022, https://doi.org/10.22441/ijiem.v3i3.15770
-
F. Pohlmeyer, R. Kins, F. Cloppenburg, and T. Gries, “Interpretable failure risk assessment for continuous production processes based on association rule mining,” Advances in Industrial and Manufacturing Engineering, Vol. 5, p. 100095, Nov. 2022, https://doi.org/10.1016/j.aime.2022.100095
-
I. M. Taufik, E. Prasetyaningsih, and N. P. A. Hidayat, “Determination of maintenance intervals using multi-criteria approach to increase machine availability at a cement company,” Jurnal Improsci, Vol. 1, No. 2, pp. 73–87, Oct. 2023, https://doi.org/10.62885/improsci.v1i2.66
-
A. Vaezi, S. Jones, and A. Asgary, “Integrating resilience into risk matrices: a practical approach to risk assessment with empirical analysis,” Journal of Risk Analysis and Crisis Response, Vol. 13, No. 4, pp. 252–272, Jan. 2024, https://doi.org/10.54560/jracr.v13i4.411
-
M. Attia and J. Sinha, “Comparative analysis of failure consequences using qualitative and quantitative methodologies,” International Journal of System Assurance Engineering and Management, Vol. 15, No. 7, pp. 3451–3465, May 2024, https://doi.org/10.1007/s13198-024-02352-5
-
F. Acebes, J. M. González-Varona, A. López-Paredes, and J. Pajares, “Beyond probability-impact matrices in project risk management: A quantitative methodology for risk prioritisation,” Humanities and Social Sciences Communications, Vol. 11, No. 1, May 2024, https://doi.org/10.1057/s41599-024-03180-5
-
A. Kar and A. K. Pal, “An implementation of ANOVA and six-sigma for productivity improvement in printing machines,” Management and Production Engineering Review, Vol. 15, No. 2, pp. 1–19, Jun. 2024, https://doi.org/10.24425/mper.2024.151127
-
M. Haimerl and C. Reich, “Risk-based evaluation of machine learning-based classification methods used for medical devices,” BMC Medical Informatics and Decision Making, Vol. 25, p. 126, Mar. 2025, https://doi.org/10.1186/s12911-025-02909-9
-
A. Kar and A. K. Pal, “Evaluation of reliability, availability and maintainability of a printing press,” Master Thesis, Jadavpur University, India, 2019.
-
P. Moreu de Leon, V. González-Prida Díaz, L. Barberá Martínez, and A. Crespo Márquez, “A practical method for the maintainability assessment in industrial devices using indicators and specific attributes,” Reliability Engineering and System Safety, Vol. 100, pp. 84–92, Apr. 2012, https://doi.org/10.1016/j.ress.2011.12.018
-
B. Jakkula, G. R. Mandela, and S. M. Chivukula, “Reliability, availability and maintainability (RAM) investigation of Load Haul Dumpers (LHDs): a case study,” International Journal of System Assurance Engineering and Management, Vol. 13, No. 1, pp. 504–515, Jun. 2021, https://doi.org/10.1007/s13198-021-01154-3
-
I. Roy Chowdhuri, A. Kar, and A. K. Pal, “A new approach for effective reliability management of biomedical equipment,” European Journal of Theoretical and Applied Sciences, Vol. 1, No. 5, pp. 281–293, Sep. 2023, https://doi.org/10.59324/ejtas.2023.1(5).19
-
A. Kar, A. Chatterjee, and A. K. Pal, “Machine learning based failure prediction of printing machines using internal productivity data,” International Journal of System Assurance Engineering and Management, 2025, (in Press).
About this article

The authors have not disclosed any funding.
The datasets generated during and/or analyzed during the current study are available from the corresponding author on reasonable request.
Avijit Kar: writing draft preparation, formal analysis, conceptualization, data curation, investigation and methodology. Arun Kiran Pal: writing review, editing and supervision.
The authors declare that they have no conflict of interest.
