Abstract
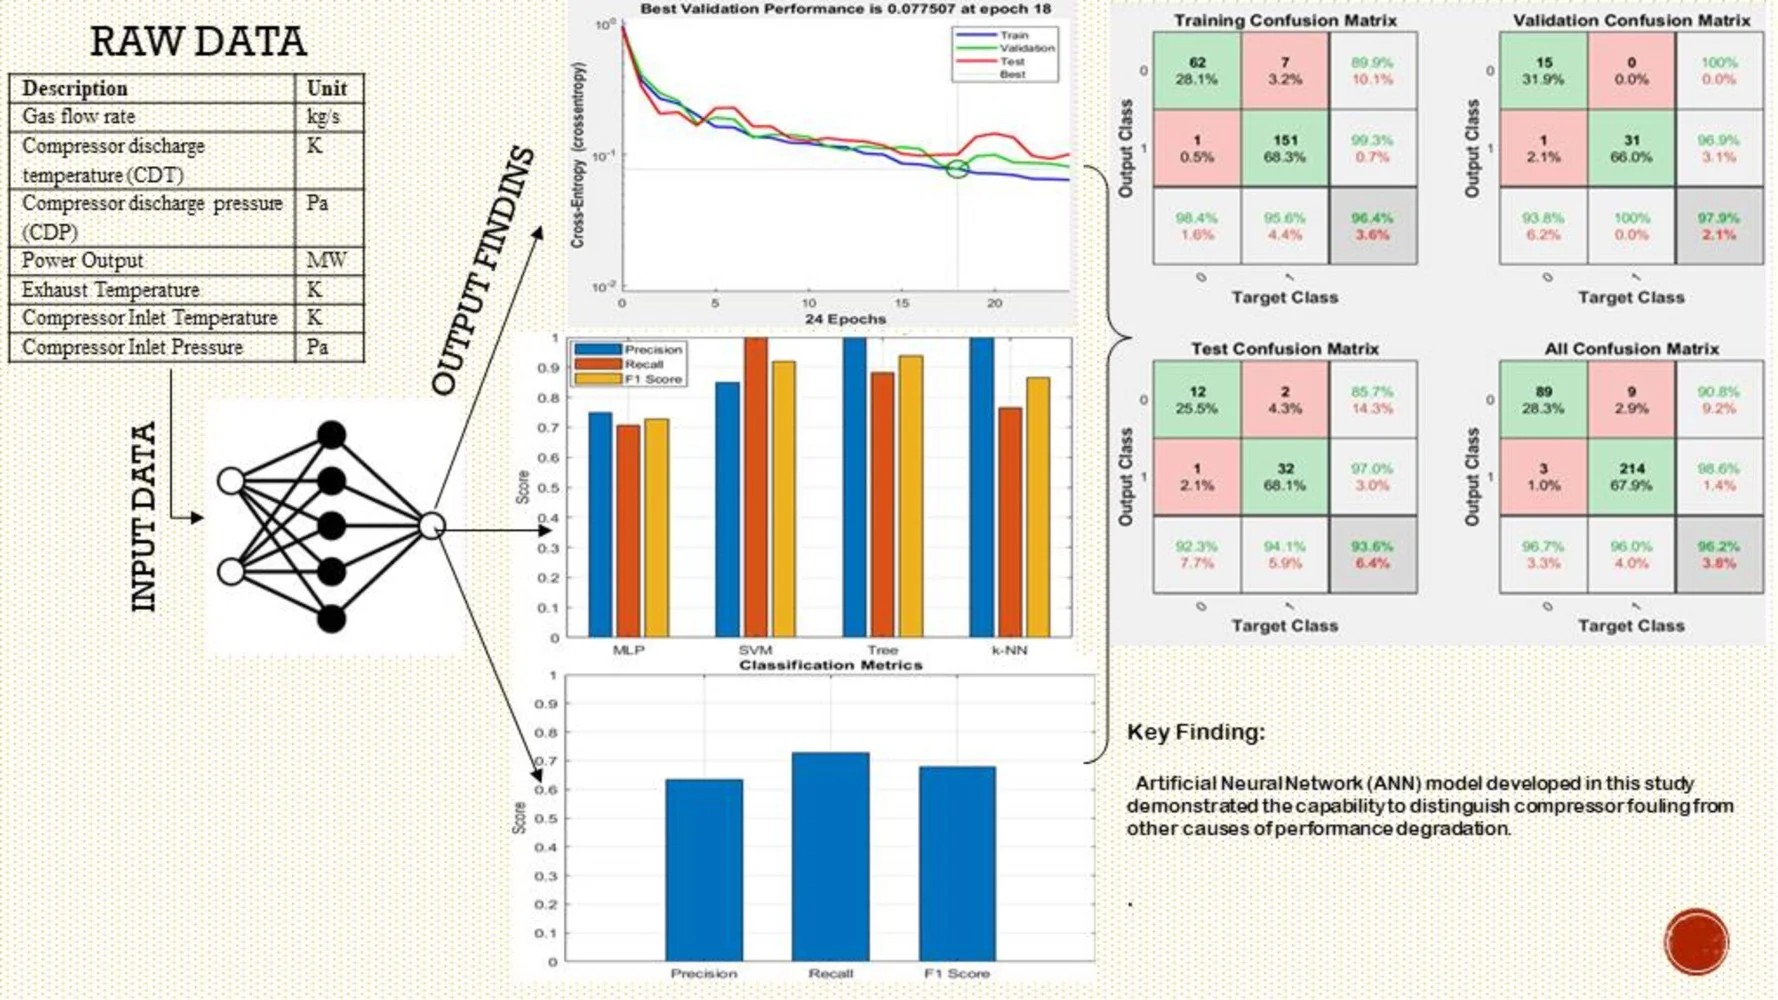
This study investigates the application of artificial neural networks for the detection of compressors fouling degradation in industrial gas turbines during operation to mitigate the loss in engine performance. An Artificial Neural Network (ANN)-based model was developed to monitor and predict compressor fouling degradation in an aero-derivative gas turbine derived from the Siemens SGT 400 class of gas turbines. Performance data from a Siemens SGT 400 gas turbine unit were obtained and used for the investigation. The obtained engine data represent all faults indicative of compressor performance. For the baseline, data were collected after maintenance actions had taken place, while the degraded case covers historical engine performance from 01 January 2013 to 28 February 2013, accounting for approximately 1,392 Equivalent Operating Hours (EOH). The dataset, encompassing variables such as temperature, pressure, gas flow, power, compressor discharge temperature, and compressor discharge pressure, was processed to eliminate irrelevant and redundant parameters before usage. A Multi-Layer Perceptron (MLP) was chosen as the architecture for the ANN. The outcomes of the training phase showed that the ANN achieved a classification accuracy of 96.2 % in proficiently distinguishing between “fouling” and "other factors" conditions. Additionally, the validation performance plot demonstrates that the network achieved its best performance with a value of 0.077507 at 18 epochs out of 24 training iterations. Finally, the confusion matrix demonstrates the model's capability to predict both fouling and non-fouling scenarios with a minimal rate of misclassification.
Highlights
- The Artificial Neural Network (ANN) model developed in this study demonstrated the capability to distinguish compressor fouling from other causes of performance degradation.
- During the training phase, the ANN achieved a classification accuracy of 96.2%, effectively differentiating between "fouling" and "other conditions”.
- The model demonstrated the best balance between recall and precision when compared to other classification algorithms.
- The confusion matrix further confirmed the model’s capability to accurately classify both fouling and non-fouling scenarios, with a minimal rate of misclassification.
1. Introduction
Gas turbines in operation ingest large volumes of airflow, which often contain foreign particles ranging from dust and soot to moisture, hydrocarbon aerosols, and salt, depending on the environment [1]. When airflow is ingested along with these particles into the gas turbines, some of these particles accumulate on the blades and vanes of the compressor, resulting in a phenomenon known as compressor fouling. This buildup leads to performance degradation by reducing mass flow rate, isentropic efficiency, and power output, ultimately increasing operational costs. From an economic perspective, Meher-Homji and Bromley [2] conducted a study on the effects of compressor fouling on two gas turbines: Frame 5 and Frame 9, with power outputs of 26 MW and 225 MW, respectively. Both units were operated on natural gas under base load conditions. The study found an average annual reduction in power output of 3 % and an increase in heat rate of 1 %, assuming 8,000 hours of operation per year. These performance losses were estimated to result in an annual cost of approximately $500,000 for the 26 MW engine and over $5 million for the 225 MW engine.
The detection of compressor fouling is crucial to enable the initiation of measures to mitigate its effects and ensure reliable operation. Compressor washing is a viable means of preventing the effects of fouling and particle deposition on gas turbine compressor blades. It involves the injection of liquid, such as demineralized water or a combination of detergents, using a water-wash system. However, for the maintenance exercise to be effective, appropriate steps need to be taken to initiate the maintenance action at the right time [3].
Recently, some gas turbine users have started employing a condition-based monitoring approach to predict overall engine performance and initiate maintenance activity only when necessary. In this method, a system is put in place to accurately monitor and predict the deterioration of engine performance parameters caused by fouling. The main challenge of this approach lies in establishing a system capable of accurately predicting fouling degradation, as most performance parameters indicative of compressor fouling are also influenced by other factors. Consequently, finding a system sensitive only to fouling has made condition-based compressor washing almost unrealistic [4].
According to Levine and Angello [5], monitoring performance parameters such as fuel flow and power output is essential for gas turbine users to account for the economic benefits of conducting compressor washing. Additionally, the authors noted that the selection of parameters for diagnosing gas turbine performance degradation plays a significant role. For instance, when monitoring the condition of a compressor, it is appropriate to select only parameters sensitive to compressor degradation. A widely used method for monitoring engine conditions over time has been the deviation of engine performance from its reference condition. However, this method has proven unreliable due to the non-linear performance shifts associated with engine degradation [3]. Bakken and Skorping [6] stated that rigorous sensitivity analysis is required to establish the actual state of the gas turbine if performance degradation diagnostics are based on variations from reference conditions. This is because any cause of engine deterioration can potentially alter the fault signature, which would depend on the operating state.
Raghavan et al. [7] illustrated the application of advanced machine learning techniques for performance analysis, fault diagnosis, and prediction of future gas turbine compressor performance. Residuals of critical parameters were used as input into a trained ANN to identify the rate of compressor fouling at an early stage. Asgari et al. [8] developed a methodology based on ANN for offline system identification of a gas turbine. Different ANN models with two-layer feed-forward multi-layer perceptron (MLP) structures were created and trained using a comprehensive computer program developed and run in the MATLAB environment. The resulting model predicted system performance with high accuracy. The authors reported achieving a comprehensive view of the performance of different ANN models for system identification of a single-shaft gas turbine using their proposed methodology. Osigwe et al. [9] presented an integrated gas turbine system diagnostic tool based on an ANN diagnostic system to quantify gas turbine component and sensor faults.
A dynamic systems model describing the natural degradation of compressor efficiency, along with discrete jumps in efficiency, was incorporated into the model predictive control optimizer [10]. Botos et al. [11] developed a model that combines gas path analysis to evaluate thermodynamic parameters over the engine cycle. This was followed by an estimation model based on error-in-variable to filter data for potential noise due to instrumentation error. The authors reported that the model successfully quantified degradation. A machine learning-based technique was employed to predict gas turbine performance for power generation [12]. Two surrogate models based on High Dimensional Model Representation (HDMR) and Artificial Neural Networks (ANN) were developed using real operational data. The authors reported that the operating characteristics of the air compressor and turbine were effectively predicted by the developed models, demonstrating the potential of AI in predicting the performance of gas turbines. Liu et al.[13] developed a physics-informed machine learning methodology that incorporated thermodynamic heat balancing mechanisms, component characteristics, multi-source data, and neural network models to predict gas turbine degradation. The study provided insights into parameters that are difficult to measure directly through the simulation of the thermodynamic performance model under different conditions. The study demonstrated that the complex dynamics of gas turbines can be effectively captured by combining physics-based models with machine learning techniques.
Digital twin technology has emerged as a pivotal tool for monitoring and enhancing gas turbine performance. By creating virtual replicas of physical turbines, digital twins enable real-time data analysis, facilitating predictive maintenance and performance optimization [14], [15]. This technology collects and processes real-time data from numerous sensors embedded in gas turbines, providing valuable insights that enhance operational efficiency and reliability. Through digital twin solutions, organizations can proactively identify issues, reduce downtime, and optimize turbine performance.
From the foregoing, it is evident that many studies have applied artificial neural networks (ANNs) for general gas turbine fault diagnosis and system identification, a clear gap remains in their application to real-time, condition-based monitoring of compressor fouling. Most prior models were developed for offline diagnostics, and failed to isolate compressor fouling effect from other forms of performance degradations.
This study directly addresses these limitations by developing an ANN model trained on real-world operational data from a Siemens SGT 400 turbine, with a clear objective of classifying compressor fouling in an operational setting, independent of generic performance degradation.
Thus, this present study focuses on the detection of compressor fouling as a standalone condition rather than general turbine fault classification. Also, using operational data from a gas turbine unit in operation enhances real-world applicability compared to simulation-based generated data used.
2. Materials and methods
2.1. Gas turbine engine data collection and analysis
In this study, performance data from a Siemens SGT 400 gas turbine unit were obtained and analyzed. The engine data collected represents all faults indicative of compressor performance. For the baseline, data were collected after maintenance actions had been performed, while the degraded case represents historical engine performance data following 1,392 Equivalent Operating Hours. Consequently, the collected data was corrected and normalized to a manageable range for easier analysis.
Table 1 presents the design point performance specifications of the SGT 400 gas turbine engine.
Table 1Design point performance specifications of the SGT 400 gas turbine engine
Design parameters | Units |
Power output | 10.9 MW |
Thermal efficiency | 36.4 |
Pressure ratio | 16.4 |
Exhaust temperature | 783 K |
Exhaust flow rate | 34.3 kg/s |
2.2. ANN model methodology
A dataset containing 1,890 samples was obtained from SGT 400 engine performance records to assess compressor performance. These data included performance parameters such as temperature, pressure, gas flow, power output, compressor discharge temperature, and compressor discharge pressure, all of which are indicative of compressor performance. For analysis, the data were systematically divided into training (70 %), validation (15 %), and testing (15 %) sets. All data processing and computations were conducted using Microsoft Excel, ensuring a structured and organized approach to dataset preparation.
The data were subsequently pre-processed for training the artificial neural network (ANN). This critical step involved several stages aimed at enhancing the quality and reliability of the input data. Initially, the data were imported from a CSV file into the MATLAB workspace using the readtable function, which facilitated seamless integration into the analysis environment.
To address the issue of missing data, a common challenge in real-world datasets, the fillmissing function was employed. Missing values were imputed by replacing them with the mean of the corresponding variables, preserving overall trends in the data while minimizing the impact of gaps. This approach ensured that the dataset remained robust and representative of underlying patterns without introducing significant biases.
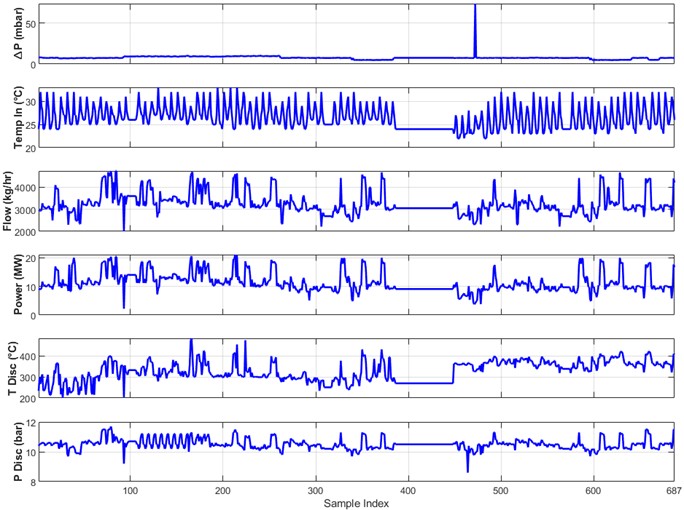
Fig. 1 illustrates the raw engine data plot for the various performance parameters. This step not only helped maintain data integrity but also facilitated smoother model training.
Fig. 1Raw data plots for the different performance parameters
Given the supervised learning nature of this research, the Multi-Layer Perceptron (MLP) was chosen as the architecture for the artificial neural network (ANN). MLP is particularly well-suited for problems requiring classification or regression due to its ability to capture complex, non-linear relationships through its layered structure of interconnected neurons. This architecture was selected for its proven effectiveness in handling large, multi-dimensional datasets like the one used in this research.
To prepare the data for optimal performance within the MLP model, normalization was applied. Normalization is a critical pre-processing step in machine learning, designed to ensure that each feature contributes equally to the training process. In this study, the Min-Max Scaler was utilized, a widely adopted technique that transforms data by rescaling it to fit within a specified range, typically between 0 and 1. This is achieved by subtracting the minimum value of each feature and dividing by the range (the difference between the maximum and minimum values). This ensures that all features, regardless of their original scale, are brought into a common range, which is crucial for models like MLP that are sensitive to variations in feature magnitude.
Careful attention to normalization is especially important in multi-layer architectures like MLP, where the gradient-based optimization techniques used to train the network can be significantly affected by the scale of the input data. The use of the Min-Max Scaler mitigates the risk of one feature dominating the training process due to its scale, ensuring that all variables are treated equally during optimization. This ultimately leads to a more balanced and effective learning process, enhancing the model's ability to generalize across different operating conditions and providing a more reliable isolation of fouling phenomena.
The input and output parameters from the compressor utilized in the ANN model are shown in Table 2. The relationship between the input and output parameters is non-linear and complex.
Table 2Input and output parameters from the compressor utilized in the ANN model
Description | Unit |
Gas flow rate | kg/s |
Compressor discharge temperature (CDT) | K |
Compressor discharge pressure (CDP) | Pa |
Power output | MW |
Exhaust temperature | K |
Compressor inlet temperature | K |
Compressor inlet pressure | Pa |
2.3. Network objective and performance
The network was designed to classify engine measurement data into two broad categories: “fouling” and “no fouling”. This initial classification was essential for identifying whether any form of fouling was present. The ANN model was trained using 315 samples across six critical measurement parameters, which included key indicators such as compressor inlet temperature, compressor inlet pressure, gas flow, power output, compressor discharge temperature, and compressor discharge pressure. These parameters are closely linked to the overall health and performance of the engine, particularly the compressor, making them reliable indicators for detecting the potential of compressor fouling.
The target output for the ANN model was binary, with 0 representing “no fouling” and 1 indicating the presence of “fouling”. The focus was on fouling detection as a broad category.
During the training phase, the network was continuously evaluated and optimized to minimize misclassifications and ensure robust performance. For the ANN model, the accuracy in detecting general fouling was paramount, as errors at this stage could result in either missed fouling events (false negatives) or unnecessary fouling analysis (false positives). Therefore, the network was fine-tuned to accurately identify fouling patterns while distinguishing them from other causes of degradation, avoiding overfitting to specific scenarios.
3. Results and discussion
3.1. Confusion matrix for ANN network
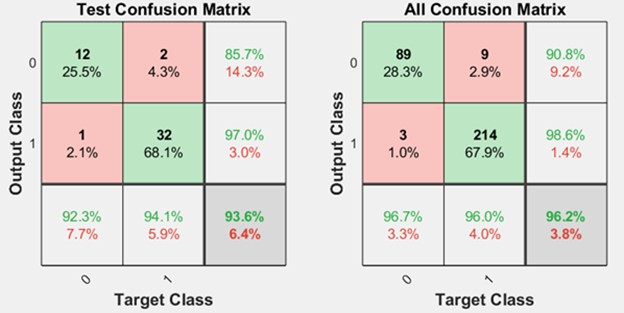
The network’s performance was evaluated using a confusion matrix (Fig. 2), which provides a detailed breakdown of the model’s classification results. Out of the total samples, 89 were correctly classified as “no fouling”, indicating that the network successfully recognized the absence of significant engine issues in these cases. However, nine samples were incorrectly classified as “no fouling”, representing instances where fouling was present but undetected by the network. This misclassification highlights the ongoing challenge of ensuring sensitivity without compromising specificity.
On the other hand, 214 samples were correctly classified as “fouling”, demonstrating the network’s strong capability to detect and flag instances of compressor fouling. Nevertheless, three samples were misclassified as 'fouling,' indicating that the network incorrectly identified normal operation as fouling. This underscores the need for continued refinement to distinguish subtle variations between normal operating conditions and the early stages of fouling.
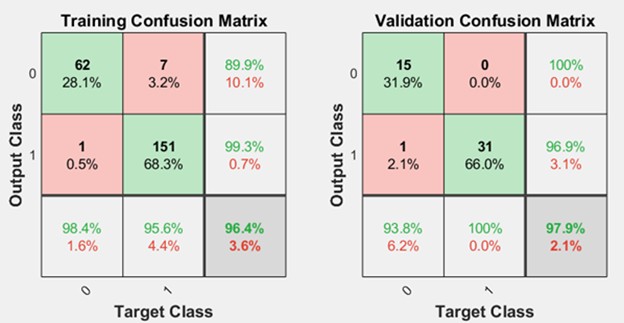
Following 28 iterations (epochs) of training, validation, and testing, the network was evaluated across multiple architectures, including the 6-15-1 configuration, which consists of six input nodes, 15 hidden nodes, and one output node. Through this process, the network achieved a high generalization classification accuracy of 96.2 %, signifying its ability to generalize well across unseen data. The misclassification rate was 3.8 %, reflecting the percentage of samples incorrectly categorized by the network.
Analysis of the accurately classified patterns revealed that 67.9 % of the samples were correctly identified as “fouling”, indicating that more than half of the fouling cases were successfully detected by the network. Meanwhile, 28.3 % of the samples were correctly identified as “no fouling”, highlighting the network’s strong performance in recognizing normal operating conditions. These findings align closely with the results presented by Osigwe et al. [9]. These results demonstrate the network’s effectiveness in balancing accuracy between the “fouling” and “no fouling” categories, particularly given the complexity of the task. The high classification accuracy reflects the success of the training process, during which the network was exposed to a variety of patterns to learn the distinguishing features of fouling. Additionally, the network’s relatively low misclassification rate highlights its robustness, ensuring that the system can make reliable decisions even when confronted with diverse operational scenarios.
Fig. 2Confusion matrix for ANN model
3.2. Validation performance
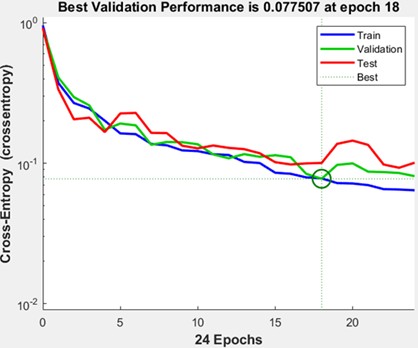
The validation performance plot in Fig. 3 further illustrates the network’s training progress and its ability to generalize well to unseen data. The plot indicates that the network achieved its best performance at 0.077507 during epoch 18, out of a total of 24 training iterations. This inflection point marks the moment when the network attained the optimal balance between fitting the training data and generalizing to the validation set, thereby minimizing the risk of overfitting. The Mean Square Errors reported in the study are comparable to the results presented in Asgari et al. [8], demonstrating that the results obtained are acceptable.
The identification of epoch 18 as the point of best performance provides crucial insights for model tuning and future optimization efforts. By pinpointing this epoch, it becomes evident that further iterations beyond this point did not improve performance and may have slightly degraded the network’s accuracy due to overfitting. This observation highlights the importance of careful monitoring during training to ensure the network is not excessively fine-tuned to the training data, which could result in diminished performance when applied to new, unseen data.
The ability to identify the optimal performance epoch also underscores the efficacy of the network's early stopping mechanism, a strategy used to prevent overfitting by halting training once performance ceases to improve. This mechanism ensures that the model operates efficiently without undergoing unnecessary computations, streamlining the training process and conserving computational resources.
Overall, the network’s performance during testing and validation demonstrates its capability to handle large-scale, real-world datasets containing noise, outliers, and variability. The results emphasize the network’s capacity to meet the task objective of fouling isolation while maintaining a high level of precision and accuracy in challenging conditions. These findings are indicative of the ANN’s potential for deployment in operational settings, where the ability to process noisy, complex data in real time is essential for ensuring timely and accurate detection of fouling and other forms of degradation.
Fig. 3Validation performances for the ANN model
3.3. Validation checks for ANN model
Fig. 4 provides a clear illustration of the network’s training state, highlighting a key moment at epoch 41 where the validation check is recorded as shown in Fig. 4. This validation check is an essential part of the training process, serving as a mechanism to continuously evaluate the network's performance against the validation set. The purpose of this check is to ensure that the network is not merely fitting the training data but is also generalizing effectively to unseen data, which is crucial for achieving reliable performance in real-world applications.
The validation check plays a critical role in preventing overfitting, a common issue in machine learning where the network becomes overly specialized to the training data and loses its ability to generalize to new data. By regularly comparing the network’s predictions on the validation set, the training process can identify when the network has reached its optimal performance and when further training is no longer beneficial. In this case, the validation check at epoch 41 suggests that the network had already begun stabilizing, and further training was monitored to ensure that it continued to generalize effectively without overfitting.
This consistent monitoring through validation checks helps guide decisions about early stopping, a technique used to halt training once no further improvements are observed in validation performance. In this instance, the validation check at epoch 24 indicates that the network was functioning well, and the training process was able to maintain a balance between fitting the training data and preserving generalization. By periodically validating the network’s performance, the training state can be adjusted as necessary, ensuring that the final model is both accurate and robust.
Overall, the validation check at epoch 24 demonstrates the careful attention to network performance throughout the training process, ensuring that the model not only meets the task objectives but also maintains the ability to generalize across different datasets and conditions. The validation monitoring approach contributes significantly to the network’s overall robustness and success in achieving accurate fouling isolation, positioning it as a valuable tool for predictive maintenance and performance optimization in gas turbines and other complex systems.
Fig. 4Validation checks for ANN model
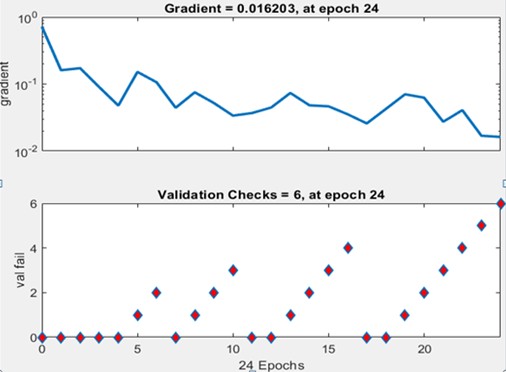
Fig. 5 shows bar chart plots precision, recall, F1-score metrics, which provides a more comprehensive evaluation of the performance of the model. From Fig. 5, it is evident that the precision, recall, and F1-score generated 0.63, 0.73 and 0.68 respectively. The precision score of 0.63 suggests that over 60 % of fouling predictions were accurate, while a recall of 0.73 indicates that the model successfully detected 73 % of all fouling instances. The F1-score of 0.68 reflects a balanced trade-off between precision and recall, confirming the network’s effectiveness in handling class imbalance. While Fig. 6 shows the ROC curve which provided a graphical representation of the model’s ability to distinguish between fouling and non-fouling states across various thresholds. The curve remained consistently above the random-guess baseline, with an Area Under the Curve (AUC) of approximately 0.93, indicating strong overall classification power.
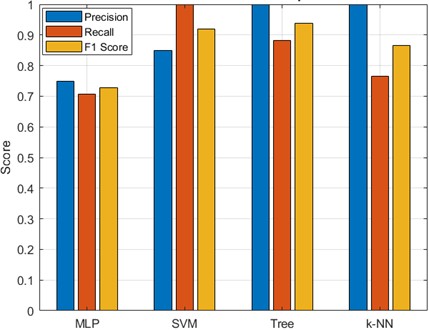
To assess the model’s relative performance, the developed 6-15-1 MLP with other classification algorithms such as Decision Tree (DT), Support Vector Machine (SVM), and k-Nearest Neighbors (k-NN) were compared as shown in Fig. 7. As can be seen from the figure, the MLP achieved the best balance between recall and precision, the SVM slightly outperformed it in recall but at the cost of precision. Decision Trees offered higher interpretability but lower sensitivity to fouling, while k-NN suffered from reduced generalization due to the limited dataset size.
Fig. 5Bar chart plots precision, recall and F1-score
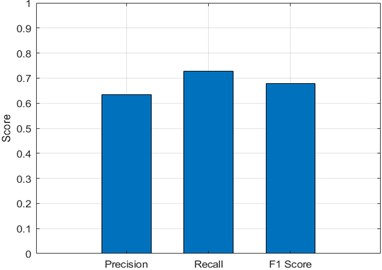
Fig. 6Plots for ROC performance analysis for the model
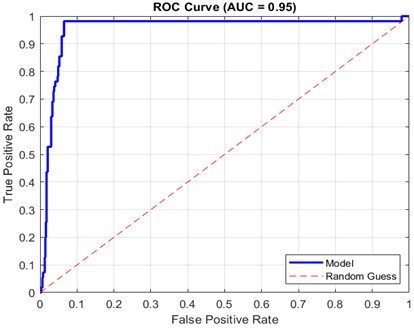
Fig. 7Classifier performance comparison
4. Recommendations
Model Optimization: While the ANN performed well, further refinement of its architecture such as experimenting with different numbers of hidden layers and neurons may improve accuracy and reduce misclassification.
Feature Engineering: Incorporating additional features, especially those informed by domain-specific knowledge, could enhance the model’s ability to differentiate between fouling and non-fouling scenarios.
Data Expansion: Increasing both the volume and diversity of the dataset by including a wider range of operational conditions could strengthen the model’s generalizability and resilience.
Real-Time Implementation: To fully leverage the benefits of the trained ANN, it is recommended to integrate the model into a real-time monitoring system. This would enable early detection of fouling, thereby improving maintenance scheduling and minimizing equipment downtime.
5. Conclusions
In this study, an Artificial Neural Network (ANN) was developed and trained to accurately classify engine measurement data patterns for the purpose of distinguishing compressor fouling from other causes of performance degradation. The dataset included variables such as temperature, pressure, gas flow, power, compressor disc temperature, and compressor disc pressure. Prior to training, the data underwent preprocessing steps, including imputation of missing values, feature extraction, and normalization using the Min-Max Scaler.
The ANN, specifically a Multi-Layer Perceptron (MLP), was trained using 1,890 data points, which were divided into training, validation, and testing subsets. The training results demonstrated that the ANN achieved a classification accuracy of 96.2 % in distinguishing between “fouling” and “other factors”. Analysis of the confusion matrix highlighted the model’s proficiency in predicting both fouling and non-fouling conditions, with a low misclassification rate. The ANN’s ability to generalize across varied datasets, despite the presence of noise or bias, underscores its robustness and reliability in practical applications.
References
-
F. C. Mund and P. Pilidis, “Gas turbine compressor washing: historical developments, trends and main design parameters for online systems,” Journal of Engineering for Gas Turbines and Power, Vol. 128, No. 2, pp. 344–353, Apr. 2006, https://doi.org/10.1115/1.2132378
-
C. B. Meher-Homji and A. Bromley, “Gas turbine axial compressor fouling and washing,” in 33rd Turbomachinery Symposium, 2004.
-
R. Agbadede, “Industrial gas turbine performance enhancement through online compressor washing,” Ph.D. Thesis, Cranfield University, Cranfield, 2014.
-
J. D. Baker, “Analysis of the sensitivity of multi-stage axial compressors to fouling at various stages,” M.Sc. Thesis, Naval Postgraduate School, USA, 2002.
-
P. Levine and L. Angello, “Axial compressor performance maintenance,” in ASME Turbo Expo 2005: Power for Land, Sea, and Air, Vol. 4, pp. 1–8, Jan. 2005, https://doi.org/10.1115/gt2005-68014
-
L. E. Bakken and R. Skorping, “Optimum operation and maintenance of gas turbines offshore,” in ASME 1996 International Gas Turbine and Aeroengine Congress and Exhibition, Jun. 1996, https://doi.org/10.1115/96-gt-273
-
S. M. Raghavan, A. Palatel, and J. Simon, “Artificial intelligence based gas turbine compressor wash: a predictive approach,” in ASME 2019 Gas Turbine India Conference, Dec. 2019, https://doi.org/10.1115/gtindia2019-2434
-
H. Asgari, X. Chen, M. B. Menhaj, and R. Sainudiin, “Artificial neural network-based system identification for a single-shaft gas turbine,” Journal of Engineering for Gas Turbines and Power, Vol. 135, No. 9, Sep. 2013, https://doi.org/10.1115/1.4024735
-
O. E. Osigwe, Y. Li, S. Suresh, and G. Jumbo, “Integrated gas turbine system diagnostics: components and sensor faults quantification using artificial neural network,” in 23rd International Symposium for Air-Breathing Engines – ISABE 2017, 2017.
-
G. Hovland and M. Antoine, “Scheduling of gas turbine compressor washing,” Intelligent Automation and Soft Computing, Vol. 12, No. 1, pp. 63–73, Jan. 2006, https://doi.org/10.1080/10798587.2006.10642916
-
K. K. Botros, H. Golshan, and D. Rogers, “Effects of engine wash frequency on GT degradation in natural gas compressor stations,” in ASME Turbo Expo 2013: Turbine Technical Conference and Exposition, Jun. 2013, https://doi.org/10.1115/gt2013-94059
-
Z. Liu and I. A. Karimi, “Gas turbine performance prediction via machine learning,” Energy, Vol. 192, p. 116627, Feb. 2020, https://doi.org/10.1016/j.energy.2019.116627
-
X. Liu et al., “Intelligent fault diagnosis methods toward gas turbine: A review,” Chinese Journal of Aeronautics, Vol. 37, No. 4, pp. 93–120, Apr. 2024, https://doi.org/10.1016/j.cja.2023.09.024
-
V. Panov and S. Cruz-Manzo, “Gas turbine performance digital twin for real-time embedded systems,” in ASME Turbo Expo 2020: Turbomachinery Technical Conference and Exposition, Sep. 2020, https://doi.org/10.1115/gt2020-14664
-
V. M. Kaplan, “Digital twin model for gas turbine power generation forecasting,” M.Sc. Thesis, Norwegian University of Science and Technology, Norway, 2023.
-
C. S. Omoniabipi, R. Agbadede, K. C. Emmanuel, O. J. Adewuni, and I. Allison, “Investigation of the application of an automated monitoring system for detecting transmission cable deterioration in Nigeria: A case study of transmission cable lines between Offa and Oshogbo,” Results in Engineering, Vol. 25, pp. 104165, 2025.
About this article

The authors have not disclosed any funding.
The authors are exceedingly grateful to Faculty of Engineering, Nigeria Maritime University, Okerenkoko, for providing all technical assistance.
The datasets generated during and/or analyzed during the current study are available from the corresponding author on reasonable request.
Roupa Agbadede: original draft, reviewing, and editing of the final draft. Tosin Folorunsho: Formal analysis, investigation, methodology, writing some sections of the original draft. Cornelius Sunday Omoniabipi: Formal analysis, investigation, validation, and writing some sections of the original draft
The authors declare that they have no conflict of interest.
