Abstract
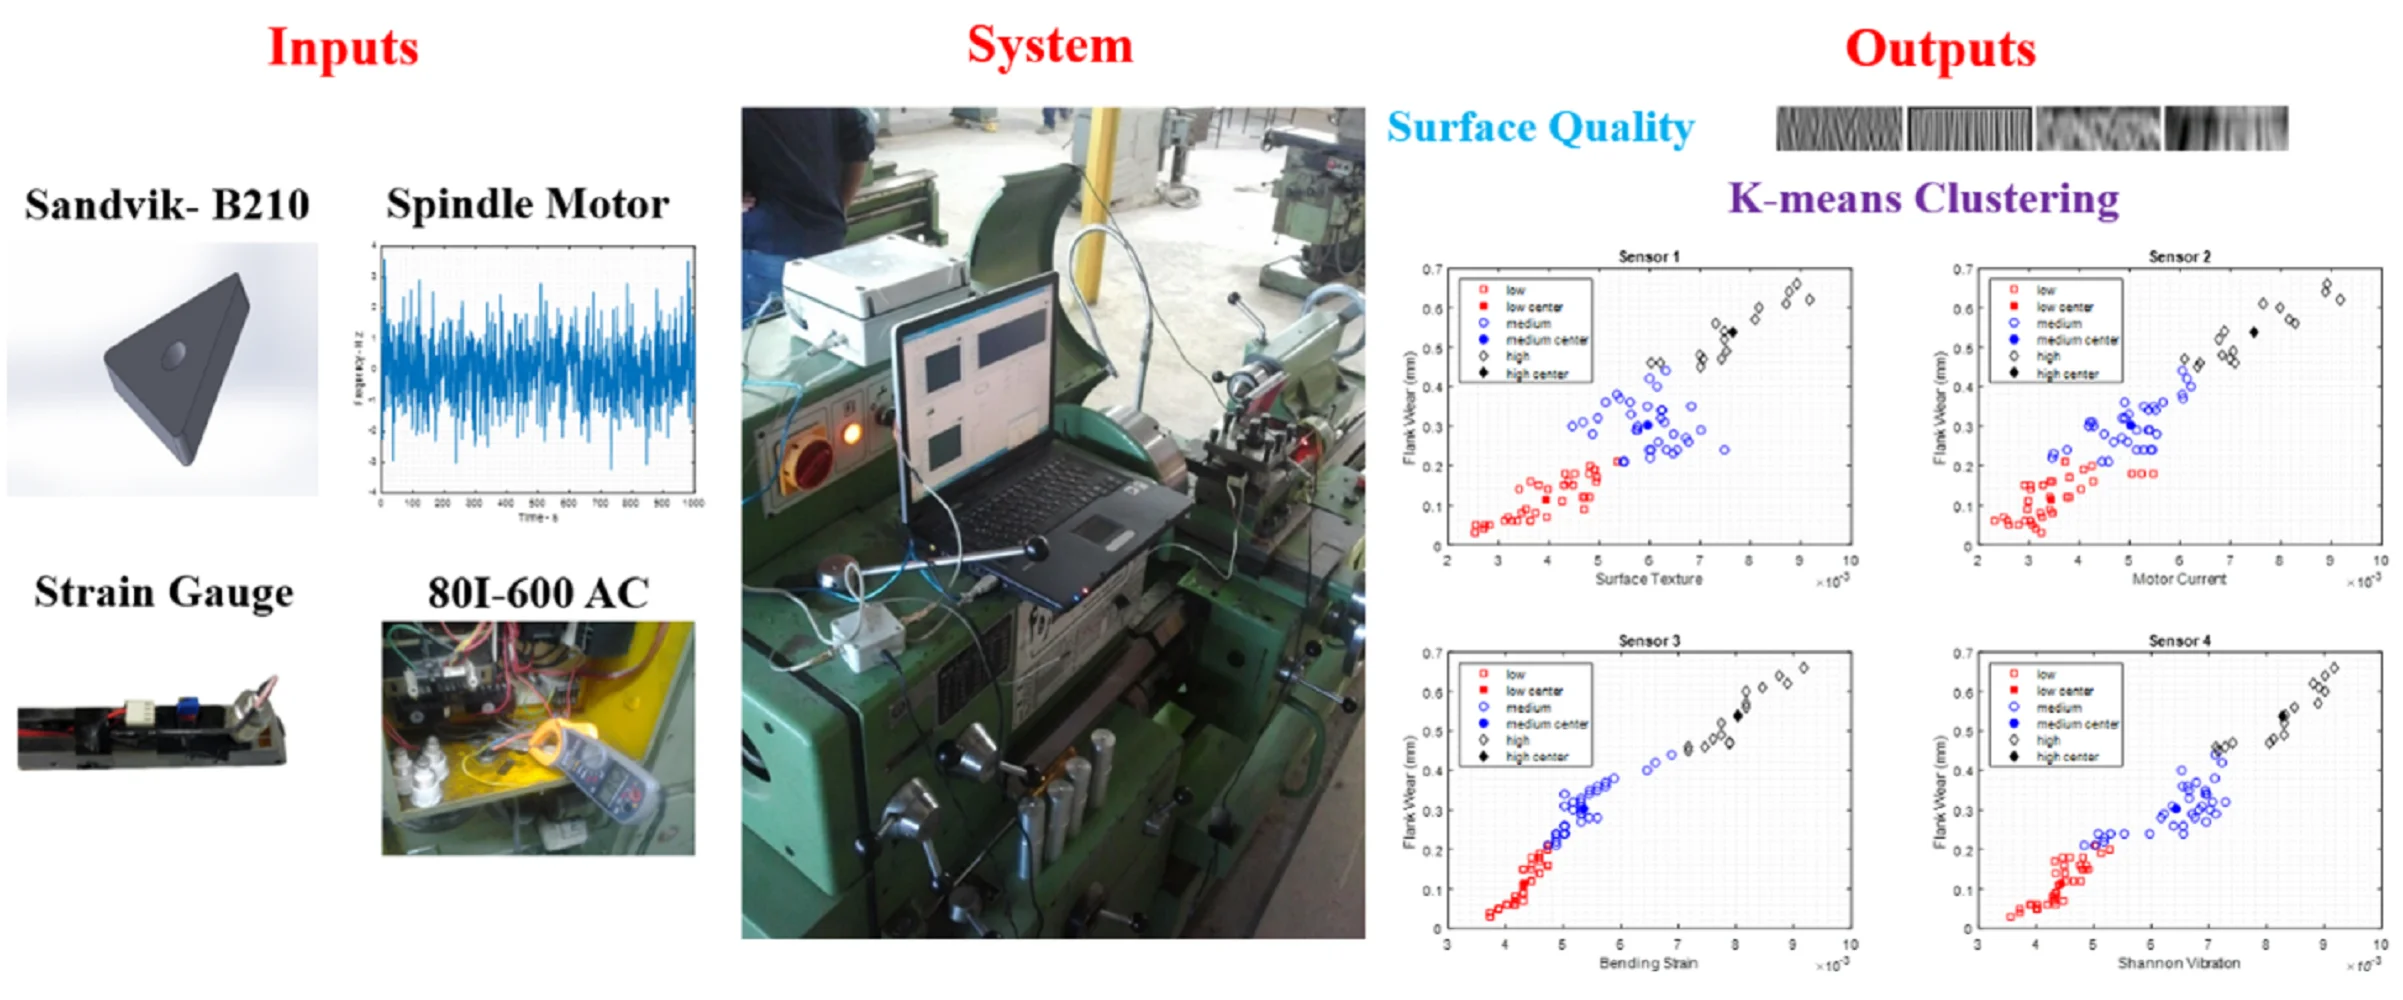
In this study, a novel multi-sensory data fusion approach is developed for real-time tool wear condition monitoring during the turning process, addressing the limitations of single-sensor systems that often suffer from noise and uncertainty. By integrating data from four distinct sensors – machine vision, electrical current, accelerometer, and strain gauge – this method enhances the reliability and robustness of wear state identification. Key features extracted include the entropy of the workpiece’s surface texture via stationary wavelet transform, the time-frequency marginal integral of the motor current, and the Shannon entropy of both the cutting tool’s bending strain and acceleration signals. These features are fused using K-means clustering with Lloyd’s algorithm to classify tool wear into three distinct categories: low (0-0.1 mm), medium (0.1-0.2 mm), and high (> 0.2 mm). Experimental results demonstrate that this approach achieves a classification accuracy of 95 %, significantly outperforming traditional single-sensor methods, which typically yield accuracies below 80 %. This scalable and efficient technique is well-suited for intelligent manufacturing, offering precise tool replacement decisions with minimal computational overhead.
Highlights
- Multi-Sensor Fusion Framework
- Unsupervised K-Means Classification
- Advanced Feature Extraction
- Edge-Computing-Ready Implementation
- Production-Oriented Workflow & Early-Warning Thresholds
1. Introduction
Recognizing the tool wear state for calculating tool life is a critical aspect of most metal cutting processes. Various techniques have been developed to assess the condition of cutting tools during the turning process. The most accurate, yet less efficient, methods involve direct examination of the tool using microscopes, laser devices, or machine vision systems [1-3]. Although these instruments are often more cost-effective than sensors used for indirect measurement, the effectiveness of direct methods is limited by the requirement to halt machining in order to assess tool condition. In contrast, indirect measurement methods incorporate sensors for continuous monitoring. Machine learning techniques can continuously evaluate sensor data relevant to tool wear conditions [4]. However, relying solely on sensory data for tool wear assessment can be unreliable due to the presence of noise and uncertainty [5, 6]. A viable solution to this challenge is sensor fusion, which combines inputs from multiple sensors to improve reliability. Decision-making based on multi-sensory observations has been shown to be distinctly superior to that based on single-sensor data. In multi-sensory observation, the data collected from various sensors must be processed to determine the condition of the cutting tool. Several data fusion strategies can be applied to integrate the extracted features, including the Indices Multiplication and Division Group (IMDG) [7], Comparison Group (CG) [8], Index Multiplication Group (IMG) [9], and Vector in Mapping Space Group (VMSG) [10]. The most common methods for final decision-making include artificial neural networks, fuzzy logic, hidden Markov models, support vector machines (SVM), and adaptive-network-based fuzzy inference systems [10, 11]. While these methods are widely used to predict or evaluate tool wear, they often lack the capability to classify data into clearly defined groups. This research investigates the application of multi-sensory data fusion using K-means clustering to monitor tool wear in the turning process. The key advantages of the proposed methodology are:
i) Real-time monitoring of tool wear states.
ii) Improved reliability through multi-sensor data integration.
iii) Faster convergence compared to many other machine learning techniques.
iv) Straightforward scalability with an increasing number and diversity of sensors
2. Literature review
This section reviews several pertinent published research contributions. These technologies either involve complex, systematic machine learning algorithms with promising results or utilize specific sensors for tool wear monitoring applications. Zheng et al. applied data fusion through a Long Short-Term Memory (LSTM) network to monitor tool wear status during the milling process under diverse cutting conditions [10]. Zhou et al. investigated tool wear conditions during milling operations using current sensors [12]. Laddada et al. employed wavelet transform and an enhanced Extreme Learning Machine (ELM) algorithm to monitor tool wear conditions [13]. Dai et al. developed and examined a machine vision system for monitoring the condition of micro milling tools [14]. Benkedjouh et al. utilized Continuous Wavelet Transform (CWT) and blind source separation techniques for tool wear monitoring [15]. Liu et al. assessed calibration-based tool condition monitoring for repetitive tasks [16]. Aghazadeh et al. employed spectral subtraction and convolutional neural networks (CNNs) for tool condition monitoring in the milling process [17]. Xie et al. proposed a feature selection method to enhance the efficacy of tool condition monitoring [18]. Ong et al. examined CNC tool condition using wavelet and neural network methodologies informed by machine vision [19]. Guo et al. investigated the use of support vector machines (SVM) and fluctuation analysis for tool condition monitoring in milling operations [20]. Rao et al. explored vibration-based tool condition monitoring in the milling of Ti-6Al-4V using an optimization model combining Grey Model (GM) and SVM [21]. Zhou et al. conducted tool wear condition monitoring using a two-layer angle kernel extreme learning machine and a sound sensor during the milling process [22]. Danesh et al. proposed an optimized artificial fuzzy inference sensor fusion system for tool wear monitoring [23]. Kuntoğlu et al. reviewed decision-making and indirect tool monitoring methodologies [11]. Zhu et al. conducted numerical simulations and applied a Generative Adversarial Network (GAN) to monitor tool wear states in intelligent milling processes [24]. Li et al. investigated the integration of mapping radar, AdaBoost-DT, and SBiLSTM techniques for tool wear monitoring [11]. He et al. introduced a deep learning approach utilizing stacked sparse autoencoders (SSAE) and multi-sensor feature fusion for milling tool wear prediction [25]. J. Fan et al. used the density peaks approach for grouping multisensory observation data for fusion [26]. Li and Wang introduced novel optimal C-means and K-means algorithms for clustering datasets using soft computing, demonstrating applications in biological data, language, texture, customer information, email messages, and image data [27, 28]. K-means clustering is widely used for recognizing tool wear states due to its simplicity and efficiency. However, the standard K-means algorithm is sensitive to centroid initialization, which can lead to inconsistent clustering results. To address this, enhancements such as Fixum K-means (F-Km) have been developed. These improve accuracy and robustness by refining the initial centroid selection process. F-Km has shown superior performance in clustering tool wear data, achieving higher precision and faster convergence compared to standard K-means and K-means++ algorithms [29]. Several variants of the K-means algorithm have been proposed to overcome its limitations, such as sensitivity to initial conditions and the requirement for a predefined number of clusters. For instance, the U-K-means algorithm automatically determines the optimal number of clusters without requiring prior parameter selection, enhancing its utility in unsupervised scenarios [30]. Additionally, multiple-kernel K-means clustering with late fusion has been introduced to reduce computational complexity while maintaining high clustering performance [31]. In the context of cutting tool state recognition, K-means clustering is used to classify tool conditions based on sensor data, such as cutting force measurements. This facilitates real-time monitoring and adaptive control of machining processes. For example, a real-time recognition system using K-means clustering has been developed to classify cutting tool states with high accuracy, enabling efficient machining of complex structural parts [32]. Moreover, integrating K-means with other clustering methods, such as Gaussian Mixture Models (GMM), has demonstrated improved stability and effectiveness in detecting machining chatter [33]. Despite its widespread use, K-means clustering faces challenges in handling high-dimensional data and detecting non-spherical cluster shapes. Future research is focused on developing more robust clustering algorithms that can automatically adapt to varying data characteristics and improve clustering accuracy in complex manufacturing environments [34, 35]. Furthermore, integrating advanced feature learning techniques, such as deep neural networks, with K-means clustering represents a promising direction for enhancing clustering performance in high-dimensional spaces [36].
3. Problem statement and the proposed solution
In machining shops, it is often more desirable to determine the condition of the cutting tool in terms of wear states – such as normal wear, medium wear, or critical wear – rather than measuring the exact value of tool wear. In this research, the K-means clustering method is employed for sensory data fusion and classification of tool wear states. One advantage of K-means clustering in cutting condition monitoring is its ability to create distinct boundaries between wear categories, in addition to providing an estimate of wear. Each cluster has a representative centroid that can be used to estimate the level of tool wear by comparing new data to these centroids, enabling predictions in subsequent tests. In this study, a K-means clustering model was developed to integrate features from surface imagery, motor current, mechanical strain, and vibrational signals. The proposed model includes four inputs and one output. The inputs are: (i) the entropy of the surface image filtered using the Stationary Wavelet Transform (SWT), (ii) the time-frequency marginal integral of the motor current, (iii) the Shannon entropy of strain signals, and (iv) the Shannon entropy of vibration signals. The output of the model is the estimated flank wear. The results show that the K-means clustering model effectively integrates signal features and accurately predicts tool flank wear. By clustering tool states based on integrated features, the model enhances the flexibility of tool replacement decisions in intelligent manufacturing systems. To validate the proposed tool monitoring system, an accelerometer was mounted on the shank of the cutting tool to measure vibrations caused by tool wear in the feed direction. A vision system was also employed to monitor tool condition by analyzing the surface texture of the workpiece, thereby corroborating the results across multiple tests. The findings demonstrate the robust performance of the proposed system and highlight its strong potential for practical application in tool wear detection. By utilizing four sensors – accelerometer, strain gauge, vision, and motor current – the system effectively addresses two primary challenges: signal noise and uncertainties inherent in both the system and experimental procedures.
4. Tool wear monitoring
The proposed tool wear monitoring system utilizes four sensors: an accelerometer, a strain gauge, a vision system, and a current sensor. This section details the methodology employed for signal analysis, feature extraction, data fusion, and clustering. Each stage plays a critical role in accurately identifying the condition of the cutting tool and ensuring the reliability of the monitoring system.
4.1. Motor spindle current sensing
Among the indirect methods for monitoring tool wear, motor current sensing offers the advantage of being non-intrusive to the cutting process while also being cost-effective. The relationship can be mathematically expressed as shown in Eq. (1) [37]:
The , , , , and refer to cutting force, rate of feed, current difference, motor current, and non-loading motor current, respectively. In this research, the method introduced in [1] is used to estimate tool wear based on motor current. In the machine tool’s engine, the alternating current (AC) of the spindle motor varies and can be used to estimate wear. Due to uncertainties in experimental conditions, waveform distortions are present. Experimental findings indicate that spindle current signals exhibit increased distortion as tool wear progresses [38]. The variation of harmonic and sinusoidal waves is considered, as discussed in [39]. According to the Fourier series theorem, any periodic waveform can be expressed as a combination of a fundamental waveform and a series of harmonic components. Harmonic frequencies are generally produced by nonlinear, load-attached devices [40]. In this study, the Short-Time Fourier Transform (STFT) of the motor current signal is first calculated, followed by the extraction of the time-frequency spectrogram. Then, to obtain the Frequency Marginal Integral (FMI), integration is performed along the time axis [41]. The mathematical definition of STFT is given in Eq. (2):
The , , and represent the window function, the signal, and the temporal index, respectively. The time-frequency spectrogram calculates the quadratic energy distribution of the signal, as defined in Eq. (3):
Here, to define the FMI, which corresponds to the smoothed power spectrum of the signal. The power spectrum illustrates how the signal’s power is distributed across different frequencies. Eq. (4) defines the frequency marginal integration:
In Eq. (5), the initial FMI value is subtracted from the FMI value obtained during machining:
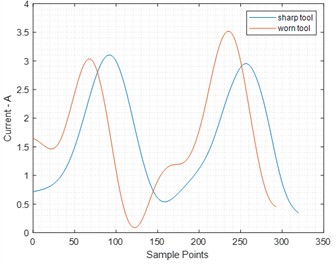
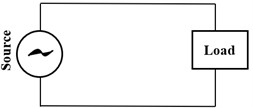
Motor current can be used to approximate cutting forces, which in turn can be employed to estimate tool flank wear. It is important to note that the feed motor’s current differs between loaded and unloaded conditions. Motor current sensing is a valuable technique for indirect tool wear monitoring, as it does not interfere with the machining process and can be implemented at low cost. In engine lathes with feed mechanisms driven by the spindle motor, tool wear assessment relies solely on measuring the current signal of the alternating current (AC) spindle motor. Consider a power system comprising an AC power supply and an electrical load, as shown in Fig. 1(a). Under ideal conditions, the current signal obtained from the load would be a perfect sinusoidal waveform. However, in practical scenarios, such ideal conditions are rarely achieved, resulting in significant waveform distortions, as illustrated in Fig. 1(b). Experimental results from researchers show that spindle current signals become increasingly distorted as tool wear progresses. Fig. 1(b) presents a segment of the current signal from the spindle motor drive under two tool conditions: sharp and worn.
Fig. 1Power system: a) AC source and electrical load, b) electric current waveform using a sharp tool
a)
b)
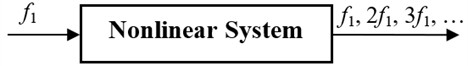
The deviation from an ideal sinusoidal waveform is commonly quantified using the term harmonic distortion waveform. A periodic waveform can be represented as a combination of multiple waveforms: a fundamental frequency component and a series of harmonic components. Each harmonic component has a frequency that is an integer multiple of the fundamental frequency (Fig. 2). Harmonics may be generated either by the power supply or by the load. In most cases, the harmonics produced by the load originate from the nonlinear characteristics of the equipment.
Fig. 2Harmonics generation in a non-linear system
4.2. Surface imaging
Tool wear assessment using surface imagery is carried out in two phases. In the first phase, the Stationary Wavelet Transform (SWT) is applied to the surface image of the workpiece, decomposing it into four sub-images: low-low, low-high, high-low, and high-high components (see Fig. 3) [42-44].
Fig. 3Stationary wavelet transforms structure [43]
![Stationary wavelet transforms structure [43]](https://static-01.extrica.com/articles/24728/24728-img4.jpg)
In the next stage, texture features derived from the Gray Level Co-occurrence Matrix (GLCM) are used to assess tool wear based on the selected sub-images. The results of the SWT decomposition are discussed later in this document. The spatial GLCM is a widely recognized and commonly used technique in texture analysis [45]. A GLCM represents image orientation by emphasizing spatial relationships between pixel intensities. Eq. (6) defines the Haralick entropy feature for texture analysis based on the GLCM. In this context, is the matrix element that represents the probability of the th gray level occurring to the right of the th gray level in the image. Entropy, as described in Eq. (6), measures the degree of disorder or randomness within an image (for more details, refer to [24, 46-49]):
4.3. Cutting force sensing
In this research, the Shannon entropy of the detail coefficient signals is calculated to determine tool wear based on dynamic cutting force, following the application of wavelet transform to the strain signal. Shannon entropy, defined by Eq. (7), measures the randomness or uncertainty present in the signal:
4.4. Tangential vibration sensing
The Root Mean Square (RMS) of the acceleration signals in the time domain ( and ) is calculated using Eq. (8):
Power Spectral Density (PSD) can be reliably used as an index of tool vibration by capturing the presence of random frequency components in the vibration spectrum measured by the accelerometer sensor. The PSD of a random signal across various frequencies is calculated using Eq. (9):
Eq. (10), where is Fourier transform of the of the original signal [24, 45, 46]:
In practice, instead of performing the complex computation described above, the Fast Fourier Transform (FFT) of the accelerometer’s signal is calculated, followed by the computation of the RMS of the dominant frequency components. Since the bandwidth of the mechanical vibrations is relatively low, the sampling rate of the accelerometer’s signal does not need to be very high.
5. K-mean clustering
In data-driven, K-means is an unsupervised method for clustering and classification data. To determine the similarity of the data, various measures and methods are used; one of which is the Euclidean distance, where current research has used it here, as well. The algorithm first determines the number of clusters to be considered. Then, the it selects the number of clusters we have specified by the existing data set and randomly selects a number as the center of each cluster. In the next step, other data are added to these clusters, and the average data of each cluster is considered as the center of that cluster. After selecting the new cluster centers, the data in the new clusters are regrouped. The K-means method assumes k-number clusters, and then follows the following process.
1. Initialize centroids. Choose initial centroids randomly from the dataset. These centroids can be chosen randomly and the K-means method for better initialization: .
1.1 Choose the first centroid.
Randomly select the first centroid from the dataset.
1.2 Compute distances.
For every point of data was not selected as a central, calculate the nearest, , central point has been chosen before.
1.3 Probability distribution.
Select the next centroid from the data points with a probability proportional to . Specifically, a point will be chosen with a probability of Eq. (11):
where is the set of all data points.
1.4 Redo.
Reiterate steps 2 and 3 until centroids have been selected.
1.5 Proceed with K-means algorithm.
Once centroids have been initialized, proceed with the standard K-means algorithm (assignment and update steps 1.1 to 1.4).
2. Assignment step. For each data point , find the closest centroid with Eq. (12):
where as data point is applied with assignment of cluster through .
3. Update step. Eq. (13) updates the centroid of each cluster :
where the is assigned as points with number in cluster .
4. Repeat.
The assignment and update procedures until the centroids exhibit negligible changes: for all , where is a small threshold value indicating convergence. After the initial training process and convergence of the algorithm, the real-time date whose attribute falls within the range of each cluster range belongs to that specific cluster (for more information in MATLAB).
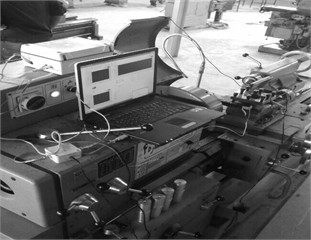
6. Experimental setup
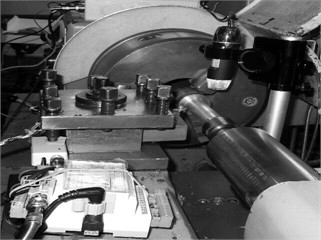
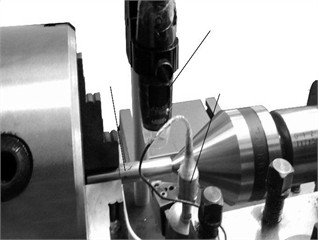
AISI 4340 steel bars with a diameter of 20 mm and a length of 120 mm were used in the present research. The tool holder, shown in Fig. 4(d), was equipped with sensors and an insert of Sandvik type B210 (see Fig. 4(f)). The workpiece was mounted between the chuck and the tailstock. The conditions and equipment used in the lab are presented in Table 1.
Fig. 4Monitor procedures: a) sensor fusion, b) data logger, c) tool holder, workpiece, accelerometer, digital microscope, d) data acquisition, e) electrical equipment, 80I-600 AC, f) Sandvik type B210
a)
b)
c)
d)

e)

f)
Table 1The experimental instruments and cutting conditions
Machining setup | Details | |
Machine and Tool | Lathe machine | TN50B |
Insert material | Coated Carbide | |
Workpiece | Material | Brass bars |
Diameter (mm) | 20 | |
Measurement and testing equipment | Accelerometer | Global Test AP98 |
Data acquisition system | Advantech 4704 | |
Microscope | Insizeb Digital Microscope | |
Surface roughness tester | MarSurf M 300 C | |
Machining conditions | Cut depth (mm) | 1 |
Spindle velocity (rev/min) | 1000 | |
Feed rate (mm/rev) | 0.2 | |
Overhang length (mm) | 40, 50, 60, 70, 80, 90, 100, 110 | |
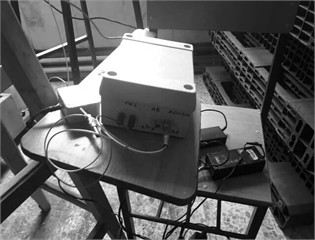
As shown in Fig. 4(c), a digital microscope was mounted on the lathe carriage using a specially designed platform to capture surface images of the workpiece during each pass. A Fluke 80I-600 AC transmitter (Fig. 4(d)) was used to acquire the motor current signal. An accelerometer (Fig. 4(c)) was affixed to the shank of the cutting tool to measure longitudinal vibrations, while a strain gauge was attached to the workpiece to detect mechanical strain. The active dummy method was employed to compensate for the effect of machining temperature on the strain measurement. The Wheatstone bridge, depicted in Fig. 5(b), utilized two types of sensors: strain gauges and dummy gauges made from identical materials. The active strain gauge was attached to the cutting tool, while the dummy strain gauge was unbound to the temporal setting, resistance ratio, and voltage output. The close positioning of the active and dummy gauges helps minimize thermally generated strain under balanced bridge conditions.
Fig. 5Graphical process of data sampling: a) workpiece, b) Wheatstone bridge, c) strain gauge, d) data logger, e) monitoring
7. Results and discussion
7.1. Method motivation and comparative advantages
The primary goal of the proposed multi-sensory fusion approach is to overcome the key limitations of existing single-sensor and single-modality diagnosis methods – namely their susceptibility to noise, signal uncertainty, and the need to halt machining for direct inspection. Traditional vision-only systems require machine stoppage and frequent tool withdrawal for microscopic or laser measurement, leading to production delays [1, 2]. Current-only or vibration-only methods, while non-intrusive, suffer from poor robustness when cutting conditions vary or when noise levels are high [5, 6]. By contrast, our method: Integrates four complementary sensing modalities (machine vision, motor current, accelerometer, strain gauge) to reduce false positives/negatives under varying process disturbances; Classifies tool flank wear into three discrete states (low, medium, high) in real time through unsupervised K-means clustering, avoiding the need for extensive labeled datasets required by neural networks or fuzzy inference systems; Achieves rapid convergence and low computational overhead, making it feasible for edge-computing implementation directly on CNC controllers; Scales effortlessly to additional sensors or wear states without redesigning the core algorithm. These advantages translate to a 95 % classification accuracy – an improvement of over 15 percentage points compared to typical single-sensor methods (< 80 %) – while enabling fully unattended, in-process monitoring (see Fig. 9 and Table 2).
7.2. Qualitative analysis via flank-wear photographs
To validate that each fusion-derived cluster corresponds to real flank-wear levels, we captured in situ images of the cutting insert flank after each pass. Fig. 6 shows three representative photographs with measured flank-wear values VB = 0.08 mm (low wear), VB = 0.18 mm (medium wear), and VB = 0.32 mm (high wear). Visual inspection confirms that:
– Low-wear cluster (0-0.1 mm) exhibits only minor discoloration and no pronounced crater or notch.
– Medium-wear cluster (0.1-0.2 mm) shows clear flank edge rounding and slight crater formation.
– High-wear cluster (> 0.2 mm) displays substantial crater depth and pronounced edge breakdown.
This qualitative correspondence demonstrates that the clustering boundaries align with human-interpretable wear features, bolstering confidence in the proposed recognition method. The reliability of tool wear monitoring has been questioned due to signal characteristics that are not directly dependent on tool wear, as well as the presence of variables and disturbances. One solution to this issue is sensor fusion, which integrates sensory inputs from diverse sources. This approach, combined with the emerging use of machine vision to assess the morphology of the wear zone, provides superior completeness, accuracy, reliability, and robustness compared to the individual use of each method. This research proposes a low-cost and reliable tool wear condition monitoring system that utilizes a combination of computer vision, motor current, strain, and vibration sensors. The system employs a Multiple Input Single Output (MISO) model with an Adaptive Neuro-Fuzzy Inference System (ANFIS) architecture. The study investigates a MISO system with four inputs and a single output. The inputs consist of the surface image entropy derived from wavelet transform, the frequency of the time-invariant motor current, Shannon entropy of mechanical strains, and vibration signals, with flank wear being the output. The findings indicate that the ANFIS model can accurately estimate tool flank wear. Fig. 6 illustrates the three-level Stationary Wavelet Transform (SWT) decomposition applied to the surface images, utilizing a low-pass filter on each row and column of the low-resolution primary image [44]. Similarly, the low-high sub-image was generated by applying low-pass filtering to each row and high-pass filtering to each column, with high-frequency details in the column direction influencing the low-high sub-image. The high-low sub-image was obtained by applying high-pass filtering to each row and low-pass filtering to each column, with high-frequency details in the row direction (feed marks) affecting the high-low sub-image. The high-high sub-image was generated using high-pass filtering applied to both rows and columns, with high-frequency details in the diagonal direction affecting the high-high sub-image.
Fig. 6Three-level SWT decomposition of surface image resulted from different tool wear levels

7.3. Reference values and production-ready implementation
In industrial practice, ISO 3685 (1993) recommends a maximum flank-wear VB_max ≈ 0.3 mm before tool change for coated carbide tools in steel turning. Our high-wear threshold (> 0.2 mm) was chosen to provide an early warning margin; tool replacement can be triggered when the cluster centroid approaches VB ≈ 0.25 mm, ensuring that VB_max is never exceeded in production.
To deploy this approach on the shop floor:
1) Sensor integration. Mount the accelerometer and strain gauge on the tool shank and workpiece respectively; integrate a current transducer on the spindle motor and a miniature vision module in a fixed position.
2) Edge-computing node. A compact industrial PC (e.g., Fanuc iHMI, Siemens IPC) streams all four signals over EtherCAT/Profinet to a real-time processing unit.
3) Real-time clustering. Feature extraction (entropy, RMS, FMI) and K-means assignment run in parallel at each spindle revolution (< 10 ms per cycle).
4) Tool-change logic. When two consecutive cycles assign the tool to the high-wear cluster, the controller issues a tool-change command and logs the flank-wear estimate to the MES.
This workflow requires no operator intervention during cutting and fits within typical CNC I/O and cycle-time budgets.
7.4. Discussion of reliability and limitations
By fusing four distinct modalities, the system achieves robustness against single-sensor disturbances (e.g., chatter spikes in vibration or lighting changes in vision). However, the multi-sensor setup increases hardware complexity and cost – mitigated in large-volume manufacturing by the savings from reduced unplanned downtime and optimized tool-use life. Future work will explore adaptive cluster-number determination (e.g., U-K-means) to capture more nuanced wear progression and investigate lower-cost sensor alternatives (e.g., MEMS accelerometers).
7.5. K-means modeling and simulation
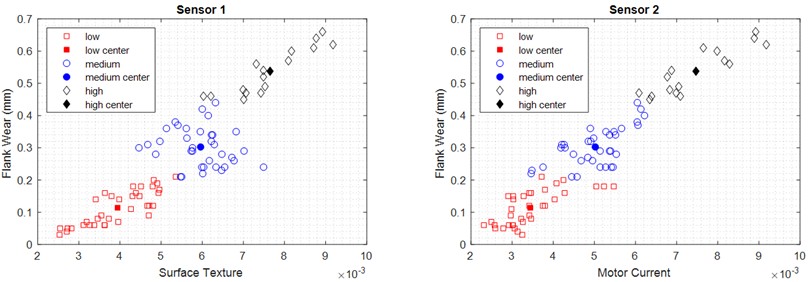
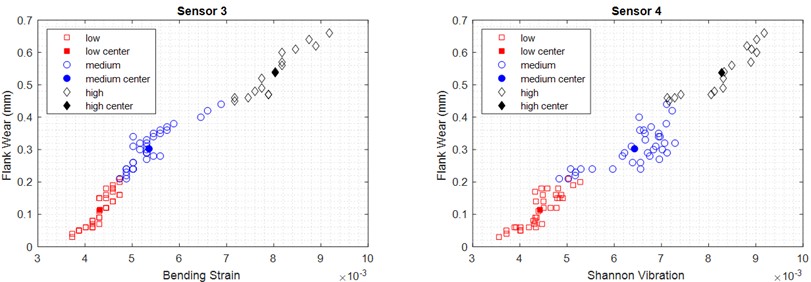
For this performance evaluation, the K-means clustering method was employed to classify the experimental dataset of sensor fusion for tool wear monitoring during the milling process, using MATLAB coding in an M-file. The first step involved normalizing the dataset, followed by the application of the K-means algorithm to classify the data into three groups based on expert knowledge of the workpiece surface roughness. As shown in Fig. 8(a), normalizing a dataset in signal processing is essential for enhancing algorithm performance, ensuring numerical stability, and achieving consistent feature scaling. It facilitates meaningful comparisons across datasets, reduces unnecessary repetition and irrelevant information, and adheres to statistical assumptions. Moreover, normalization aids in visualization and improves the training of machine learning models by preventing the occurrence of local minima, ensuring convergence toward a global optimum. Normalization is the process of scaling data to a similar range, ensuring that all features contribute equally to the analysis, which leads to more accurate and reliable results. This performance evaluation focuses on real-life, off-line tool wear status monitoring, aiming to present an intelligent function for assessing tool wear in different statuses within the manufacturer’s recommended intervals for the milling process. This intelligence function utilizes fuzzy logic based on expert knowledge of the milling process (Fig. 8). Fig. 7 illustrates the K-means clustering process applied to the sensor data. Initially, the dataset is imported into the K-means algorithm (Fig. 8(b)), followed by classification into three tool-wear status indices based on expert knowledge (High, Medium, Low). Each index group is then linked to surface roughness levels. Finally, the results show each sensor's cluster based on tool wear, as illustrated in Fig. 9.
Fig. 7Simulation process of tool wear by k-means algorithm
Fig. 8Clustering of sensors output, a) normalization, b) original
a)
b)
Fig. 9Clusters of sensors fusion within centers
8. Conclusions
This study presents a multi-sensory data fusion approach for tool wear monitoring in turning processes, achieving a classification accuracy of 95 % across three wear states – low (0-0.1 mm), medium (0.1-0.2 mm), and high (> 0.2 mm) – using K-means clustering on data from four sensors: machine vision, electrical current, accelerometer, and strain gauge. Unlike traditional single-sensor methods, which often achieve accuracies below 80 % due to noise and uncertainty, this method leverages complementary sensory inputs to enhance reliability and robustness, as validated through experimental results on AISI 4340 steel workpieces. The method’s uniqueness lies in its unsupervised K-means clustering approach, which fuses heterogeneous data sources to create clear wear state boundaries, enabling precise tool replacement decisions without requiring extensive labeled data or computational resources – common drawbacks of neural networks and fuzzy logic systems. Its rapid convergence and scalability further distinguish it from existing techniques, making it ideal for real-time applications. However, limitations exist: the assumption of three wear clusters may oversimplify complex wear progressions, and the multi-sensor setup increases initial costs, potentially hindering adoption in smaller facilities. Future work could explore adaptive clustering for nuanced wear patterns and cost-effective sensor alternatives. For production implementation, the method integrates seamlessly with CNC machines via edge computing for real-time processing, calibrated to industry-standard permissible flank wear of 0.3 mm, beyond which tools require replacement. This ensures minimal downtime and improved efficiency. Overall, this research offers a practical, data-driven solution that advances tool condition monitoring, with clear potential for enhancing manufacturing precision and productivity. For future investigations, various aspects of this study can be explored further. In the preprocessing stage, the use of LS-Dyna and ANSYS for static, dynamic, and modal analyses is strongly recommended to evaluate natural frequencies, crashworthiness, damage evolution, crack propagation, and heat transfer under operational conditions based on condition and health monitoring [50-54]. From a manufacturing design perspective, several practical techniques are available to optimize and redesign the fabrication process [55-57]. Theoretically, hybrid topology optimization combined with metaheuristic algorithms such as MOPSO, PSO, and MOGA offers potential for developing innovative models [58, 59]. Experimentally, implementing diverse strategies for optimal placement of PZTs on the brake surface can generate new signal patterns for effective data processing related to crack detection and high-temperature monitoring [60-63]. Moreover, the study of meta-cell structures in the brake system – capable of altering band gaps in natural frequencies – presents a promising research direction [64]. Lastly, in terms of control systems, employing various controllers such as PWM, PID, H∞, sliding mode, and fuzzy logic can enhance the precision of workpiece [65-69].
References
-
M. Danesh and K. Khalili, “Chatter detection in turning process using machine vision,” Modares Mechanical Engineering Journal, Vol. 13, pp. 94–104, 2013.
-
S. A. Singh, A. S. Kumar, P. C. Sorathiya, and K. A. Desai, “Vision-sensor fusion-based low-cost dimension measurement system for machining shop floor,” in 17th International Manufacturing Science and Engineering Conference, Jun. 2022, https://doi.org/10.1115/msec2022-85442
-
K. Wang, Z. Feng, J. Li, and R. Han, “A structural design and interaction algorithm of smart microscope embedded on virtual and real fusion technologies,” IEEE Access, Vol. 7, pp. 152088–152102, Jan. 2019, https://doi.org/10.1109/access.2019.2945330
-
L. Pagani, P. Parenti, S. Cataldo, P. J. Scott, and M. Annoni, “Indirect cutting tool wear classification using deep learning and chip colour analysis,” The International Journal of Advanced Manufacturing Technology, Vol. 111, No. 3-4, pp. 1099–1114, Oct. 2020, https://doi.org/10.1007/s00170-020-06055-6
-
K. Jemielniak, “Tool condition monitoring in metal cutting,” in Studies in Systems, Decision and Control, Cham: Springer International Publishing, 2018, pp. 45–74, https://doi.org/10.1007/978-3-030-03201-2_4
-
M. Danesh and S. Danesh, “Optimal design of adaptive neuro-fuzzy inference system using PSO and ant colony optimization for estimation of uncertain observed values,” Soft Computing, Vol. 28, No. 1, pp. 135–152, Oct. 2023, https://doi.org/10.1007/s00500-023-09194-6
-
S.-L. Chen and Y. W. Jen, “Data fusion neural network for tool condition monitoring in CNC milling machining,” International Journal of Machine Tools and Manufacture, Vol. 40, No. 3, pp. 381–400, Feb. 2000, https://doi.org/10.1016/s0890-6955(99)00066-8
-
A. Cavallo et al., “Experimental comparison of sensor fusion algorithms for attitude estimation,” IFAC Proceedings Volumes, Vol. 47, No. 3, pp. 7585–7591, Jan. 2014, https://doi.org/10.3182/20140824-6-za-1003.01173
-
I. Anagiannis, N. Nikolakis, and K. Alexopoulos, “Energy-based prognosis of the remaining useful life of the coating segments in hot rolling mill,” Applied Sciences, Vol. 10, No. 19, p. 6827, Sep. 2020, https://doi.org/10.3390/app10196827
-
N. Dhobale, S. Mulik, R. Jegadeeshwaran, and A. Patange, “Supervision of milling tool inserts using conventional and artificial intelligence approach: a review,” Sound and Vibration, Vol. 55, No. 2, pp. 87–116, Jan. 2021, https://doi.org/10.32604/sv.2021.014224
-
M. Kuntoğlu et al., “A review of indirect tool condition monitoring systems and decision-making methods in turning: critical analysis and trends,” Sensors, Vol. 21, No. 1, p. 108, Dec. 2020, https://doi.org/10.3390/s21010108
-
G. Zheng, W. Sun, H. Zhang, Y. Zhou, and C. Gao, “Tool wear condition monitoring in milling process based on data fusion enhanced long short-term memory network under different cutting conditions,” Eksploatacja i Niezawodność – Maintenance and Reliability, Vol. 23, No. 4, pp. 612–618, Dec. 2021, https://doi.org/10.17531/ein.2021.4.3
-
Y. Zhou and W. Sun, “Tool wear condition monitoring in milling process based on current sensors,” IEEE Access, Vol. 8, pp. 95491–95502, Jan. 2020, https://doi.org/10.1109/access.2020.2995586
-
S. Laddada, M. O. Si-Chaib, T. Benkedjouh, and R. Drai, “Tool wear condition monitoring based on wavelet transform and improved extreme learning machine,” Proceedings of the Institution of Mechanical Engineers, Part C: Journal of Mechanical Engineering Science, Vol. 234, No. 5, pp. 1057–1068, Nov. 2019, https://doi.org/10.1177/0954406219888544
-
Y. Dai and K. Zhu, “A machine vision system for micro-milling tool condition monitoring,” Precision Engineering, Vol. 52, pp. 183–191, Apr. 2018, https://doi.org/10.1016/j.precisioneng.2017.12.006
-
T. Benkedjouh, N. Zerhouni, and S. Rechak, “Tool wear condition monitoring based on continuous wavelet transform and blind source separation,” The International Journal of Advanced Manufacturing Technology, Vol. 97, No. 9-12, pp. 3311–3323, May 2018, https://doi.org/10.1007/s00170-018-2018-6
-
R. Liu, A. Kothuru, and S. Zhang, “Calibration-based tool condition monitoring for repetitive machining operations,” Journal of Manufacturing Systems, Vol. 54, pp. 285–293, Jan. 2020, https://doi.org/10.1016/j.jmsy.2020.01.005
-
F. Aghazadeh, A. Tahan, and M. Thomas, “Tool condition monitoring using spectral subtraction and convolutional neural networks in milling process,” The International Journal of Advanced Manufacturing Technology, Vol. 98, No. 9-12, pp. 3217–3227, Jul. 2018, https://doi.org/10.1007/s00170-018-2420-0
-
Z. Xie, J. Li, and Y. Lu, “Feature selection and a method to improve the performance of tool condition monitoring,” The International Journal of Advanced Manufacturing Technology, Vol. 100, No. 9-12, pp. 3197–3206, Oct. 2018, https://doi.org/10.1007/s00170-018-2926-5
-
P. Ong, W. K. Lee, and R. J. H. Lau, “Tool condition monitoring in CNC end milling using wavelet neural network based on machine vision,” The International Journal of Advanced Manufacturing Technology, Vol. 104, No. 1-4, pp. 1369–1379, Jun. 2019, https://doi.org/10.1007/s00170-019-04020-6
-
J. Guo, A. Li, and R. Zhang, “Tool condition monitoring in milling process using multifractal detrended fluctuation analysis and support vector machine,” The International Journal of Advanced Manufacturing Technology, Vol. 110, No. 5-6, pp. 1445–1456, Aug. 2020, https://doi.org/10.1007/s00170-020-05931-5
-
K. V. Rao, Y. P. Kumar, V. K. Singh, L. S. Raju, and J. Ranganayakulu, “Vibration-based tool condition monitoring in milling of Ti-6Al-4V using an optimization model of GM(1,N) and SVM,” The International Journal of Advanced Manufacturing Technology, pp. 1931–1941, May 2021, https://doi.org/10.1007/s00170-021-07280-3
-
Y. Zhou, B. Sun, W. Sun, and Z. Lei, “Tool wear condition monitoring based on a two-layer angle kernel extreme learning machine using sound sensor for milling process,” Journal of Intelligent Manufacturing, Vol. 33, No. 1, pp. 247–258, Sep. 2020, https://doi.org/10.1007/s10845-020-01663-1
-
M. Danesh, S. Danesh, and K. Khalili, “Multi-sensory data fusion system for tool condition monitoring using optimized artificial fuzzy inference system,” Aerospace Mechanics, Vol. 15, No. 56, pp. 103–118, 2020.
-
Q. Zhu, B. Sun, Y. Zhou, W. Sun, and J. Xiang, “Sample augmentation for intelligent milling tool wear condition monitoring using numerical simulation and generative adversarial network,” IEEE Transactions on Instrumentation and Measurement, Vol. 70, pp. 1–10, Jan. 2021, https://doi.org/10.1109/tim.2021.3077995
-
X. Li et al., “A data-driven approach for tool wear recognition and quantitative prediction based on radar map feature fusion,” Measurement, Vol. 185, p. 110072, Nov. 2021, https://doi.org/10.1016/j.measurement.2021.110072
-
T. Ogedengbe, R. Heinemann, and S. Hinduja, “Feasibility of tool condition monitoring on micro-milling using current signals,” Assumption University Journal of Technology, Vol. 14, No. 3, pp. 161–172, 2011.
-
J. Fan, W. Xie, and H. Du, “A robust multi-sensor data fusion clustering algorithm based on density peaks,” Sensors, Vol. 20, No. 1, p. 238, Dec. 2019, https://doi.org/10.3390/s20010238
-
N. A. Kasim, M. Z. Nuawi, J. A. Ghani, M. Rizal, N. A. Ngatiman, and C. H. C. Haron, “Enhancing clustering algorithm with initial centroids in tool wear region recognition,” International Journal of Precision Engineering and Manufacturing, Vol. 22, No. 5, pp. 843–863, Mar. 2021, https://doi.org/10.1007/s12541-020-00450-5
-
K. P. Sinaga and M.-S. Yang, “Unsupervised K-means clustering algorithm,” IEEE Access, Vol. 8, pp. 80716–80727, Jan. 2020, https://doi.org/10.1109/access.2020.2988796
-
S. Wang et al., “Efficient multiple kernel k-means clustering with late fusion,” IEEE Access, Vol. 7, pp. 61109–61120, Jan. 2019, https://doi.org/10.1109/access.2019.2904887
-
C. Liu, Y. Li, J. Hua, N. Lu, and W. Mou, “Real-time cutting tool state recognition approach based on machining features in NC machining process of complex structural parts,” The International Journal of Advanced Manufacturing Technology, Vol. 97, No. 1-4, pp. 229–241, Mar. 2018, https://doi.org/10.1007/s00170-018-1916-y
-
B. Liu, C. Liu, Y. Zhou, D. Wang, and Y. Dun, “An unsupervised chatter detection method based on AE and merging GMM and K-means,” Mechanical Systems and Signal Processing, Vol. 186, p. 109861, Mar. 2023, https://doi.org/10.1016/j.ymssp.2022.109861
-
A. M. Ikotun, A. E. Ezugwu, L. Abualigah, B. Abuhaija, and J. Heming, “K-means clustering algorithms: A comprehensive review, variants analysis, and advances in the era of big data,” Information Sciences, Vol. 622, pp. 178–210, Apr. 2023, https://doi.org/10.1016/j.ins.2022.11.139
-
S. M. Miraftabzadeh, C. G. Colombo, M. Longo, and F. Foiadelli, “K-Means and alternative clustering methods in modern power systems,” IEEE Access, Vol. 11, pp. 119596–119633, Jan. 2023, https://doi.org/10.1109/access.2023.3327640
-
W. Wu, W. Wang, X. Jia, and X. Feng, “Transformer autoencoder for K-means efficient clustering,” Engineering Applications of Artificial Intelligence, Vol. 133, p. 108612, Jul. 2024, https://doi.org/10.1016/j.engappai.2024.108612
-
X. Li, “Development of current sensor for cutting force measurement in turning,” IEEE Transactions on Instrumentation and Measurement, Vol. 54, No. 1, pp. 289–296, Feb. 2005, https://doi.org/10.1109/tim.2004.840225
-
A. Akbari, M. Danesh, and K. Khalili, “A method based on spindle motor current harmonic distortion measurements for tool wear monitoring,” Journal of the Brazilian Society of Mechanical Sciences and Engineering, Vol. 39, No. 12, pp. 5049–5055, Mar. 2017, https://doi.org/10.1007/s40430-017-0762-4
-
M. Chugani, A. Samant, and M. Cerna, LabVIEW signal processing. Pearson Education, 1998.
-
“Total harmonic distortion and effects in electrical power systems,” https://www.scribd.com/document/517550772/total-harmonic-distortion-and-effects-in-electrical-power-systems (accessed Apr. 2025).
-
M. Danesh and K. Khalili, “Tool wear condition monitoring using time-frequency marginal integral of motor current signal,” Modares Mechanical Engineering, Vol. 14, No. 16, pp. 181–189, 2015.
-
L. A. Franco-Gasca, G. Herrera-Ruiz, R. Peniche-Vera, R. J. Romero-Troncoso, and W. Leal-Tafolla, “Sensorless tool failure monitoring system for drilling machines,” International Journal of Machine Tools and Manufacture, Vol. 46, No. 3-4, pp. 381–386, Mar. 2006, https://doi.org/10.1016/j.ijmachtools.2005.05.012
-
M. Danesh and K. Khalili, “Determination of tool wear in turning process using undecimated wavelet transform and textural features,” Procedia Technology, Vol. 19, pp. 98–105, Jan. 2015, https://doi.org/10.1016/j.protcy.2015.02.015
-
Y.-Y. Shih, J.-C. Chen, and R.-S. Liu, “Development of wavelet de-noising technique for PET images,” Computerized Medical Imaging and Graphics, Vol. 29, No. 4, pp. 297–304, Jun. 2005, https://doi.org/10.1016/j.compmedimag.2004.12.002
-
K. Khalili and M. Danesh, “Identification of vibration level in metal cutting using undecimated wavelet transform and gray-level co-occurrence matrix texture features,” Proceedings of the Institution of Mechanical Engineers, Part B: Journal of Engineering Manufacture, Vol. 229, No. 2, pp. 205–213, Apr. 2014, https://doi.org/10.1177/0954405414526577
-
M. Nouri, B. K. Fussell, B. L. Ziniti, and E. Linder, “Real-time tool wear monitoring in milling using a cutting condition independent method,” International Journal of Machine Tools and Manufacture, Vol. 89, pp. 1–13, Feb. 2015, https://doi.org/10.1016/j.ijmachtools.2014.10.011
-
R. M. Howard, Principles of Random Signal Analysis and Low Noise Design. Wiley, 2002, https://doi.org/10.1002/0471439207
-
S. Tsai, K. Eman, and S. Wu, “Chatter suppression in turning,” Manufacturing Engineering Transactions, Vol. 11, pp. 399–402, 1983.
-
D. E. Dimla, “Sensor signals for tool-wear monitoring in metal cutting operations-a review of methods,” International Journal of Machine Tools and Manufacture, Vol. 40, No. 8, pp. 1073–1098, Jun. 2000, https://doi.org/10.1016/s0890-6955(99)00122-4
-
M. Hasanlu, “Clearance prediction of rotary system with and without mechanical diagnosis by using artificial neural networks and particle swarm optimization,” Journal of Mechanical Engineering and Vibration, Vol. 11, No. 2, pp. 7–11, 2020.
-
M. Hasanlu, M. Rostami, A. Abazarian, M. Soltanshah, and M. Zamanian, “Modeling of dynamic axial crushing of thin walled structures by LS-DYNA and genetic programming,” in 3rd International Conference on Researches in Science and Engineering, Jan. 2017, https://doi.org/10.13140/rg.2.2.31743.73125
-
M. Rostami, M. Hasanlou, and M. Siavashi, “Modeling and comparison of mechanical behavior of foam filled and hollow aluminum tubes by LS-DYNA and introducing a neural network model,” J Journal of Simulation and Analysis of Novel Technologies in Mechanical Engineering, Vol. 8, No. 4, pp. 275–293, 2015.
-
M. Hasanlu, S. Mirhosseini, and M. Sadeghzadeh, “Modal analysis turboshaft test stand motor designed by using ANSYS,” Journal of Simulation and Analysis of Novel Technologies in Mechanical Engineering, Vol. 10, No. 1, pp. 781–796, 2020.
-
M. Hasanlu, “Experimental condition monitoring of unbalanced rotary shaft based on ANFIS by using piezoelectric sensor,” Journal of Mechanical Engineering and Vibration, Vol. 11, No. 1, pp. 66–75, 2020.
-
M. Hasanlu, “Numerical and experimental investigation on the formability of sheet metal coated by hot dip galvanizing using TPIF method,” Journal of Mechanical Engineering and Vibration, Vol. 11, No. 1, pp. 27–34, 2020.
-
M. Hasanlu and S. Mokari, “Review of the parameters influence of incremental forming between,” Journal of Mechanical Engineering and Vibration, Vol. 10, pp. 32–45, Jan. 1960, https://doi.org/10.13140/rg.2.2.22689.11368
-
M. Hasanlu and S. Mokari, Practical Survey in Single – and Two-Points incremental Metal Forming. 2025.
-
M. Hasanlu, M. Siavashi, M. Soltanshah, and A. Bagheri, “Fuzzy-PID controller design for random vibration attenuated smart cantilever Timoshenko beam based on MOGA algorithm,” in 4th National and 2nd International Conference on Applied Research in Electrical, Mechanical and Mechatronics Engineering, Jan. 2024, https://doi.org/10.13140/rg.2.2.18730.73926
-
M. Hasanlu, M. Siavashi, and A. Bagheri, “Vibration attenuation Timoshenko beam based on optimal placement sensors/actuators PZT patches with LQR-MOPSO,” Iranian Journal of Mechanical Engineering, Vol. 17, pp. 25–59, 2016.
-
M. Hasanlu, “Optimal placement of piezoelectric S/A for active vibration control of engineering structures by using controller design,” Research and Reviews: Journal of Engineering and Technology, pp. 22–44, Jan. 2020, https://doi.org/10.13140/rg.2.2.26710.56649
-
M. Hasanlu and A. Bagheri, “Optimal locations on Timoshenko beam with PZT S/A for suppressing 2Dof vibration based on LQR-MOPSO,” Journal of Solid Mechanics, Vol. 10, No. 2, pp. 364–386, 2018, https://doi.org/20.1001.1.20083505.2018.10.2.11.5
-
M. Hasanlu and A. Bagheri, “Intelligent control smart Timoshenko beam by using MOPSO-PID controller based on optimal location PZT patch actuator approach,” System Dynamics and Solid Mechanics, Vol. 20, No. 3, pp. 6–28, 1397, https://doi.org/20.1001.1.25384775.1397.20.3.1.3
-
M. Hasanlu, M. Siavashi, and A. Bagheri, “Free vibration analysis of metamaterial functionally graded plates with quasi-zero stiffness resonators,” Noise and Vibration Worldwide, Vol. 54, No. 2-3, pp. 108–121, Jan. 2023, https://doi.org/10.1177/09574565231154248
-
M. Karami Gavgani, M. Hasanlu, and M. Nikkho, “Optimal position control of nonlinear muscle based on sliding mode and particle swarm optimization algorithm,” Transactions on Machine Intelligence, Vol. 5, pp. 37–45, Dec. 2022, https://doi.org/10.47176/tmi.2022.37
-
M. Hasanlu and M. Siavashi, “Nonlinear control of quadrotor trajectory with discrete H∞,” Journal of Mechanical Engineering, Automation and Control Systems, Vol. 6, No. 1, pp. 1–12, Jan. 2025, https://doi.org/10.21595/jmeacs.2024.24602
-
M. Siavashi and M. Hasanlu, “Experimental optimal control of servo-pneumatic with sliding mode and GA-fuzzy-PID-PWM,” Journal of Mechatronics and Artificial Intelligence in Engineering, Vol. 5, No. 2, pp. 199–214, Dec. 2024, https://doi.org/10.21595/jmai.2024.24656
-
M. Hasanlu, M. Sharif-Nejad, and G. R. Zarepour, “Aeroservoelastic cantilever beam by using negative velocity feedback control algorithm,” in ISME, Jan. 2020, https://doi.org/10.13140/rg.2.2.12449.93284
About this article

The authors have not disclosed any funding.
The datasets generated during and/or analyzed during the current study are available from the corresponding author on reasonable request.
The authors declare that they have no conflict of interest.
