Abstract
The aerofoils which allow for the flow at a broader range of angles have a more significant impact on the power generation from the turbine. The conception and examination for the aerofoil geometry have been executed in the current work to evaluate the behaviour of the flow in terms of the velocity and pressure lineation. The work is intended to focus on analysing the flow behaviour along the surface of the aerofoil geometry. The aerofoil geometries are opted to be of new aerofoil type of NACA 8412 series. The aerofoil geometry was analysed for a constant angle of attack along the total length. This evaluation was done for the angle of attack ranging from 0° to 20° with 5° interval for each model. The inlet velocity for the flow along the surface of the aerofoil geometry was taken varied from 7.5 m/s to 10 m/s with 0.5 m/s interval for each model. The plot points for the geometries are generated using the Auto CAD for different angles. The further simulations and evaluations were executed using the Ansys Fluent software. On evaluating and considering the variable conditions, the optimum values are obtained for the aerofoil at 15° angle of inclination at an inlet velocity of 9 m/s. The software generated results when compared to the regression data generated ascertained to be in a good correlation with each other.
1. Introduction
A steam turbine is an extended form of a heat engine which drives most of its performance from the thermodynamic efficiency from different stages of steam generation. The steam turbine blades are aerofoils which are light in weight, durable in nature, provide a better performance, efficient in working, and many other factors can be counted on [10]. The aerofoils move through the fluid and generate an aerodynamic force which provides a characteristic shape to work with more efficiency. The CFD analysis has provided the viability of simulating for the required contours regarding the flow behaviour. The CFD study over the aerofoils has been exaggerated rapidly with vast development. Naga babu et al. [1] carried out a CFD study for analysing the efficiency of the utility steam turbine, which involves the behaviour of the flow path in various components of the turbine. The overall efficiency of the turbine was increased by modifying the selected aerofoil properties. Sivakumar et al. [2] carried out a CFD study for analysing the efficiency of the utility steam turbine. The turbine geometries are analyzed for the parameters like temperature, pressure and power output. The obtained results have helped in predicting the turbine performance. Ali Raza Abid et al. [3] analyzed the turbine blades prepared from GE with twisted geometry along its length and applied with reverse engineering techniques. The blades were analyzed in under the wind tunnel conditions at lower velocities to reduce the vibrational and blade stall effects. On comparing the results, on comparing the results, variations have been identified as the ideal conditions cannot be maintained when it’s done experimentally. Sivakumar et al. [4] carried out the CFD study of turbine blades. In this, the study was conducted on a typical intermediate pressure cylinder. On evaluation and comparison among the CFD results and 2D experimental values, it is brief that the flow and performance of the equipment affect the velocity pressure and temperature lineation. The coefficient of lift/drag increases up to some extent of the angle of attack and after decreases. The coefficient of lift and coefficient of drag are the parameters that describe the performance of an aerofoil [5-7]. According to Bernoulli's principle, the pressure experienced by the lower surface is higher than the upper surface; then it can cause lift effectively [8-9]. Juliana et al. [10] worked on the performance of the wind turbine using a 2D model of NACA 4420 aerofoil with modifications in an angle of attack from 3° to 10° at the inlet of the geometry. They found the best results at an angle of 4o with maximum / ratio, which ultimately contributed to the performance of the turbine.
The conception of the blade in the turbine is considered to be the critical module in terms of the performance. The velocity when increased develops a force along the surface, which modulates the flow behaviour and depicts a more significant impact over the aerofoil geometry. Due to this, the pressure lineation gets reduced and contributes to increasing the performance of the aerofoil ultimately. The primary grail of the work is to fractionate the discernment of the flow along the surfaces of an aerofoil and also to evaluate the velocity and pressure lineation concerning the design of the geometry.
2. Detailed procedure
The aerofoil geometries are of various series depending upon the height of the upper chamber and lower chamber. Based on the respective conditions, the aerofoil geometries are considered in three series, i.e. 6412, 7412, 8412, with a total number of 81 plot points [11, 12]. The aerofoil have been a reliable source for an airstream inside the geometry to develop the aerodynamic force [8]. The change in the angle of attack at the inlet of the aerofoil geometry will take a considerable effect on the potential of the turbine [10]. The change in the angle of attack or the angle of inclination is to increase the lift to drag ratio, which ultimately affects the efficiency of the aerofoil attached and also contribute to the potential of the turbine [10]. On comparing the three aerofoil series in terms of the chord length, the curvature of the aerofoil, thickness in terms of the upper chamber and lower chamber, smoothness of the leading edge for the flow [20, 21]; the aerofoil geometry with 8412 series was considered to be the best one and was proceeded with further conceptions and examinations.
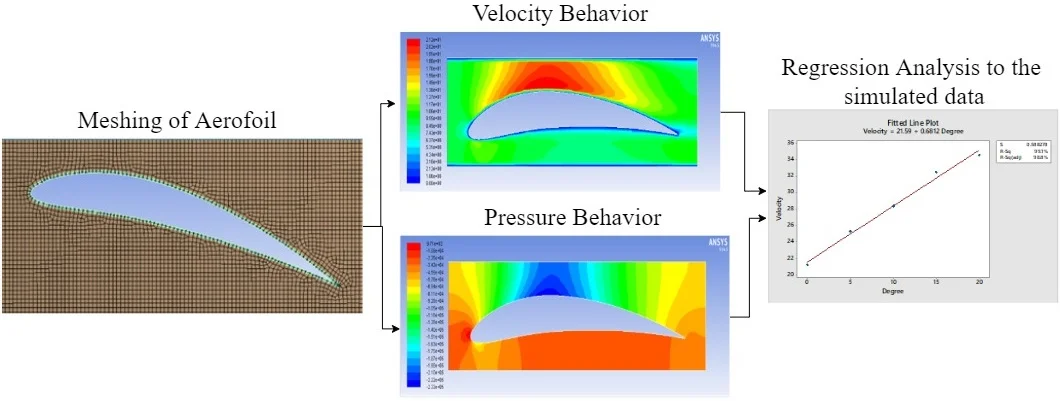
The geometries are developed from the plot points generated using Auto CAD software. These plotted geometries are imported to ANSYS Fluent software to analyze for the velocity lineation and pressure lineation. The considered geometries are pertained with the energy equation, – epsilon equation with different inlet velocities to solve for the required conditions. The geometries concerning the 8412 series are placed at various inclination angles namely 0°, 5°, 10°, 15°, 20°. The inlet velocity has been kept constant at 9 m/s for all the models. These different geometries are named as mentioned in the Table 1 so as for the convenience in the successive discussions.
Table 1Discrete models considered
Model No. | Description |
M1 | Aerofoil with 0° inclination |
M2 | Aerofoil with 5° inclination |
M3 | Aerofoil with 10° inclination |
M4 | Aerofoil with 15° inclination |
M5 | Aerofoil with 20° inclination |
The considered geometries are conceptualized and examined in a predefined manner as mentioned.
The geometries are applied with principles such as the continuity principle, Bernoulli’s principle and equations such as energy equation, kappa – epsilon equation. The calculation and evaluation are termed as follows.
2.1. Continuity equation
The constitute of the fluid entering the intended profile must be same as the constitute of the fluid leaving the profile:
Fig. 1Reference plot of the 8412 – aerofoil
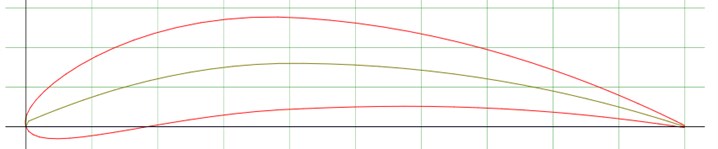
Fig. 2Conditions applied for the generation of the aerofoil
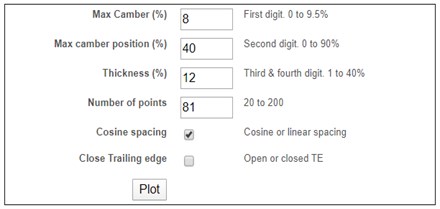
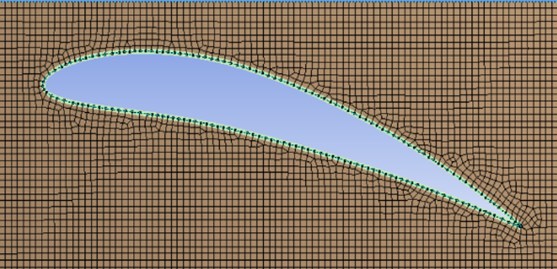
Fig. 3Mesh for the geometry of model – M4
2.2. Momentum equation
The rate at which the momentum of a fluid particle changes, must be equal to the forces acting along the flow stream mass × acceleration.
Now, consider a functional sample from the depicted fluid flow.
Let, – cross sectional area of considered functional fluid sample, – length of the functional fluid element, – weight of the functional fluid element, – velocity of the functional fluid element, – pressure of the functional fluid element.
Assume that the fluid is steady, non-viscous, and incompressible so that the frictional losses are zero and the density of the fluid is constant.
The different forces acting on the fluid are:
a) Pressure force acting in the direction of the flow ().
b) pressure force acting in the opposite direction of the flow [].
c) gravity force acting in the opposite direction of the force ().
Therefore, total force = gravity force + pressure force.
The pressure force is considered in the direction of low:
The gravity force considered in the direction of flow:
The net force is considered in the direction of flow:
We have:
2.3. Euler’s equation of motion
On integrating the Euler’s equation, we get the Bernoulli’s equation:
2.4. Bernoulli’s equation
Kappa – epsilon model: the -epsilon model of the energy equation is generally used to analyse the turbulent flow. The final equations for the turbulent flow analysis are:
3. Results and discussion
The principal aim of the proposed work is to investigate the flow behaviour on aerofoil-based turbine blade for different velocities and angle of attacks. The design of the aerofoil, along with the behaviour of the flow over the surface depicts a tremendous impact over the performance of the turbine. The sensitivity of the flow along the surface of the geometry and the better performance of the turbine using the aerofoil geometry as the turbine blades is to be analysed, using the CFD with modifications in terms of the angle of attack [10]. The geometries are appertained with energy equation and kappa – epsilon equation and then provided with the inlet velocity and temperatures. After providing the geometries with necessary boundary conditions, they are evaluated accordingly also studied the accuracy of the simulated values using regression analysis.
3.1. Flow behaviour over aerofoil
It is observed that the generated simulated values are increased by increasing the attack angles, and the velocity parameter also increases concerning the inlet velocities as represented in Table 2 and as shown in Fig. 4. It is clear that as inlet velocities increase the Maximum velocity also increases up to 150 angles of attack, later for 200 it drops. This pattern is noticed at velocity 10 m/s at 200 angles of attack, as shown in Table 2 and Fig. 4.
Fig. 4Velocity variations for different angles of attack
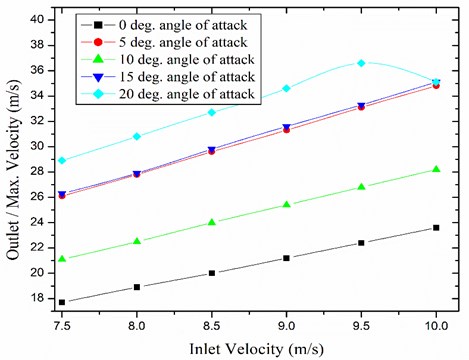
Table 2Outlet/maximum velocities in terms of angle of attack
Angle of attack | Inlet velocity (m/s) | Velocities (m/s) | |||||
7.5 | 8 | 8.5 | 9 | 9.5 | 10 | ||
0° | Min. outlet velocity (m/s) | 0 | 0 | 0 | 0 | 0 | 0 |
Maximum outlet velocity (m/s) | 17.7 | 18.9 | 20.0 | 21.2 | 22.4 | 23.6 | |
5° | Min. outlet velocity (m/s) | 0 | 0 | 0 | 0 | 0 | 0 |
Maximum outlet velocity (m/s) | 26.1 | 27.8 | 29.6 | 31.3 | 33.1 | 34.8 | |
10° | Min. outlet velocity (m/s) | 0 | 0 | 0 | 0 | 0 | 0 |
Maximum outlet velocity (m/s) | 21.1 | 22.5 | 24.0 | 25.4 | 26.8 | 28.2 | |
15° | Min. outlet velocity (m/s) | 0 | 0 | 0 | 0 | 0 | 0 |
Maximum outlet velocity (m/s) | 26.3 | 27.9 | 29.8 | 31.6 | 33.3 | 35.1 | |
20° | Min. outlet velocity (m/s) | 0 | 0 | 0 | 0 | 0 | 0 |
Maximum outlet velocity (m/s) | 28.9 | 30.8 | 32.7 | 34.6 | 36.6 | 35.1 | |
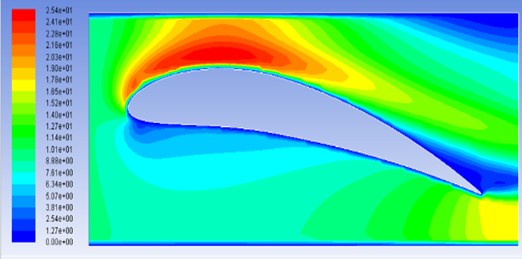
Based on the above observations, the study is carried out for inlet velocity 9 m/s and the angle of attack for 150. Fig. 5-9 represents the velocity contours and Fig. 10-14 represents pressure contours. The more negative pressure is developed in the first region of the aerofoil. As the angle of attack increased, the negative pressure is moved towards the starting point of the aerofoil. Since the pressure and the velocity are inversely proportional to each other. The velocity is more at the top region and goes on shifting towards the starting of an aerofoil, as shown in Fig. 5-9. But for the modal M5, the zero-velocity flow is developed on the back region of the aerofoil, which was affected by the next blade, as shown in Fig. 9. Hence there is a drop in velocity parameter at 10 m/s for 200 angles of attack.
From Fig. 5-9 and table 2, we can observe the changes in the velocity parameters accordingly for each model. From the model M1 to M2, it is observing an improvement of 32.3 %. Similarly, for model M3 to M4, it is observed a rise of 19.85 %, and for model M4 to M5 it is 8.8 % increase in terms of the velocity parameters.
Fig. 5Velocity contours for the model M1
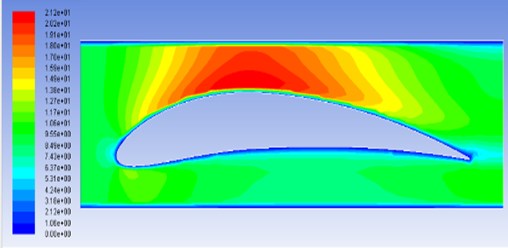
Fig. 6Velocity contours for the model M2
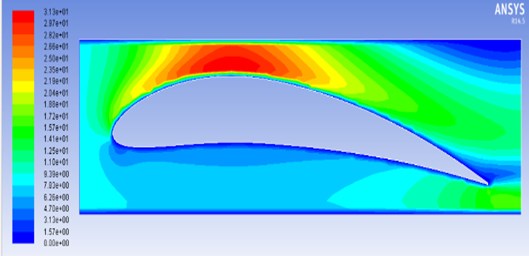
Fig. 7Velocity contours for model M3
Based on the Bernoulli’s principle, the top region of the aerofoil is exposed to low pressure (negative value) and the bottom region is having the higher pressure (positive value) as shown in Figs. 10-14. Similarly, the more velocity is observed in the top region of aerofoil and bottom region with low velocity. Hence it leads to pushing the blade in the upward direction usually to the inlet flow, which affects the performance of the turbine.
Fig. 8Velocity contours for model M4
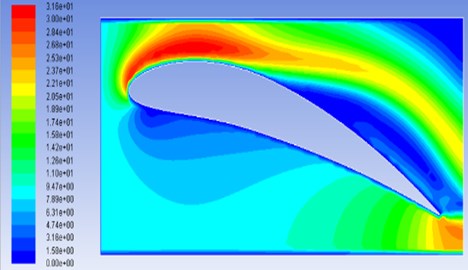
Fig. 9Velocity contours for the model M5
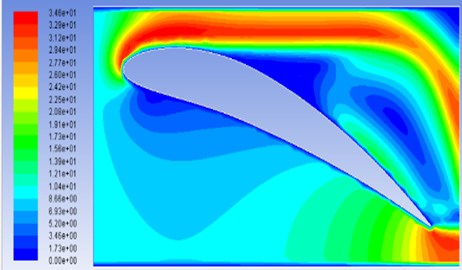
Fig. 10Pressure contours for the model M1
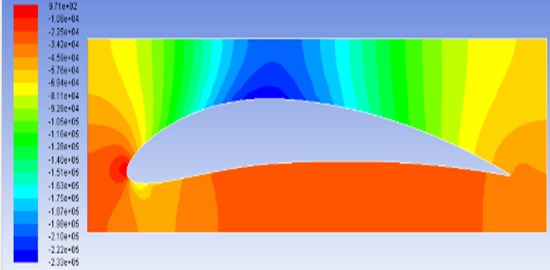
Fig. 11Pressure contours for the model M2
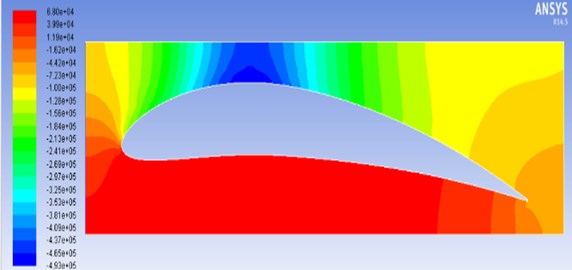
Fig. 12Pressure contours for model M3
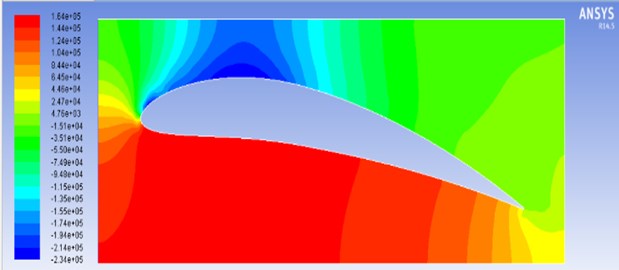
Fig. 13Pressure contours for model M4
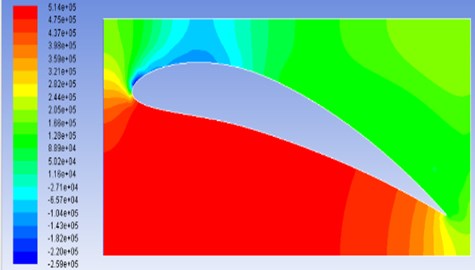
Fig. 14Pressure contours for the model M5
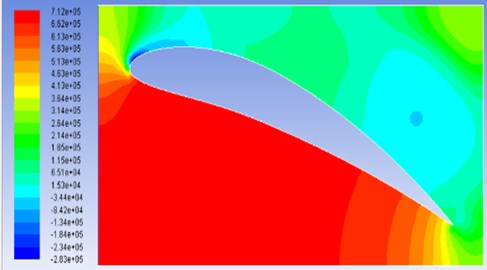
Table 3Minimum/maximum pressure in terms of angle of attack
Angle of attack | Inlet Vel. (m/s) | Pressure (pascal) | |||||
7.5 | 8 | 8.5 | 9 | 9.5 | 10 | ||
0° | Min. Pressure | –161851.1 | –184272.5 | –208145.9 | –233489.3 | –260294.1 | –288554.8 |
Max. Pressure | 718.1 | 798.9 | 884.1 | 971.3 | 1061.7 | 1155.8 | |
5° | Min. Pressure | –342134.7 | –389388.2 | –439716.6 | –493082.7 | –549520.5 | –609020.8 |
Max. Pressure | 46816.6 | 53429.2 | 60487.7 | 67986.2 | 75926.0 | 84320.6 | |
10° | Min. Pressure | –162637.9 | –185025.0 | –208857.3 | –234135.1 | –260848.3 | –289000.7 |
Max. Pressure | 113565.0 | 129346.8 | 146168.1 | 164021.3 | 182912.2 | 202844.3 | |
15° | Min. Pressure | –179797.7 | –204593.0 | –230986.9 | –258996.4 | –288601.2 | –319808.8 |
Max. Pressure | 356690.2 | 405963.1 | 458404.5 | 514108.4 | 572970.2 | 635032.9 | |
20° | Min. Pressure | –196871.3 | –223903.3 | –252725.1 | –283270.2 | –315565.3 | –337515.4 |
Max. Pressure | 495084.7 | 563149.9 | 635306.8 | 712057.0 | 793136.9 | 871364.8 | |
The minimum and maximum pressure contour concerning the inlet velocity for a different angle of attack are shown in Table 3. As the inclination angle at the inlet of the geometry is increased, it leads to varying in the velocity and pressure in several means of the fluid which allowed through the geometry. From the simulated data, it is clear that the model M4 has higher rates of velocity and pressure contours when compared to the other models by 14.86 % in terms of velocity and 12.28 % in terms of the pressure. The maximum outlet velocity obtained with higher amount of difference was for the model M4, and the value was 31.5669 m/s and the pressure developed was also for the model M4, and the value was 514108.4002 Pa.
3.2. Regression analysis
To find the error for the simulated data, regression analysis is done. Base on the R2 and adj R2 value, the error can be defined as shown in Fig. 15. The experimental values close to 1, i.e. is 0.98, which indicates that the regression date is in good agreement with simulated data, as shown in table 4. The simulated values are compared to the regression values, as shown in Table 4 [13, 16]. The equation is developed based on the angle of attack and inlet velocity of the aerofoil: Final Equation for the regression Velocity = 21.59 + 0.6812 Degree.
Fig. 15Graphical plot of the angle of inclination and the outlet velocities
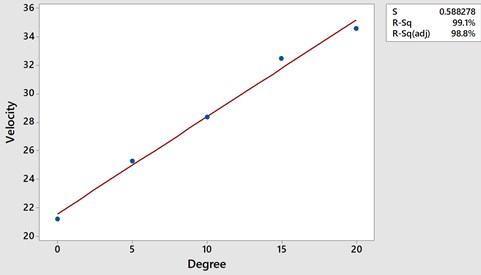
A conventional method is used to obtain the accuracy the optimum statistical methods such as the regression analysis. The regression describes the intended relationship between the dependent variable and the independent variable or other remaining variables. The simulated data is referred for generating the equation for finding the final velocities and temperature contours for the considered models with different angles of inclination. An error if any, can be identified by replacing the simulated values in the below equation. On comparing the generated data from the simulation to the regression data generated from the data given, the accurate final velocity and temperature co-efficient can be defined [13-18].
Table 4Comparison plot between the simulated data and the regression data
Regression values | ||
Degree | Software data | Regression data |
0 | 21.2218 | 21.2218 |
5 | 25.28092 | 31.31092 |
10 | 28.37354 | 25.37354 |
15 | 32.5069 | 31.5669 |
20 | 34.63762 | 34.63762 |
4. Conclusions
The work aims to analyse the flow behaviour along the surface of the aerofoil in terms of velocity and pressure lineation. And also, to find the optimum angle of inclination for the better performance of the turbine with considerable lineation. The aerofoil geometry with an angle of 15° inclination has been depicted as the best one with maximum deviation in the respective lineation. The aerofoil geometry, when placed at this particular angle of inclination and with a peculiar inlet velocity, leads to an increase in the efficiency and performance of the turbine. The generated results when compared to the regression analysis found to correlate in good agreement with each other.
References
-
Nagababu B., Nagi Reddy V. S. Design and analysis on coated steam turbine blade. 2nd International Conference on Recent Developments in Science, Humanities and Management, 2018, p. 391-411.
-
Sivakumar Pennaturu, Prasad Issac P. Evaluating performance of steam turbine using CFD. International Journal of Latest Trends in Engineering and Technology, Vol. 4, Issue 2, 2014, p. 209-304.
-
Ali Raza Abid M., Irfan Sarwar M., Ahmad Tahir, Anwar Khan M., Sayyid Masood Shah, Shehryar M. Gas turbine blade flow analysis comparison using CFD and wind tunnel. 9th International Bhurban Conference on Applied Science and Technology, 2012.
-
Zhu Mingyu Design and analysis of steam turbine blades. 3rd International Conference on Fluid Mechanics and Industrial Applications, 2019.
-
Mayurkumar Kevadiya, Hemish Vaidya A 2D analysis of NACA 4412 airfoil. International Journal of Innovative Research in Science, Engineering and Technology, Vol. 2, Issue 5, 2013, p. 1686-1691.
-
Garica Luis F., Jaramillo Julian E., Chacon Jorge L. Aerodynamic analysis of aerofoil of a VAWT by using 2D CFD model. The Mining and Energy Planning Unit of Colombia, Vol. 5, 2012.
-
Yin Yin Htay Aung, Myat Myat Soe, Aung Myat Thu Effect of attack angle on aerodynamics analysis of different wind turbine wings using numerical simulation. American Scientific Research Journal for Engineering Technology and Sciences, Vol. 26, Issue 4, 2016, p. 319-389.
-
Mohamed Fouad Kandil A., Abdelardy Okasha Elnady Performance of GOE – 387 airfoil using CFD. International Journal of Aerospace Sciences, Vol. 5, Issue 1, 2017, p. 1-7.
-
Kandwal S., Singh S. Computational fluid dynamics study of fluid flow and aerodynamic forces on a airfoil. International Journal of Engineering and Technology, Vol. 1, Issue 7, 2012, p. 1-8.
-
Jebarose Juliayana S., Udaya Prakash J., Karthik K., Pallavi P., Saleem M. Design and analysis of NACA 4420 wind turbine aerofoil using CFD. International Journal of Mechanical Engineering and Technology, Vol. 8, Issue 6, 2017, p. 403-410.
-
Zubin Zaheer, Reby Roy K. E., Gopakumar Nair S., Vineeth Ragipathi, Niranjan U. V. CFD analysis of the performance of different airfoils in ground effect. International Conference on Aerospace and Mechanical Engineering, 2019.
-
Adil Loya, Muhammad Zia Ullah Khan, Rumeel Ahmad Bhutta, Muhammed Saeed Dependency of torque on aerofoil camber variation in vertical axis wind turbine. Scientific Research Publishing, Vol. 6, 2016, p. 472-486.
-
Satish G., Prasad S. S., Prasad V. V. S. Experimental studies on mechanical properties of polymer based composites. Journal on Mechanical Engineering, Vol. 8, Issue 4, 2018, p. 1-7.
-
Satish G., Prasad V. V. S., Ramji K. Manufacturing and characterization of CNT based polymer composites. Mathematical Models in Engineering, Vol. 3, Issue 2, 2017, p. 89-97.
-
Satish G., Prasad V. V. S., Ramji K. Effect on mechanical properties of carbon nanotube based hybrid composites. Materials Today: Proceedings, Vol. 5, Issue 2, 2018, p. 7725-7734.
-
Aditya Kolakoti, Bhanuprakash T. V. K., Das H. N. CFD analysis of controllable pitch propeller used in marine vehicle. Global Journal of Engineering Design and Technology, Vol. 2, Issue 5, 2013, p. 25-33.
-
Akhil Yuvaraj Manda, Satish Geeri Flow behaviour on elbow with various geometries of nozzle. Journal of Mechanical Engineering, Vol. 9, Issue 2, 2019, p. 43-51.
-
Akhil Yuvaraj Manda, Satish Geeri Comparative study on various pipe geometries using CFD. Materials Today: Proceedings, Vol. 27, 2020, https://doi.org/10.1016/j.matpr.2020.03.120.
Cited by
About this article

