Abstract
The study discusses the accuracy of eddy current sensors in measuring material thickness, during production process with a maximum deviation of 25,3 µm. It presents a comparison table of calibrated plates and sensor readings, highlighting certain discrepancies attributed to measurement techniques, random errors and sensor positions. The experiment's findings show that by implementing sensors it is possible to monitor process in real time and adjust parameters accordingly.
1. Introduction
Progressive stamping remains crucial mass manufacturing method of complex metal parts production where controlling tool injection depth between punch and die is key to ensuring dimensional accuracy and material integrity. However, traditional methods for maintaining consistent injection such as manual micrometer checks struggle to keep pace with high-speed production and variations in strip thickness due to material inconsistencies and tool wear.
Recent advances in sensor-based monitoring have opened new possibilities for real-time injection control. Notably, eddy current sensors, which are well known in non-destructive testing (NDT), can detect subtle variations in proximity and material properties with high sensitivity and speed [1].
Among progressive stamping innovations, deep metric learning were to employed to classify tool conditions directly from sensor data [4], were results shows that tool injection is key process parameter that ensures stable conditions for the formation but is difficult to achieve in practice. Moreover, modern implementations of eddy current systems feature are low-cost, flexible instruments that facilitate rapid data collection and adaptability for industrial use [5]. Deep learning has also been harnessed in eddy current testing, especially for defect depth evaluation and structural monitoring with accuracies up to 94 % [2, 3].
Printed eddy current sensors, such as dispenser or screen-printed coils, have emerged as adaptable tools for tight geometries and constrained spaces [6]. Such formats ease integration into stamping tools, offering direct proximity sensing without complex retrofits.
Eddy current sensors adaptation research further extends this paradigm by creating multi-frequency, multi-modal eddy current systems capable of characterizing material properties in-process paving the way for inline compensation of material variations [6]. In parallel, structural health monitoring via embedded eddy sensors within additively manufactured test specimens illustrates potential for detecting real-time displacement changes [7].
Production engineering has shifted toward data-driven methodologies in tool operation optimization, where sensor fusion used in order to identify productivity bottlenecks in progressive dies, linking sensor signals to mechanical anomalies an approach directly translatable to injection control [8].
Suggested principle based on the idea to determinate and keep injection level of new tool same as it was planned and stated in tool design and production phases which is quite hard due to material thickness variations in each coil and during lifetime. Based on the suggested principle it would be sufficient to determine part quality based on material thickness and injection and later in the manufacture process adjust injection level based on actual material changes. Mathematically, this method can be expressed by the equation:
where: – estimated stripper position at any moment, – determined tool injection level at the beginning of the production, – material thickness used at the time, – measured material thickness at any moment.
2. Experimental research methodology
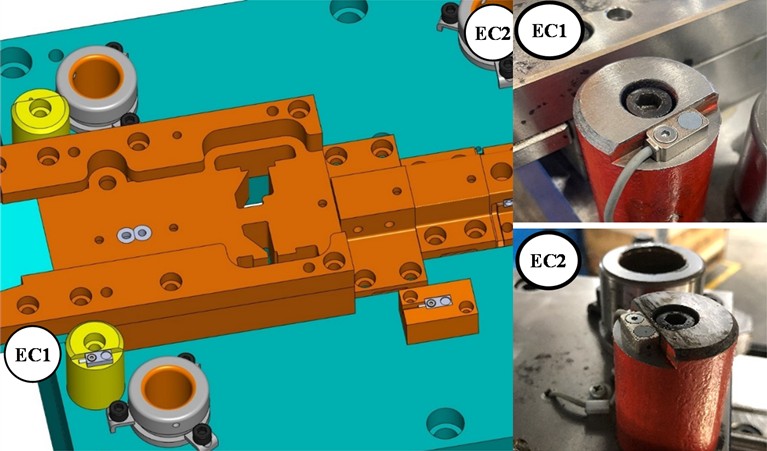
In order to confirm the suggested principle, a couple of eddy current sensors (EC1 and EC2) were decided to use. Sensors location showed in Fig. 1. Sensors measure stripper distance from tool stops block supports. Because stripper movement is limited by the workpiece, its lowest measured distance should be equal to the workpiece thickness variation . By this distance it should be possible to determine tool injection level and with accrued real-life data should be able to adjust process parameter accordingly.
Fig. 1Eddy current sensors positions
3. Results
The test started with sensors measurement, EC1 and EC2, performance evaluation. For this purpose, calibrated steel plates of thickness close to 0,7, 0,8 and 1,0 mm were selected. After checking the selected material strips with micrometer Mitutoyo 293-238, was determined that the real individual plates have a thickness ranging respectively between 0,708-0,712, 0,799-0,814 and 0,996-1,003 mm. Since the variation is very small, it may be measurement errors arising from the micrometer ends in the presence of dust and other reasons. Therefore, further assumption was made that the single denomination of the strip thickness is the same – accordingly 0,710, 0,807 and 1,000 mm.
Selected material strips were placed in tool as imitation of workpiece and with each option 30 cycles were performed. During cycles sensors EC1 and EC2 reading were recorded. Material plates locations showed in Fig. 2 and sensors reading summarized in Table 1.
Fig. 2Calibrated plates locations
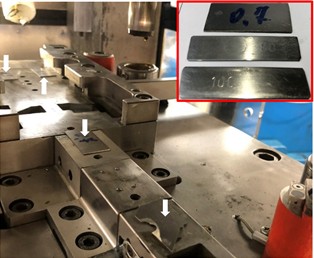
Table 1Calibrated plates thickness measurement, with sensors EC1 and EC2, results
Plate thickness, µm | |||||||||
710,0 | 807,0 | 1000,0 | |||||||
No | EC1 reading, µm | EC2 reading, µm | Average sensor reading, µm | EC1 reading, µm | EC2 reading, µm | Average sensor reading, µm | EC1 reading, µm | EC2 reading, µm | Average sensor reading, µm |
1 | 374,3 | 361,3 | 367,8 | 447,3 | 452,5 | 449,9 | 655,8 | 660,0 | 657,9 |
2 | 373,7 | 360,2 | 367,0 | 447,3 | 452,5 | 449,9 | 655,8 | 660,0 | 657,9 |
3 | 374,0 | 360,4 | 367,2 | 445,4 | 452,5 | 449,0 | 649,7 | 664,1 | 656,9 |
4 | 373,7 | 359,7 | 366,7 | 445,2 | 452,5 | 448,9 | 645,5 | 664,7 | 655,1 |
5 | 373,7 | 360,1 | 366,9 | 444,9 | 452,5 | 448,7 | 644,6 | 664,9 | 654,8 |
6 | 373,7 | 360,0 | 366,9 | 445,1 | 452,6 | 448,9 | 644,6 | 664,9 | 654,8 |
7 | 373,7 | 359,9 | 366,8 | 445,1 | 452,6 | 448,9 | 641,4 | 666,4 | 653,9 |
8 | 373,7 | 359,9 | 366,8 | 444,6 | 452,6 | 448,6 | 641,3 | 666,0 | 653,7 |
9 | 373,4 | 360,4 | 366,9 | 444,7 | 452,6 | 448,7 | 641,3 | 666,0 | 653,7 |
10 | 373,7 | 360,0 | 366,9 | 444,7 | 452,6 | 448,7 | 641,3 | 666,0 | 653,7 |
11 | 373,5 | 360,2 | 366,9 | 444,6 | 453,6 | 449,1 | 640,5 | 666,7 | 653,6 |
12 | 373,8 | 360,0 | 366,9 | 444,6 | 453,6 | 449,1 | 640,2 | 667,1 | 653,7 |
13 | 374,0 | 360,1 | 367,1 | 444,6 | 453,6 | 449,1 | 640,2 | 667,1 | 653,7 |
14 | 373,5 | 359,7 | 366,6 | 444,9 | 453,6 | 449,3 | 641,0 | 666,5 | 653,8 |
15 | 373,7 | 359,9 | 366,8 | 444,7 | 453,6 | 449,2 | 641,0 | 666,5 | 653,8 |
16 | 373,7 | 359,8 | 366,8 | 444,8 | 454,0 | 449,4 | 640,8 | 667,1 | 654,0 |
17 | 373,5 | 359,8 | 366,7 | 444,7 | 453,7 | 449,2 | 641,1 | 667,1 | 654,1 |
18 | 373,7 | 359,7 | 366,7 | 444,9 | 454,2 | 449,6 | 641,4 | 667,6 | 654,5 |
19 | 373,7 | 359,7 | 366,7 | 444,9 | 454,2 | 449,6 | 641,9 | 666,7 | 654,3 |
20 | 373,7 | 359,8 | 366,8 | 445,6 | 454,2 | 449,9 | 641,9 | 666,7 | 654,3 |
21 | 373,7 | 359,9 | 366,8 | 445,6 | 454,2 | 449,9 | 642,3 | 668,0 | 655,2 |
22 | 373,5 | 359,9 | 366,7 | 445,3 | 454,0 | 449,7 | 641,9 | 668,0 | 655,0 |
23 | 373,7 | 359,9 | 366,8 | 445,3 | 454,0 | 449,7 | 641,9 | 668,0 | 655,0 |
24 | 374,0 | 359,9 | 367,0 | 454,3 | 454,0 | 454,2 | 641,9 | 668,0 | 655,0 |
25 | 373,7 | 359,5 | 366,6 | 445,3 | 453,6 | 449,5 | 642,2 | 669,1 | 655,7 |
26 | 373,7 | 359,6 | 366,7 | 445,2 | 454,0 | 449,6 | 641,8 | 669,9 | 655,9 |
27 | 373,7 | 359,4 | 366,6 | 444,9 | 453,8 | 449,4 | 642,3 | 670,0 | 656,2 |
28 | 373,7 | 359,4 | 366,6 | 444,9 | 453,8 | 449,4 | 641,9 | 670,5 | 656,2 |
29 | 373,7 | 359,5 | 366,6 | 444,8 | 454,2 | 449,5 | 641,3 | 670,8 | 656,1 |
30 | 373,7 | 359,7 | 366,7 | 444,8 | 454,2 | 449,5 | 641,2 | 670,9 | 656,1 |
Average | 373,7 | 359,9 | 366,8 | 445,4 | 453,5 | 449,4 | 642,9 | 667,0 | 655,0 |
Standard deviation | 0,17 | 0,37 | N/A | 1,80 | 0,68 | N/A | 3,90 | 2,63 | N/A |
From the above data show that the two sensor readings are stable – the standard deviations are only a few micrometers. Of course, working in real-life conditions, the variation should be slightly higher, since, unlike the calibrated plates, the materials of the coil will not be perfectly straightened, also it will be sprayed with a lubricant. Nevertheless, bearing in mind that usually the injection is controlled by 0.1 mm, etc. and 100 µm, measurements repeatability presented by eddy current sensors should be sufficient.
The other thing that goes down in the eyes, that there is a difference between micrometer and sensors measured plates thickness. This is because the sensors are mounted slightly above the physical plane on which the workpiece were placed. This creates a systemic – around 350 µm error. However, in this case it is not critical, because material thickness change was tracked , and not absolute workpiece thickness value.
The analysis of the thickness change measurements is presented in Table 2. It shows that the results obtained by the two sensors are differ. Since in some cases the sensors obtain a smaller difference, and in others, on the contrary, a larger difference, it can be suspected that the error is not systematic, but random. To check this, t-test were performed with statistical date program Minitab. Results were presented with 95 percent confidence intervals for the differences obtained by the sensors. It should be noted here that the data analysis revealed that received values do not fit the normal distribution. However, the fact that a quite large quantity of values was taken allows to ignore this requirement. Also, when performing the test, assume was not taken that the standard deviations of the corresponding measurement series are equal, because it turned out that in many cases they differ significantly. These factors introduce additional uncertainty into the analysis. Nevertheless, in all cases it could be observed, that both when evaluating the readings of individual sensors and their average value, the difference in plate thicknesses measured by the micrometer is outside the confidence intervals of the corresponding differences measured by the sensors. This indicates that the discrepancies between the two measurement methods cannot be explained by random error alone. On the other hand, the largest deviation is only 25.3 µm. Therefore, assumption could be taken that the accuracy of the thickness change determined by sensors EC1 and EC2 is sufficient to achieve the desired result.
Table 2Material thickness variation measurement comparison
Calibrated plates thickness, µm | Plates thickness difference, µm | Thickness difference measured by sensors, µm | ||||||
EC1 | EC2 | Average | ||||||
No. 1 | No. 2 | Difference, µm | Confidence interval, 95 % | Difference, µm | Confidence interval, 95 % | Difference, µm | Confidence interval, 95 % | |
710 | 807 | 97 | 71,7 | (71,042; 72,392) | 93,5 | (93,259; 93,828) | 82,6 | (82,257; 83,003) |
807 | 1000 | 193 | 197,5 | (195,965; 199,168) | 213,5 | (212,401; 214,379) | 205,5 | (204,899; 206,057) |
710 | 1000 | 290 | 269,2 | (267,807; 270,760) | 307,1 | (305,964; 307,902) | 288,1 | (287,636; 288,581) |
The last thing that catches the eyes is the differences between the measurements of the two sensors. Assumption could be made that the main reason for this is the tilt of the stripper when pressing the workpiece. In addition, since study is talking about small distances monitoring, the observed differences can also be influenced by random error, variation in plate thickness, unevenness in the die, and others. It is impossible to completely control these factors. Since in some cases the EC1 readings give a better result, and in others, on the contrary, EC2, were decided to follow the average value of their readings for best results.
4. Conclusions
After conducting research, the following conclusions were formulated:
1) The eddy current sensors demonstrated consistent performance, with readings showing minimal variation across multiple trials. This stability indicates that the sensors can reliably measure material thickness change during the stamping process.
2) The data collected from the sensors allows real-time adjustments to the tool injection levels.
3) Study adaptability ensured that the tool injection could be optimized based on the actual material thickness, leading to improved part quality.
4) A statistical analysis of the gathered data confirmed that the new method resulted in a statistically significant improvement in part consistency, with a p-value of less than 0.05.
References
-
Z. Dzulfikri, P.-W. Su, and C.-Y. Huang, “Stamping tool conditions diagnosis: a deep metric learning approach,” Applied Sciences, Vol. 11, No. 15, p. 6959, Jul. 2021, https://doi.org/10.3390/app11156959
-
J. Skardžius, S. Nagurnas, and V. Žuraulis, “Progressive tool modernization using sensor technology in automotive parts manufacturing,” in Lecture Notes in Intelligent Transportation and Infrastructure, Cham: Springer Nature Switzerland, 2024, pp. 149–161, https://doi.org/10.1007/978-3-031-52652-7_15
-
S. Hütter, Y. Simonin, G. Mook, and T. Halle, “Soft sensor system for in-process eddy current microstructure characterization,” Journal of Sensors and Sensor Systems, Vol. 13, No. 2, pp. 237–244, Dec. 2024, https://doi.org/10.5194/jsss-13-237-2024
-
M. A. Machado, “Eddy currents probe design for NDT applications: a review,” Sensors, Vol. 24, No. 17, p. 5819, Sep. 2024, https://doi.org/10.3390/s24175819
-
E. Brun, P.-J. Cottinet, A. Pelletier, and B. Ducharne, “Printed eddy current testing sensors: toward structural health monitoring applications,” Sensors, Vol. 23, No. 19, p. 8345, Oct. 2023, https://doi.org/10.3390/s23198345
-
P. Stoll, E. Gasparin, A. Spierings, and K. Wegener, “Embedding eddy current sensors into LPBF components for structural health monitoring,” Progress in Additive Manufacturing, Vol. 6, No. 3, pp. 445–453, Jul. 2021, https://doi.org/10.1007/s40964-021-00204-3
-
D. Farioli, E. Kaya, A. Fumagalli, P. Cattaneo, and M. Strano, “A data-based tool failure prevention approach in progressive die stamping,” Journal of Manufacturing and Materials Processing, Vol. 7, No. 3, p. 92, May 2023, https://doi.org/10.3390/jmmp7030092
-
D. A. Molitor et al., “Identifying productivity-limiting factors in progressive die stamping: data-driven methodology for process optimization,” Production Engineering, Vol. 19, No. 3-4, pp. 575–587, Jan. 2025, https://doi.org/10.1007/s11740-024-01328-5
About this article

The authors have not disclosed any funding.
The datasets generated during and/or analyzed during the current study are available from the corresponding author on reasonable request.
