Abstract
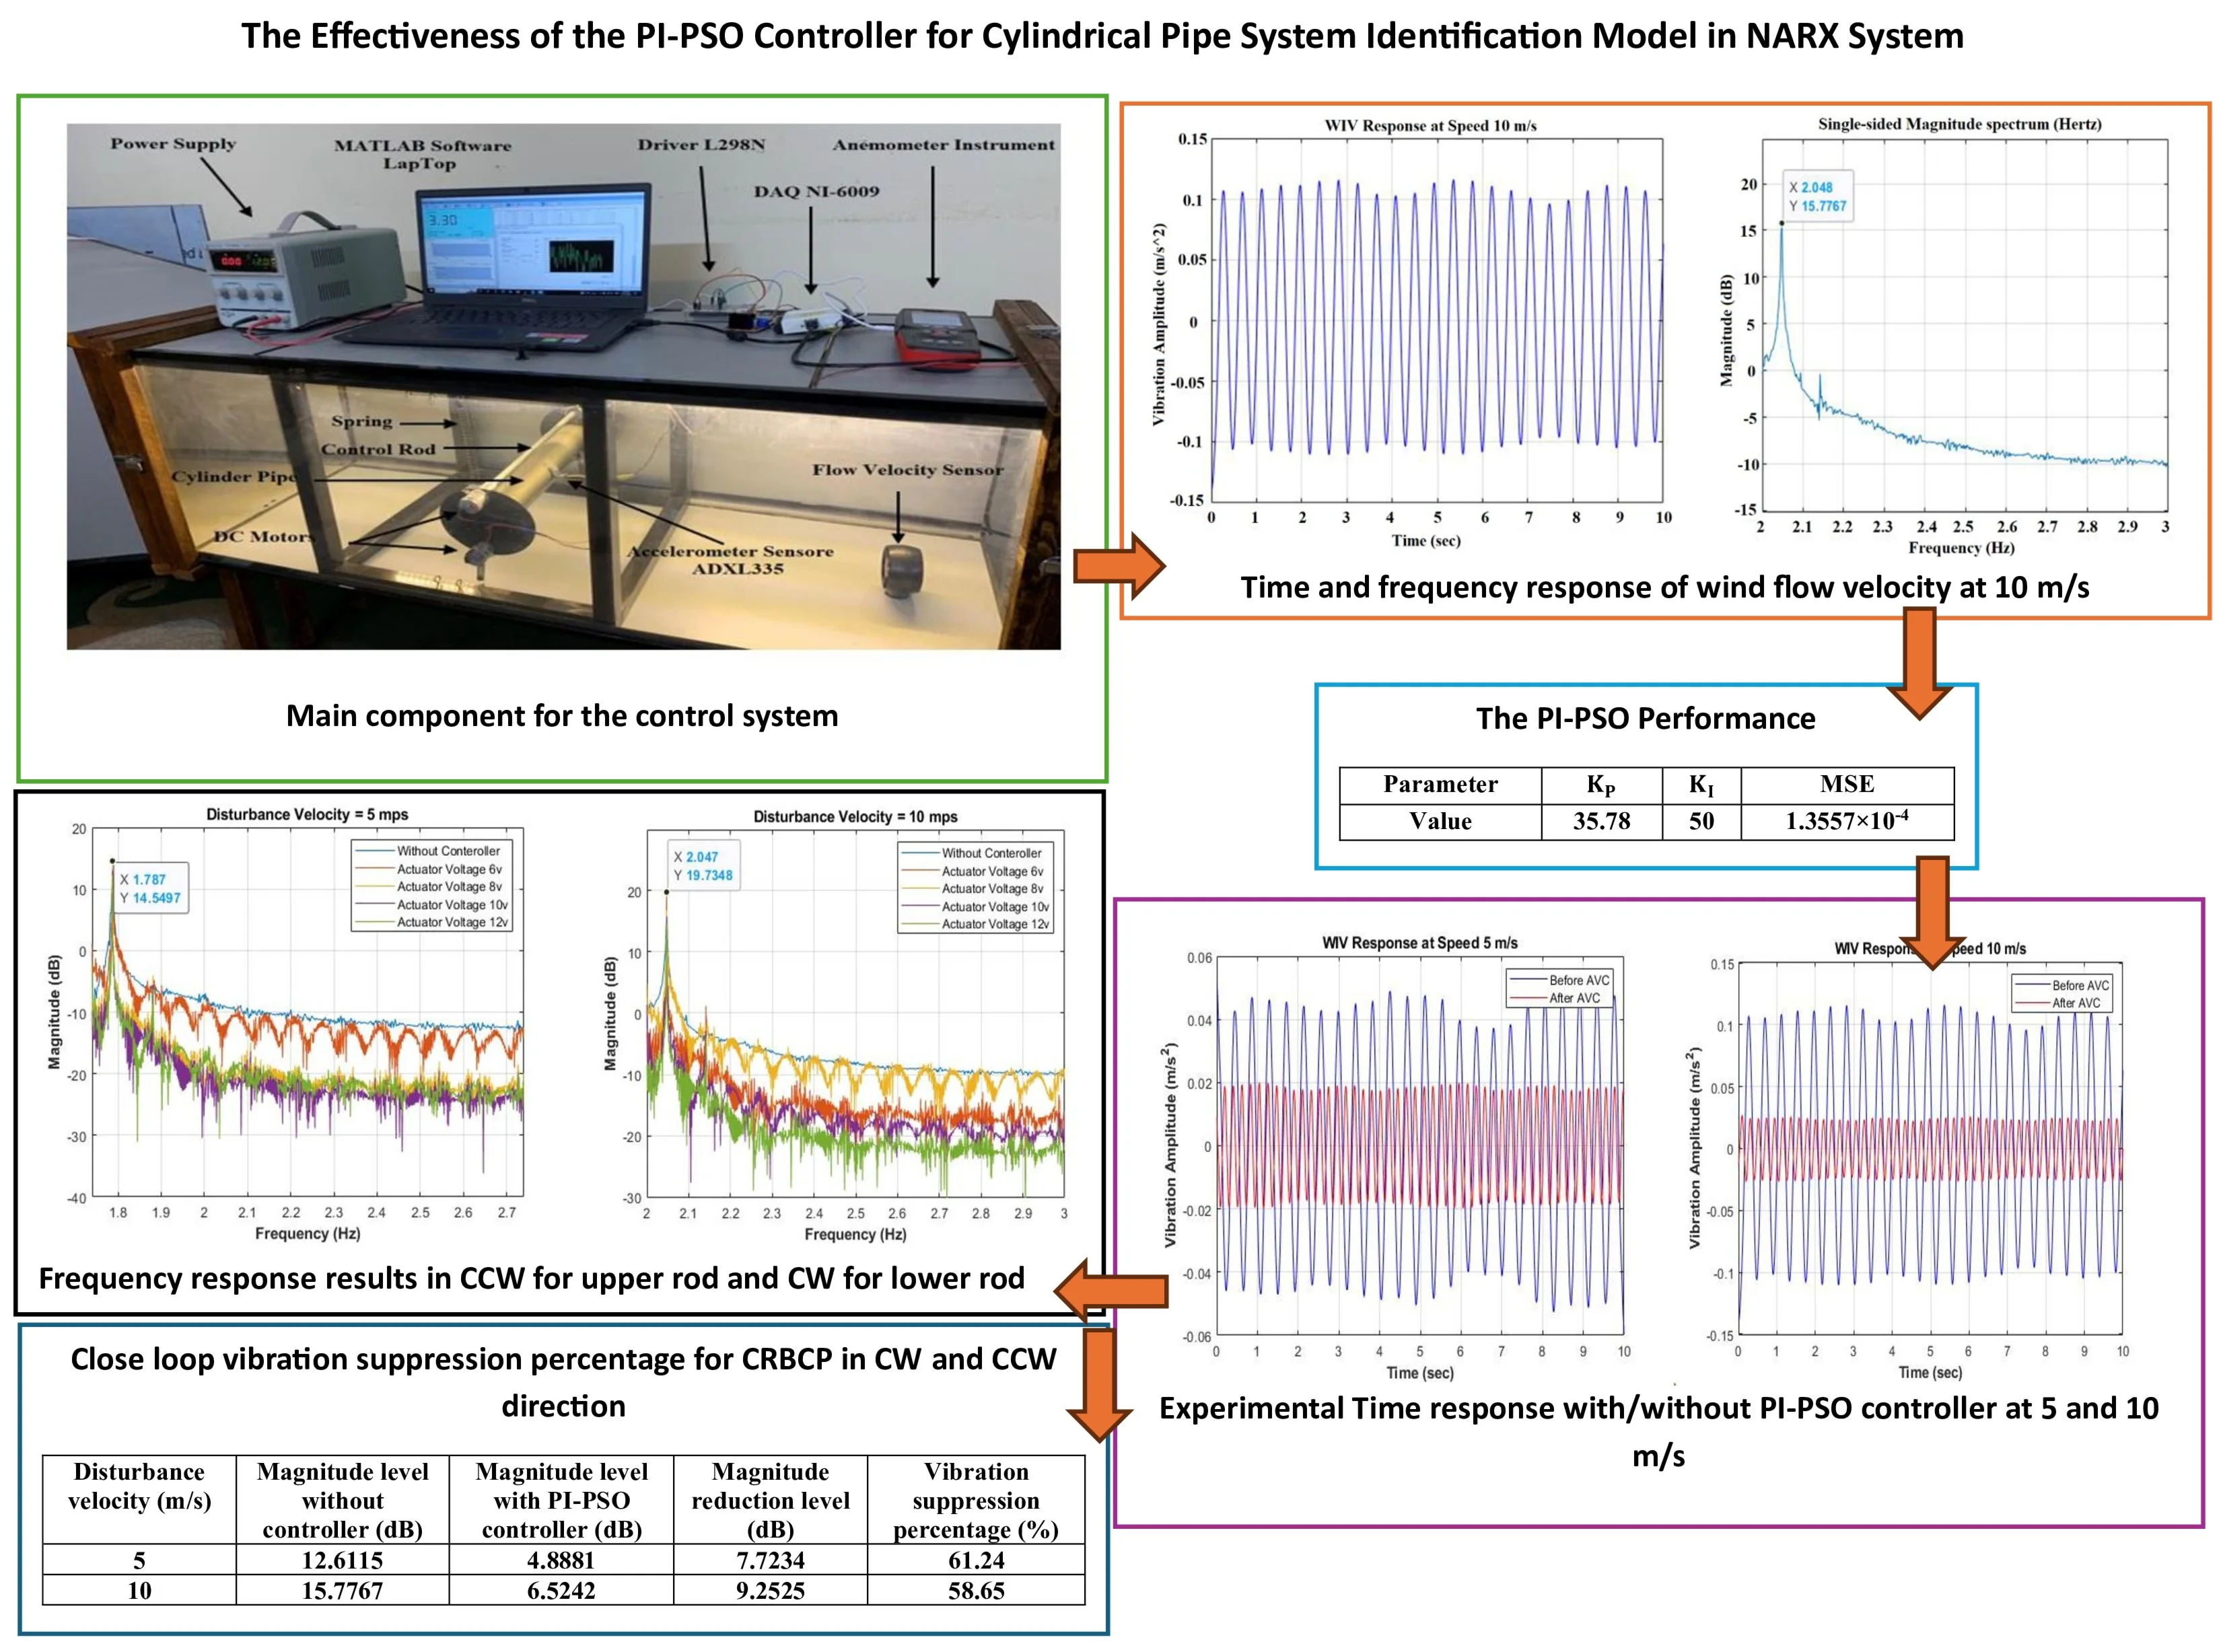
One of the main issues in the pipes’ structure that could be affected by wind that led to the failure of the cylinder pipe structure is vortex-induced vibration (VIV). Therefore, there is a need to control the wind that is going through the pipe to avoid vibration. This phenomenon leads to the failure of the structure due to the resonance phenomenon when the natural frequency of the structure is equal to the vortex frequency. The main contributions of this work are mathematical modeling of the system using NARX and suppressing the vibration caused by wind currents through simulation and experiment ways. PI-PSO control employed to reduce the unwanted vibration as a simulation work. Then, an experimental study implemented on the structure as an open and closed loop control techniques to decrease the vibration with disturbance vibrations of 5 and 10 m/s. Open loop active vibration control (OLAVC) is proposed in this work using dual control rods made from hollow stainless steel and driven by dual DC motors in two positions at 6, 8, 10, and 12 DCV. The control rods are located beside the main cylinder pipe (CRBCP) and from the upper and lower of the hollow cylinder pipe. The effectiveness of the passive control strategy was confirmed before supplying electricity to the two DC motors on both sides. The PI controller tuned by the PSO method was developed to control unwanted model vibration. Based on the control results, the best values of and were 35.78 and 50 respectively at the lowest MSE of 1.3557×10⁻⁴, and the frequency magnitude was reduced by 81.17 %. The findings also showed that the cylinder pipe vibration could not be sufficiently suppressed by the passive control method. While OLAVC succeeded in reducing the vibration when the motor voltage was at 12 V. Finally, the closed-loop control technique decreased the vibration up to 61.24 % and 58.65% for disturbance wind speeds of 5 and 10 m/s, respectively.
Highlights
- The main contributions of this work are mathematical modeling of the system using NARX and suppressing the vibration caused by wind currents through simulation and experiment ways.
- Active open and closed-loop controls had better performance compared to the passive technique at different motor voltages, especially at 10 and 12 DCV.
- OLAVC reduced the vibration at 5 and 10 m/s as disturbance velocities. Where the best reduction percentages were 66.57% for a disturbance velocity of 5 m/s and 65.09% for disturbance velocity of 10 m/s wind speed.
- CLAVC reduced the unwanted vibration with the PI-PSO controller by 61.24% for disturbance velocity of 5 m/s and 58.65% for a disturbance velocity of 10 m/s.
- Increasing the motor voltages led to decreasing the vibration at different disturbance velocities (5 and 10 m/s) for OLAVC and CLAVC with the PI-PSO controller compared to without the controller.
1. Introduction
Flow-induced vibration (FIV) is a well-known phenomenon that occurs in various practical situations involving structures. Where this phenomenon can be seen in many engineering applications, including chemical towers, chimneys, wind turbine towers, marine crane structures, steam generator pipes, communication towers, and many other applications [1]. In which the vortex-shedding frequency synchronizes with the natural frequency of the structure, transferring energy from the flow to the structure, followed by high-amplitude oscillations [2]. When cylindrical structures are subjected to unidirectional fluid currents, the fluid boundary layer begins to separate from both sides of the structure due to pressure and continues with the main flow at the back of the structure as a vortex layer that separates the fluid in the wake. The flow around a bluff body is sensitive to Reynold’s number (). The dimensionless Reynolds number can be calculated using the formula provided in Eq. (1) [3]:
where is the fluid density, is the free-stream velocity of the fluid, is the kinematic viscosity, and is the outer diameter of the bluff body. The dimensionless parameter is the reduced velocity () in Eq. (2). Can be defined as the relationship of the shedding frequency to the flow velocity [4]:
Instability at the boundary layer can lead to organized, unsteady, slow, or disorganized motion, regardless of whether the separating boundary layer is laminar or turbulent; periodic vortex shedding is dominated by the bluff body wake. A circular cylinder pipe is focused on bluff bodies, and flow about it is ubiquitous in both natural and industrial applications [5]. For example, Ma et al. [6]: This research examined the impact of circular cylinder vibration excitation mechanisms in the critical Reynolds number region at wind speeds greater than 15 m/s. The findings demonstrate that by narrowing the range of transitions on the boundary layers, surface roughness has a substantial impact on aerodynamic forces in the crucial Reynolds number range. Hu et al. [7]: Studied the flow-induced vibration (FIV) in a wind channel at Reynolds number = 4000-48000 of a circular cylinder that is elastically attached and put in the wake of a stationary one. The results of low in the water tunnel and high in the wind tunnel at the moment show that, with rising , the vibration amplitude and region are steadily reducing. These findings are based on the , S/D, and beginning circumstances. Qu Y. and Andrei V. Metrikine [8] presented a nonlinear modeling study and investigation of coupled crossflow and vortex-induced vibration (VIV) of elastic cylindrical structures.
The dimensionless Strouhal number is also used to calculate the frequency of vortex shedding with respect to the flow velocity of the fluid. Vortex shedding, also known as the separation point in turbulent flow, is the occurrence where eddies or vortices begin to detach from the surface. The frequency of vortex shedding depends on the wind's direction, speed, and the structure model. The resonance state appears when the vortex shedding frequency is equal to the natural frequency of the cylinder pipe. To calculate eddy frequency from the dimensionless Strouhal number equation is as shown in Eq. (3) [9]:
where is the frequency of the vortex shedding (Strouhal frequency), is the characteristic length of the cross-section (outer diameter), and is the free stream flow velocity. In engineering applications, controlling vibrations in structural bodies involves both artistic and scientific elements; however, while data for developing and improving effective control measures can be gathered through analysis or experimentation, practical applications are often constrained by time, equipment, and budget limitations. Engineers are often forced to make decisions consuming control measures without obtaining complete information. Therefore, such information is considered, especially in the case of controlling the vibrations of the body structures caused by the wind. The mass ratio of the model compares the mass of the cylinder to the mass of the surrounding fluid, as the vortex vibrates with a high mass ratio [10-13]. The main contribution in this work is to control the unwanted vibration using PI-PSO control of cylindrical pipe exposed to VIV in wind applications. In addition, experimental study of open and closed loop active control techniques has been conducted. This work is divided into VIV experimental setup, system identification model (NARX), passive, open and closed active control techniques, results and discussions and finally, conclusions.
2. VIV experimental setup
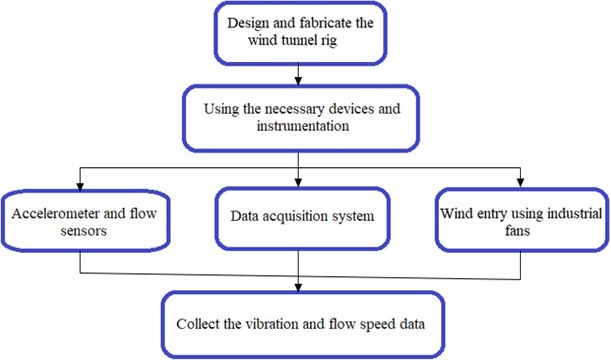
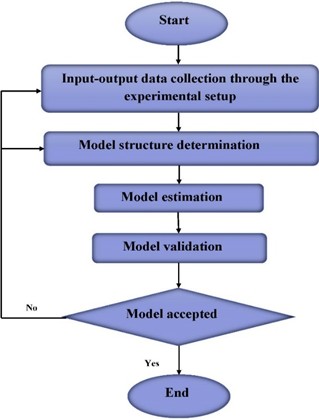
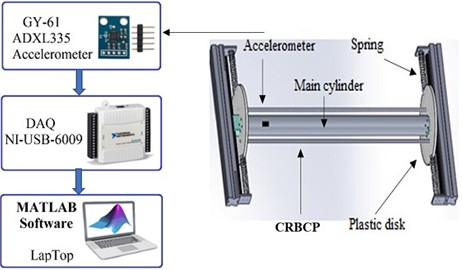
In this study, a hollow circular cylinder pipe model was designed and manufactured under VIV, the influence of data collection, which is done by using the necessary tools such as the accelerometer, sensor of flow rate, signal condition, and data acquisition (DAQ). The data collection flow chart applied in the experiment shows the process shown in Fig. 1.
Fig. 1Experimental data collection flow chart
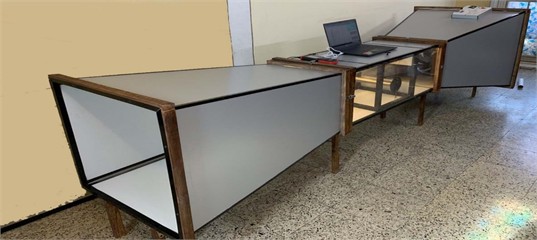
The wind tunnel is used in aerodynamic research to investigate the effects of air passing through solid objects, the forces acting on them, and their interaction with the airflow. The low-speed wind tunnel consists of three main parts: contraction, test section and diffuser. Fig. 2 shows the actual of the low-speed wind tunnel. The dimensions of the wind tunnel were an overall length of 3200 mm, a width of 880 mm. The dimensions of the test section (400×400) mm wide and 1000 mm in a length.
Fig. 2The actual open wind tunnel. The Figure captured by Dr. Firas Ali Jasim, on 12 December 2023, at the home workshop in Iraq
The wind tunnel provided wind velocity from 1 to 10 m/s in the test section. A smart anemometer was used to measure wind velocity [3, 12-13].
A single hollow aluminum cylinder vibrating through the direction of wind flow connected to a spring mounted on a circular plate on either side of the cylinder pipe is designed and manufactured. The configuration of the segmented circular cylinder pipe model is included, which is shown in Fig. 3, where the parameter that is used in the experimental study is shown in Table 1.
The mass effect is determined by parameters called the mass ratio (). This can be defined as the ratio of the oscillating structural mass of a cylinder in air () to the mass of the displaced fluid impinging on the vortex-induced vibration ():
where:
where is the total vibration system mass, is the fluid density, is the outer diameter of the cylinder, and is the cylinder length. Free vibration studies are difficult to analyze because of the link between decreased velocity (shedding frequency normalized by natural frequency) and the ratio of amplitude (amplitude normalized by cylinder diameter). To ensure that circumvent this problem, forced vibration studies are used to investigate one element at a time. Forced vibration studies may provide insights that free vibration testing cannot directly offer [14-15].
Numerous instruments and techniques have been used to simulate the VIV phenomenon, including the fans that are used to push the wind inside the tunnel at different speeds, data acquisition systems, and sensors integrated to collect the data for vibration to the computer [16-17].
Fig. 3Circular cylinder pipe model. The Figure captured by Dr. Firas Ali Jasim, on 12 December 2023, at the home workshop in Iraq
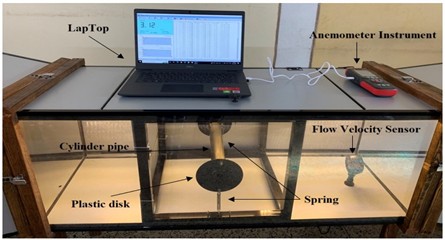
Table 1Experimental details of the VIV test
Parameters | Symbols | Values | Units |
Cylinder diameter | 50 | mm | |
Cylinder length | 300 | mm | |
Aspect ratio | 6 | Dimensionless | |
Mass of cylinder | 0.420 | Kg | |
Mass ratio | 582 | Dimensionless | |
Stiffness of system | 68.67 | N/m | |
Reynolds number | 3333-33333 | Dimensionless | |
Wind flow speed | 1-10 | m/s |
3. System identification (SI) modelling
System Identification is now considered one of the most important industrial applications for fault diagnosis and machine monitoring. SI is a field in control engineering concerned with deriving mathematical models of dynamic systems based on input-output observations. SI can also be used in modeling, control (dynamic specifications of control), and prediction (prediction of commodities and expectation of energy load) [18]. The algorithm of neural network time series is a neural network based on Neural Network Nonlinear Auto-Regressive External input model (NN-NARX). The neural network models are used to represent the relationship between the input-output data. The model estimation coefficient is then evaluated using validation approaches such as mean square error (MSE). For example, Fadi M. Khaleel [19] studied how to improve the electrical and thermal performance of solar panels using forced cooling with water using three neural network methods, namely NARX, NAR, and nonlinear input/output, based on the average error MSE to predict the temperature of solar panels. He reached the result that the best modeling method is NARX with an average error of 0.2255, while the worst method is nonlinear input/output with an average error of 0.4239. Lafta et al. [20] studied PID controller tuned by PSO technology to model nonlinear system identification of PV panel temperature with a NARX based Nonlinear Auto Regression with External (Exogenous) input and a Neuro-Fuzzy Inference System Adaptive (ANFIS). The study also generated basic models by predicting PV panel temperature and collected input parameters such as humidity, ambient temperature, radiation, and wind speed. it performed better for the NARX model. The SI technique flowchart as shown in Fig. 4. The NARX model makes future predictions stored in advance in the input and output variables and a significant research area in the field of control and modeling due to its ability to represent and quantify variable interactions in complex systems. The estimated output from the neural model is almost the same as the output from the actual process. A distinctive feature of a neural network is its ability to model nonlinear systems because adaptive and closed-loop responses are evaluated based on the amount of MSE. The total error as given in the equation [19], where NARX modelling is considered as a method based on nonlinear input-output models based on MSE to identify the system for vibration prediction:
where is the MSE, number of data, also is the actual output and is the predicted output. In which the PID parameters are set during the particle optimization method by determining the swarm size, where the initial gain parameters (, and ) are equal to zero in the MATLAB Simulink program, and after running the system program, the error rate (MSE) is determined and estimated. The relationship between input and output data is represented by the NARX model. The forecasted output vibration is concluded from two input series, input data and external input data represented by wind velocity and vibration on the cylinder pipe model.
Fig. 4System identification (SI) flowchart
4. PID controller
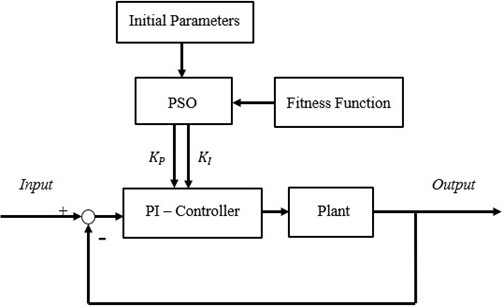
Active vibration control (AVC) simulation strategies are considered to reduce the circular cylindrical pipe prototype caused by WIV. The control unit mitigates the deflection of the cylindrical pipe model under the influence of the vortex by calculating the error between the measured output and the required value under the disruptive load. There are several smart ways to control the systems, such as PID, etc. This controller may be classed into four primary categories, the most notable of which are P, PI, PD, and PID. Proportional Integral (PI) controllers have much faster responses, are safe, economical, and have outstanding performance in many engineering and industrial applications. Therefore, the AVC strategies of the PI controller need to be set by the search optimization algorithm, the work of the PI controller is that it monitors the error between the desired set point and the process variable. Where the parameters gain ( and ) are selected to achieve the best results. It is tuned by the particle swarm optimization (PI-PSO) method [21]. Mühürcü et al. [22] focused on the power electronic converter and tries to keep the output of the converter under control and obtain a constant DC voltage level. A discrete-time PI controller has been inserted into the voltage controller. To maintain the efficiency of the control process at a high level, the controller parameter of and are optimized aided by PSO has optimized the and parameter of the PI discrete-time control algorithm have been optimized so that the closed-loop control system can operate at the highest efficiency. Sultana et al. (2021) [23] studied a control strategy proposed that relies on a self-adjusting method and a reference frame synchronized with a PI regulator to achieve optimal quality in the 120 kV electrical power network. To adjust the parameters of the PI controller, a (PSO) strategy was used, which ensures flexible performance and high-power quality. Malarczyk et al. [24] studied in wind tunnels of a long cantilever bite support systems with minimal structural damping. During testing, flow separation, and turbulence are encountered, which leads to destructive low-frequency and large amplitude resonance, lowering data quality and limiting the test envelope. Moreover, a self-adaptive fuzzy ratio differentiation (PD) control model was proposed to realize automatic adjustment of the control parameter for different test conditions [25]. Thus, Fig. 5 represents the following schematic diagram of the PI-PSO controller.
Fig. 5Block diagram of PI-PSO controller
The PSO optimization method depends on several parameters, the th particle is represented as , in the - dimensional space. While the best previous position with the lowest value of fitness for every particle is shown by:
were . The indication of the best particle of every one particle in the population is represented with the symbol and it’s known as . The particle speed is represented as and its update depends on the following equation [26]:
where is the swarm size coefficient, is the iteration, , where is the execution time of the task , which is required by the processor to complete the task, , where is the deadline for the task , and , and are generated uniformly or equivalent values for the random function between 0 and 1 [27]. Eq. (8) is used to compute the new particle velocity based on the previous velocity and distance of the current position to the best previous position in its own experience and the best experience for the group. The particle then flies towards a new position.
5. Control strategies
5.1. Technique of passive control
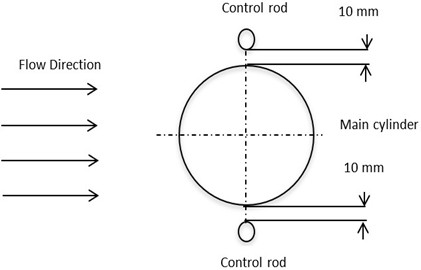
The passive control technique provides the experimental suppression of the hollow cylinder pipe model deflection by using a doubles control rod located in positions with a diameter of 8 mm, was control rod beside the main cylinder position (CRBCP). When the double control rods were fixed, as shown in Fig. 6 depicts two different configurations of the control rod’s location to apply a trial-and-error method of passive vibration control. The distance of 10 mm between the control rod’s circumference and the main circular cylinder circumference was set to enable AVC with control rods with a diameter of 10 mm. It has been noted that there is some suppression at less than 8 mm. That considered with different range distances was chosen to avoid cylinder pipe suppression to apply active control in the step and demonstrate the true performance of the active control technique.
Fig. 6Diagram of control rods beside the main cylinder position (CRBCP)
The double-control rods were positioned by the hollow circular cylinder pipe about the incoming wind flow configuration of the main cylinder. An NI-USB 6009 device (DAQ) has been employed via the accelerometer GY-61 ADXL335 sensor to accomplish the passive control technology using the computer analog inputs port via DAQ, as illustrated in Fig. 7. Using the required equipment, the same process has been used to record the amplitude vibration of the cylinder pipe.
5.2. Active open-loop vibration control
Vibration control with the active open-loop technique, which was not possible with passive control to suppress the unwanted vibration on the cylindrical pipe induced by VIV is covered in this section. The actuators for open-loop control are composed of two small 12V DC motors; each motor provides a rotation speed from 0 to 3000 rpm in both directions. These motors drive two control rods, and an external power supply is located atop the rods. The motors were configured so they could turn the rods in both the CW and CCW directions. The workflow is illustrated by block diagrams in Fig. 8.
Fig. 7Schematic diagrams of output data collection
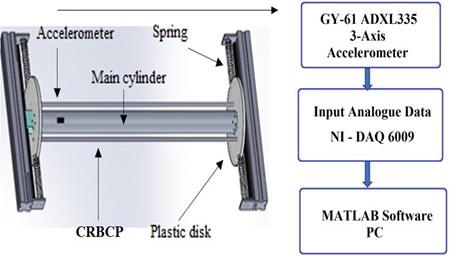
Fig. 8Data collection setup for control
Two locations were chosen for the rods. As shown in Fig. 9, DC motors received their voltage directly from an AC-DC power supply through driver L298N controlling DC motors. Furthermore, a MATLAB application was utilized to configure to receive and transmit the signal from accelerometers to the DC motor through DAQ NI-6009. Almost all electronic devices need a DC supply for its smooth operation, and it needs to be operating within certain power supply limits. A regulated linear power supply is used to ensure that the output remains constant even if the inputs change. A regulated linear DC power supply is also called a power supply. The double H driver module uses an L298N dual full-bridge driver, an integrated circuit. It is a high-voltage, high-current dual full-bridge driver designed to accept stander logic levels and drive inductive loads such as relays and DC motors, etc. The input data are provided the signal will be used as input in ways to provide disable or enable the device independently of input signals.
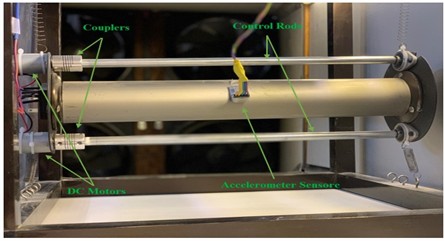
Fig. 10 shows the design and implementation aspect of the hollow cylinder vibration control system consisting of the main parts of DC motors and rods to control the vertical vibration cylinder pipe.
6. Results and discussions
6.1. Experimental flow velocities and vibration results
The input parameter is used to study the wind velocity in the test section of the wind tunnel system. The cylindrical pipe deflection caused by VIV and the wind flow velocity are provided in this subsection. Table 2 displays data on average wind flow velocity that was collected by using software and an anemometer sensor.
Fig. 9Output rotational speed generation process through L298N and power supply
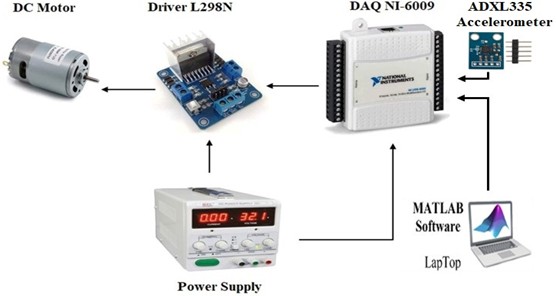
Fig. 10Main component for a control system in the side test section of a wind tunnel. The Figure captured by Dr. Firas Ali Jasim, on 12 December 2023, at the home workshop in Iraq
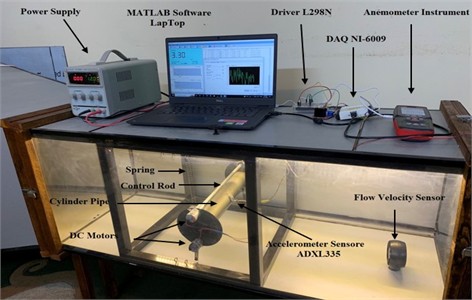
Table 2The parameter based on wind flow velocity measurement
No. | Wind flows at velocity (m/s) | reduced velocity | Reynolds number | Strouhal number | MSE |
1 | 1.01 | 9.85 | 3333 | 0.157 | 8.816×10⁻⁷ |
2 | 2.04 | 19.70 | 6666 | 0.153 | 8.338×10⁻⁷ |
3 | 3.00 | 29.56 | 10000 | 0.150 | 1.696×10⁻⁶ |
4 | 4.07 | 39.41 | 13333 | 0.148 | 2.859×10⁻⁶ |
5 | 5.02 | 49.26 | 16666 | 0.146 | 3.694E-06 |
6 | 6.03 | 59.11 | 20000 | 0.145 | 6.132×10⁻⁶ |
7 | 7.04 | 68.96 | 23333 | 0.144 | 9.784×10⁻⁶ |
8 | 8.19 | 78.82 | 26666 | 0.143 | 5.159×10⁻⁶ |
9 | 9.08 | 88.67 | 30000 | 0.1429 | 6.430×10⁻⁶ |
10 | 10.01 | 98.52 | 33333 | 0.1423 | 1.873×10⁻⁵ |
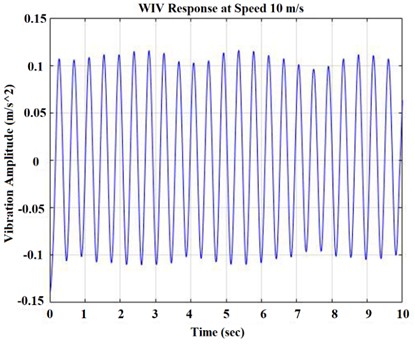
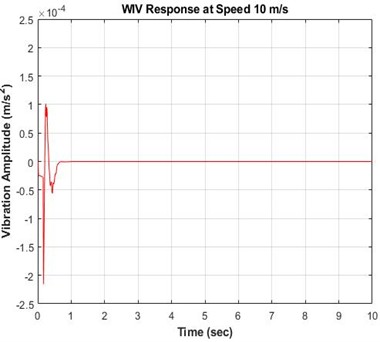
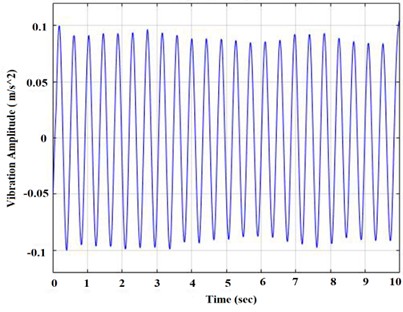
To study the effect of deflection of a circular cylinder pipe model resulting from wind flow velocities ranging from 1 to 10 meters per second, which was carried out inside a wind tunnel, the values 5 and 10 meters per second were chosen to determine the maximum deflection. This section presents the time and frequency response to the vibration of a cylindrical pipe at different wind speeds. The vibration frequency at the corresponding system response to the maximum amplitude of vibration according to the speed of 10 m/s, which is shown in Fig. 11, when the amplitude values are obtained experimentally. The maximum amplitude of vibration of the cylindrical pipe was found at maximum speed compared to the other wind speeds.
After determining the working range of the wind speed that affects the vibration of the circular cylindrical pipe at 10 m/s, according to the length of the hollow cylinder pipe (300 mm) and diameter (50 mm). The aspect ratio of the cylinder (/ = 6) is significant due to the flow dynamics around the cylindrical pipe. It can have a significant impact on the vortex dynamics, and the interdependence of fluid forces induced on the body and thus vibrations is determined by calculating the dimensionless values of reduced velocity and the Reynolds number dimensionless values.
Fig. 11Time and frequency response of wind flow velocity at 10 m/s
a) Time response
b) Frequency response
6.2. System identification of NARX modelling technique
The NARX model represents the relationship between input and output data. The forecasted output vibration is concluded from two input series: input data and external input data represented by wind velocity and vibration on the cylinder pipe model. Through this study, the lowest MSE was recorded for the NARX model, as it was studied for wind velocities of 5 and 10 m/s.
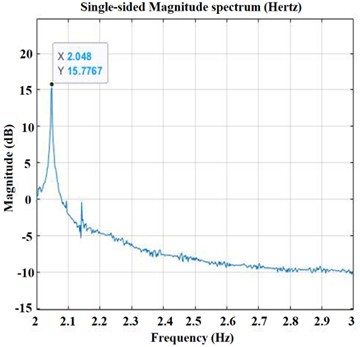
Figs. 12, 13 and 14 display the actual and predicted vibration response for the NARX modeling technique and the prediction error in addition to the first mode frequency.
Fig. 12Actual and prediction vibration amplitude response of NARX modeling at a wind speed of (5, 10 m/s)
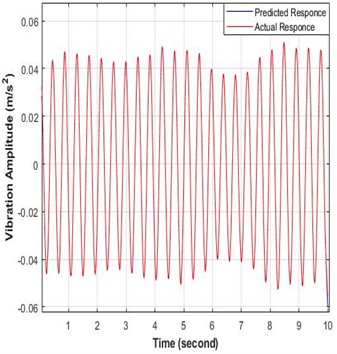
a) 5 m/s
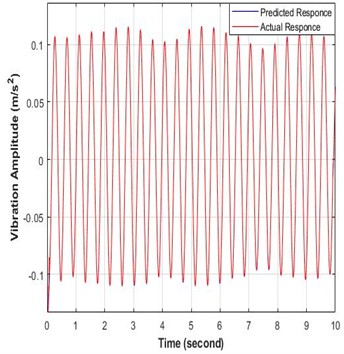
b) 10 m/s
Fig. 13Prediction error of NARX modeling at a wind speed of (5 and 10 m/s)
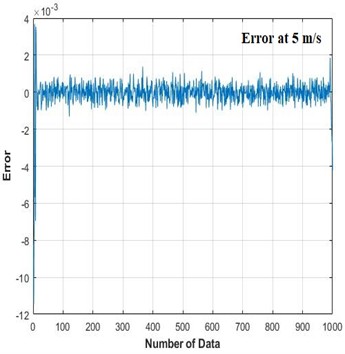
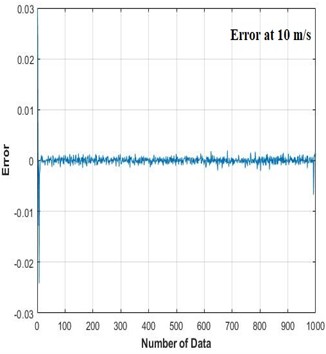
Fig. 14Frequency response of NARX modeling at a wind speed of (5 and 10 m/s)
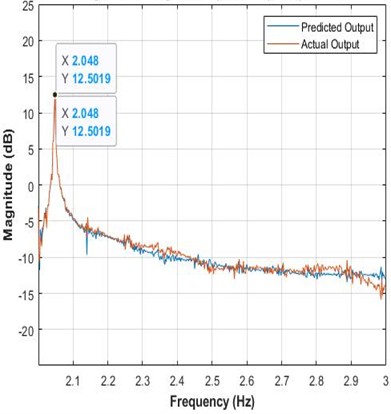
a) 5 m/s
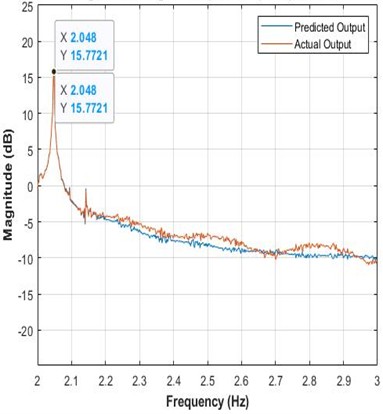
b) 10 m/s
The results demonstrated the relationship between error and input, with the output copies shifting within the confidence range. Based on these findings, we conclude that simplified NARX models are appropriate for predicting the behavior of controlled structures, with good agreement between observed and model-predicted signals.
6.3. PI-PSO Optimize of AVC
The PSO intelligent method is used to convert the standard PI-controller. and were adopted based on the results of the NARX modeling technique using MSE. During the particle optimization process, the swarm size was set to 40 with 10 iterations, which was the optimal number, to establish good PI parameters. Based on previous studies, the number of swarms was selected. For every gain, the starting gain values and were all equal to 0. Next, the transfer function of the actuator block was set to unity for all AVC system simulations, which depends on MSE. Finally, find the gain value of and at the lowest MSE values displayed below in Table 3.
The PI-PSO controller with the NARX model successfully mitigated the deflection of the hollow cylindrical pipe model resulting from wind-induced- vibration. Fig. 15 shows the response performance of the PI-PSO.
Table 3The PI parameter after the PSO Intelligent controller
Parameter | MSE | ||
Value | 35.78 | 50 | 1.3557×10⁻⁴ |
Fig. 15Time and frequency response with PI-PSO controller
a) Vibration amplitude under PI-PSO controller
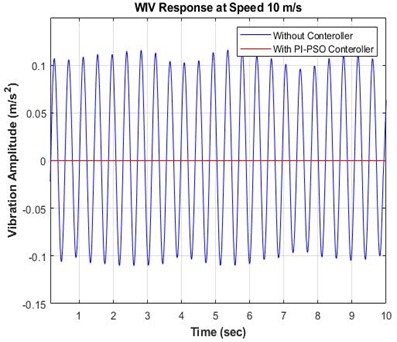
b) Vibration amplitude response with and without PI-PSO
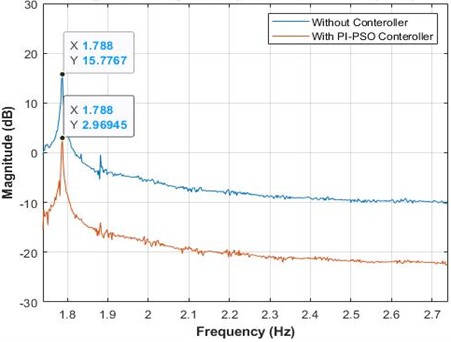
c) Frequency response with and without PI-PSO
The following Table 4 shows the performance of the PI controller unit that was tuned through PSO. It succeeded in reducing the deflection of the cylindrical pipe, as the lowest MSE was recorded at 1.3557×10⁻⁴, and the frequency magnitude was reduced by 81.17 %.
Table 4Before and after using the PI-PSO controller, the system magnitude results
Controller type | Magnitude before controller (dB) | Magnitude after controller (dB) | Attenuation level (dB) | Reduction percentage (%) |
PI-PSO | 15.7767 | 2.96945 | 12.80725 | 81.17 |
6.4. Passive techniques
Continuing from previous research [28], an electromechanical actuator was used on the circular cylinder pipe at the CRBCP to reduce vibration. The actuators were located at the upper and lower ends of the cylinder and at one where the rods were attached to the actuators through a coupling, as shown in Fig. 16.
Fig. 16Cylinder pipe with actuator captured by dr. Firas Ali Jasimin 2022 at home workshop in Iraq
The effectiveness of damping was verified before implementing the active control method. The study has been taken into two cases. First case used the passive-control techniques to verify of dual control rods when inserted next to the main cylinder pipe and at the upper and lower ends of it, it was observed that the effect of wind vortices on the cylindrical pipe, which caused vibration, led to the breaking of these vortices formed behind the cylindrical tube, which led to the suppression of vibration. Fig. 17 shows the frequency and time response of hollow cylinder deflection using dual control rods next to the cylinder pipe and at the upper and lower ends of the hollow cylinder pipe. It was discovered that introducing control rods into the system reduced the amplitude deflection of the cylinder pipe. The amplitude deflection of the cylinder pipe was slightly reduced compared to the response of the pipe without adding control rods. The amplitude value for the cylinder pipe without control rods positioned beside the cylinder pipe recording, the max deflection value, was 0.125 when the decrease in velocity () was 98.52.
Fig. 17The time and frequency response by adding double DC motor and rods at wind flow velocity at 10 m/s
a) Time response
b) Frequency response
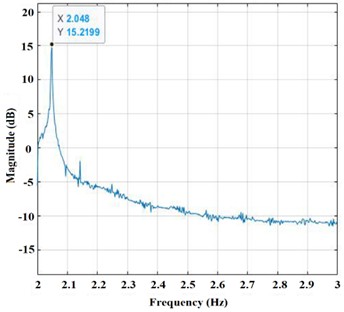
For the second case, which had a control rod at the upper and lower ends of the master cylinder pipe. The weight supplied to the systems reduced the first mode amplitude of frequency values when compared to the systems without actuators; the maximum cylinder pipe deflection with reduced velocity () at 98.52 resulted in an amplitude of 0.099. It was 20.8 % less than the value recorded in the case study when there were no control rods. The result showed that the frequency value of the maximum cylinder pipe deflections and reduced velocity of 98.52 should equal 2.048 Hz for CRBCP. The low-frequency values were caused by the inverse connection between frequency and mass, the added mass of the control rods, and other accessories.
6.5. Frequency analysis of OLAVC during various disturbances
The performance of OLAVC was best demonstrated through the display of frequency plots under difficult wind flow velocity perturbations. Fig. 18 shows the frequency response results of the hollow cylindrical pipe performance in both clockwise (CW) and counterclockwise (CCW) directions for CRBCP. It is observed that the amplitude of the signal decreases as the voltage supplied to the control system increases to 6, 8, 10, and 12 volts, compared to when the control system is absent at the same flow speed.
Fig. 18Frequency response results in CCW for upper rod and CW for lower rod directions in CRBCP at velocity 5 and 10 m/s
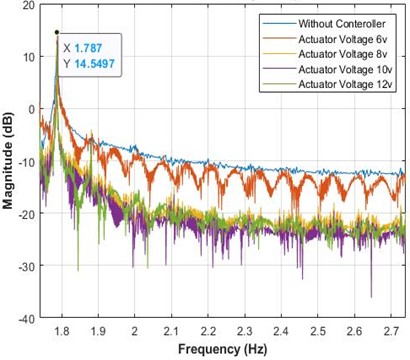
a) 5 m/s
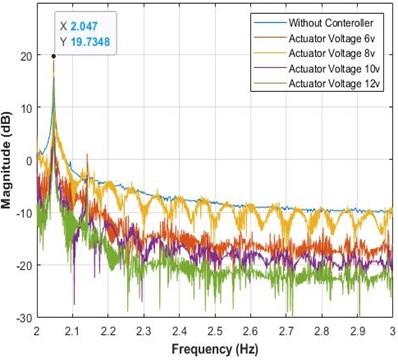
b) 10 m/s
Tables 5 shows the amounts of the reduction level at different disturbances wind with and without the use of OLAVC technology at all disturbance frequencies.
Table 5The amount level at different disturbances results in CCW for upper rod and CW for lower rod directions in CRBCP
Wind velocity (m/s) | Actuator voltage (V) | Magnitude level (dB) |
5 | Without controller | 14.549 |
6 | 12.259 | |
8 | 9.131 | |
10 | 6.501 | |
12 | 4.863 | |
10 | Without controller | 19.734 |
6 | 16.829 | |
8 | 9.926 | |
10 | 7.877 | |
12 | 6.889 |
Table 6 shows the observance result of the magnitude reduction level in the CCW of upper rod direction and CW of lower rod directions for CRBCP at disturbance velocity 5 and 10 m/s.
According to the study, the aspect is that proposed strategy reduced unwanted vibrations. The best performances were obtained utilizing a motor voltage of 12 volts. When the flow is disturbed at 10 m/s, record the max deflection of the cylinder pipe without using the control technique or applying a passive-control model. The magnitude level was decreased by the active open-loop control technique to 2.905, 9.808, 11.857, and 12.845 dB using 6, 8, 10 and 12 volts as actuator voltages, respectively. It is concluded that as the actuator speed increases, the vibration magnitude reduction levels of the system also increase, and its peak decreases. This was because of the control rod's rotating speed, which affected the vibrating frequency of the system. Finally, Table 7 shows the magnitude suppression percentages for motor voltages and disturbance frequencies ranging from 5 and 10 m/s. It can be concluded from that as actuator speeds increase, the system vibration magnitude reduction levels also increase, and its peak also decreases. The decrease was due to rotation speed of the control rods, which affected the vibration frequency of the system. Ultimately, the conclusion can be reached that at dual actuator speed, the attenuation level increases with turbulence increasing considerably at both positions.
Table 6Magnitude reduction levels in CW and CCW directions rotation rods in CRBCP at disturbance 5 and 10 m/s
Actuator voltage (V) | Magnitude reduction level at 5 m/s (dB) | Magnitude reduction levels at 10 m/s (dB) |
6 | 2.290 | 2.905 |
8 | 5.418 | 9.808 |
10 | 8.048 | 11.857 |
12 | 9.686 | 12.845 |
Table 7Vibration suppression percentage for CRBCP in a CW and CCW directions
Disturbance velocity (m/s) | Vibration suppression percentage at motor voltage (%) | |||
6 V | 8 V | 10 V | 12 V | |
5 | 15.73 | 37.23 | 55.31 | 66.57 |
10 | 14.72 | 49.70 | 60.08 | 65.09 |
6.6. Close loop of active vibration control (CLAVC)
Experimental results of the control units were developed via an electromechanical actuator for both actuator positions; the upper control rod location was rotating CCW while the lower control rod location was rotating CW for the CRBCP. In the simulation work, a PI-PSO type controller was used to implement the active closed-loop control strategy. Fig. 19 shows the vibration amplitude of the cylindrical pipe at the maximum wind speed.
Fig. 19Time response with/without PI-PSO controller at CRBCP
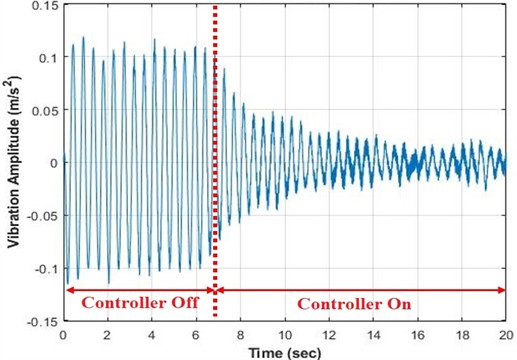
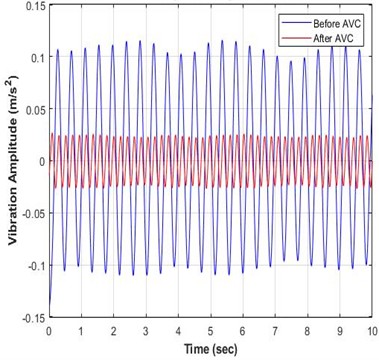
Based on the amplitude results, the PI-PSO controller performed well in reducing vibration, with the average vibration reduced to 0.05 m/s2. Fig. 20 shows the time response vibration amplitude, While Fig. 21 shows the result of the frequency response of the hollow cylindrical pipe performance at wind speed 5 and 10 m/s.
Table 8 shows the performance of the PI-PSO controller with closed-loop type active control technology to reduce unwanted vibration of the cylindrical pipe model by WIV. The highest attenuation level is 7.7234 dB, with a suppression percentage ratio of 61.24 % at disturbance velocity 5 m/s, while the percentages at velocity of 10 m/s was 9.2525 with a suppression percentage of 58.65 %.
Based on the above results, it can be concluded that the PI controller tuned by PSO intelligent optimization methods is of interest for both control procedures under experimental and simulated conditions for vibration suppression.
Fig. 20Time response results for CLAVC with/without PI-PSO controller at CRBCP
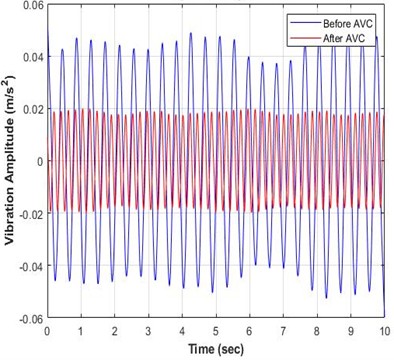
a) 5 m/s
b) 10 m/s
Fig. 21Frequency response results for CLAVC with/without PI-PSO controller at CRBCP
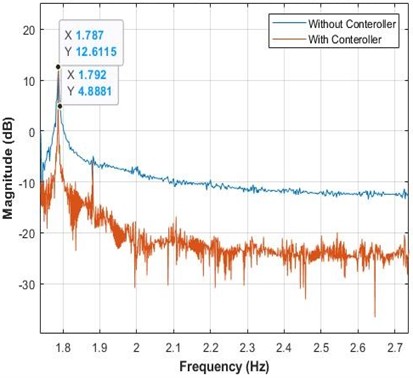
a) 5 m/s
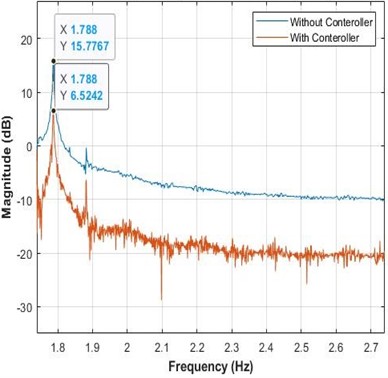
b) 10 m/s
Table 8Close loop vibration suppression percentage for CRBCP in CW and CCW direction
Disturbance velocity (m/s) | Magnitude level without controller (dB) | Magnitude level with PI-PSO controller (dB) | Magnitude reduction level (dB) | Vibration suppression percentage (%) |
5 | 12.6115 | 4.8881 | 7.7234 | 61.24 |
10 | 15.7767 | 6.5242 | 9.2525 | 58.65 |
7. Conclusions
This study dealt with the effectiveness of wind-induced vibration on the hollow cylindrical pipe in simulation and experimental ways. From the investigation of the AVC vibration behavior in the VIV suppression in a flexible vibration system based on simulation and experiment inside a wind tunnel, the following remarks can be derived:
1) The PI- PSO intelligent controller presented the best results at and values are 35.78, and 50 respectively, with the lowest MSE at 1.3557×10⁻⁴ and reduced the vibration up to 81.17 %.
2) Active open and closed-loop controls had better performance compared to the passive technique at different motor voltages, especially at 10 and 12 DCV.
3) OLAVC reduced the vibration at 5 and 10 m/s as disturbance velocities. Where the best reduction percentages were 66.57 % for a disturbance velocity of 5 m/s and 65.09 % for disturbance velocity of 10 m/s wind speed
4) CLAVC reduced the unwanted vibration with the PI-PSO controller by 61.24 % for disturbance velocity of 5 m/s and 58.65 % for a disturbance velocity of 10 m/s.
5) Increasing the motor voltages led to decreasing the vibration at different disturbance velocities (5 and 10 m/s) for OLAVC and CLAVC with the PI-PSO controller compared to without the controller.
References
-
S. Muddada and B. S. V. Patnaik, “Active flow control of vortex induced vibrations of a circular cylinder subjected to non-harmonic forcing,” Ocean Engineering, Vol. 142, pp. 62–77, Sep. 2017, https://doi.org/10.1016/j.oceaneng.2017.06.036
-
P. Han, E. de Langre, M. C. Thompson, K. Hourigan, and J. Zhao, “Vortex-induced vibration forever even with high structural damping,” Journal of Fluid Mechanics, Vol. 962, May 2023, https://doi.org/10.1017/jfm.2023.268
-
S. Sadasivan, G. Litak, and M. J. Gęca, “Numerical analysis of flow-induced transverse vibration of a cylinder with cubic non-linear stiffness at high Reynolds numbers,” Energies, Vol. 17, No. 7, p. 1776, Apr. 2024, https://doi.org/10.3390/en17071776
-
A. Hossein Rabiee, F. Rafieian, and A. Mosavi, “Active vibration control of tandem square cylinders for three different phenomena: Vortex-induced vibration, galloping, and wake-induced vibration,” Alexandria Engineering Journal, Vol. 61, No. 12, pp. 12019–12037, Dec. 2022, https://doi.org/10.1016/j.aej.2022.05.048
-
F. Hou, “Novel methods for predicting and controlling the wind-induced buffeting response of tall buildings in time domain,” Iowa State University, Mar. 2022, https://doi.org/10.31274/etd-20210114-62
-
W. Ma, Q. Liu, J. H. G. Macdonald, X. Yan, and Y. Zheng, “The effect of surface roughness on aerodynamic forces and vibrations for a circular cylinder in the critical Reynolds number range,” Journal of Wind Engineering and Industrial Aerodynamics, Vol. 187, pp. 61–72, Apr. 2019, https://doi.org/10.1016/j.jweia.2019.01.011
-
Z. Hu, J. Wang, and Y. Sun, “Flow-induced vibration of one-fixed-one-free tandem arrangement cylinders with different mass-damping ratios using wind tunnel experiment,” Journal of Fluids and Structures, Vol. 96, p. 103019, Jul. 2020, https://doi.org/10.1016/j.jfluidstructs.2020.103019
-
Y. Qu and A. V. Metrikine, “Modelling of coupled cross-flow and in-line vortex-induced vibrations of flexible cylindrical structures. Part I: model description and validation,” Nonlinear Dynamics, Vol. 103, No. 4, pp. 3059–3082, Jan. 2021, https://doi.org/10.1007/s11071-020-06168-3
-
M. G. Andika and Fariduzzaman, “Wind tunnel testing for vibration analysis of high rise building due to wind load,” in IOP Conference Series: Materials Science and Engineering, Vol. 620, No. 1, p. 012085, Sep. 2019, https://doi.org/10.1088/1757-899x/620/1/012085
-
Y. Yang, “Experimental investigations of vortex-induced vibration of a flat plat in pitch oscillation,” Texas A&M University, 2010.
-
M. J. Mohammed, I. Z. Mat Darus, N. M. R. Shaharuddin, and A. A. M. Al-Khafaji, “Open loop active control technique on segmented marine riser vibration using electromechanical actuator,” Iranian Journal of Science and Technology, Transactions of Mechanical Engineering, Vol. 43, No. 4, pp. 799–813, Jul. 2018, https://doi.org/10.1007/s40997-018-0229-y
-
N. Verma and B. D. Baloni, “Numerical and experimental investigation of flow in an open-type subsonic wind tunnel,” SN Applied Sciences, Vol. 1, No. 11, Oct. 2019, https://doi.org/10.1007/s42452-019-1422-3
-
X. Fan, Z. Wang, Y. Wang, and W. Tan, “The effect of vortices structures on the flow-induced vibration of three flexible tandem cylinders,” International Journal of Mechanical Sciences, Vol. 192, p. 106132, Feb. 2021, https://doi.org/10.1016/j.ijmecsci.2020.106132
-
M. Kaloop, J. Hu, and Y. Bigdeli, “Identification of the response of a controlled building structure subjected to seismic load by using nonlinear system models,” Applied Sciences, Vol. 6, No. 10, p. 301, Oct. 2016, https://doi.org/10.3390/app6100301
-
M. Balczó and T. Lajos, “Flow and dispersion phenomena in a simplified urban square,” Periodica Polytechnica Civil Engineering, Vol. 59, No. 3, pp. 347–360, Jan. 2015, https://doi.org/10.3311/ppci.7852
-
L. Cheng, Y. Zhou, and M. M. Zhang, “Controlled vortex-induced vibration on a fix-supported flexible cylinder in cross-flow,” Journal of Sound and Vibration, Vol. 292, No. 1-2, pp. 279–299, Apr. 2006, https://doi.org/10.1016/j.jsv.2005.07.044
-
X. Amandolèse and P. Hémon, “Vortex-induced vibration of a square cylinder in wind tunnel,” Comptes Rendus. Mécanique, Vol. 338, No. 1, pp. 12–17, Jan. 2010, https://doi.org/10.1016/j.crme.2009.12.001
-
G. F. Sirca and H. Adeli, “System identification in structural engineering,” Scientia Iranica, Vol. 19, No. 6, pp. 1355–1364, Dec. 2012, https://doi.org/10.1016/j.scient.2012.09.002
-
F. M. Khaleel, “Non-Parametric modeling and intelligent controller for photovoltaic cooling by porous media inserted,” University of Technology, 2021.
-
F. Lafta, I. Hasan, and J. Mohammed, “PID-PSO controller for PV panel system identification models on anfis and nn-narx system,” Journal of Engineering Science and Technology, Vol. 16, No. 6, pp. 4505–4517, 2021.
-
V. N. Ogar, S. Hussain, and K. A. A. Gamage, “Load frequency control using the particle swarm optimisation algorithm and PID controller for effective monitoring of transmission line,” Energies, Vol. 16, No. 15, p. 5748, Aug. 2023, https://doi.org/10.3390/en16155748
-
G. Muhurcu, E. Kose, A. Muhurcu, and A. Kuyumcu, “Parameter optimization of PI controller by PSO for optimal controlling of a Buck converter’s output,” in International Artificial Intelligence and Data Processing Symposium (IDAP), pp. 1–6, Sep. 2017, https://doi.org/10.1109/idap.2017.8090234
-
U. Sultana, S. H. Qazi, N. Rasheed, and M. W. Mustafa, “Performance analysis of real-time PSO tuned PI controller for regulating voltage and frequency in an AC microgrid,” International Journal of Electrical and Computer Engineering (IJECE), Vol. 11, No. 2, p. 1068, Apr. 2021, https://doi.org/10.11591/ijece.v11i2.pp1068-1076
-
M. Malarczyk, M. Zychlewicz, R. Stanislawski, and M. Kaminski, “Speed control based on state vector applied for electrical drive with elastic connection,” Automation, Vol. 3, No. 3, pp. 337–363, Jul. 2022, https://doi.org/10.3390/automation3030018
-
N. Aliman, R. Ramli, S. Mohamed Haris, M. Soleimani Amiri, and M. Van, “A robust adaptive-fuzzy-proportional-derivative controller for a rehabilitation lower limb exoskeleton,” Engineering Science and Technology, an International Journal, Vol. 35, p. 101097, Nov. 2022, https://doi.org/10.1016/j.jestch.2022.101097
-
A. Safari, “A PSO procedure for a coordinated tuning of power system stabilizers for multiple operating conditions,” Journal of Applied Research and Technology, Vol. 11, No. 5, pp. 665–673, Oct. 2013, https://doi.org/10.1016/s1665-6423(13)71574-8
-
J. Teraiya and A. Shah, “Optimized scheduling algorithm for soft real-time system using particle swarm optimization technique,” Evolutionary Intelligence, Vol. 15, No. 3, pp. 1935–1945, Apr. 2021, https://doi.org/10.1007/s12065-021-00599-6
-
F. Jasim, M. Mohammed, and H. Kadhom, “The effective of the passive and active techniques on the vibration control system,” Engineering and Technology Journal, pp. 1–14, May 2025, https://doi.org/10.30684/etj.2025.155222.1849
About this article

The authors have not disclosed any funding.
The datasets generated during and/or analyzed during the current study are available from the corresponding author on reasonable request.
The main contribution for Firas Jasin was implement the simulation and experimental works in addition to writing the paper, while Dr. Mohammed Jawad and Dr. Hatem Kareem proposed the work idea and methodology to implement it in addition to review the results and paper writing
The authors declare that they have no conflict of interest.
