Abstract
This paper presents the application of Fuzzy Iterative PID-Type controller in suppressing the vortex induced vibration of a flexibly mounted cylindrical pipe. A pair of input and output data, which are the water flow speed and vibration amplitude, respectively have been measured through experimental work in generating a linear autoregressive with exogenous input, ARX model. Recursive least square was utilized in determining the appropriate parameters of stated model. It was found that the 2nd model order had fulfilled the selection requirements, which include lowest mean squared error, stable transfer function and biased correlation of error. Fuzzy Iterative PID and PD controllers have been developed and tested within MATLAB Simulink interface for the control purpose of the developed ARX model. It was found that the Fuzzy Iterative PD controller had remarkably attenuated the vibration up to 66.67 dB and tends to converge faster which gives good implication to the vibrating system.
1. Introduction
Vortex induced vibration (VIV) is a fluid-structure interaction phenomenon that usually encountered by the underwater structure, for instance, marine riser pipe. As it name implies, the VIV phenomenon occurred when a slender circular body is exposed to the flowing water at sufficiently large Reynolds number. At this condition, the body will tend to vibrate due to the vortex formation at the aft part of the body. However, at higher Reynolds number, these vortices will form alternately and lift force will be generated due to the pressure difference at both sides of the body. As a consequence, the body will be vibrated in cross-flow direction and subsequently will lead to the resonance condition. Lock-in and synchronization are the terms that commonly used in describing the phenomenon. This condition, however, will happen when the frequency of the vortices approaching or equal to the natural frequency of the vibrating system. A gradual effect which related with fatigue damage will occur if the phenomenon happens in a repetitive mode for a certain period of time and thus will shorten the lifespan and reduce the reliability of the body itself. The understanding of the VIV mechanism from a circular cylinder has been deliberated and discussed extensively by previous researchers and investigated in both numerically and experimentally in the past [1-3].
The Reynolds number might be one of the most important dimensionless parameters in VIV due to its effect on the bluff body. It is basically a ratio of inertial force to the viscous force of the fluid and defined as , where, , and is the fluid density, water flow speed, outer diameter of a circular cylinder and dynamic viscosity at 20 °C, respectively. Meanwhile, the Strouhal number, describes oscillating flow mechanism and it relates the frequency at which the vortices are shed into the wake. It is given by where is the vortex shedding frequency. It is noted that the Strouhal number is found to be nearly constant at 0.20 for a large range of Reynolds number from 300 until 2×10⁵. Other affecting parameters, for example, reduced speed, amplitude ratio, frequency ratio, mass ratio and damping ratio which is not focused in this paper can be found in [3].
Passive and active control strategies are the two methods that are currently developed in suppressing the vibration from the vortex shedding. Increasing structural damping, avoiding resonance, stream-lining the geometry and incorporating add-on devices are some of the examples of passive control methods [4]. Meanwhile, the active control method can be implemented through the integration of actuator to the vibrated system. In this method, the external energy is supplied to the actuation system. However, before suppressing the vibration, it is vital to describe some of the methods that are currently available in modeling the phenomenon. Currently, there are five methods available, which are the wake-oscillator model, single degree of freedom model, force-decomposition model and system identification methods. Van der Pol equation is one of the well-known wake oscillator model used in analyzing the phenomena. Improvement has been made on this model which produces a better result as some of the nonlinearity terms have been added to the original equation. However, due to the high degree of nonlinearity of the vibrating system, the model has now become more complex which requires a unique solution. Single degree of freedom model uses a single ordinary differential equation to describe the behavior of the system. Meanwhile, in force-decomposition model, the lift force is decomposed into fluid inertia and fluid damping force which related to cylinder displacement and velocity respectively. These fluid forces are incorporated into the equation of motion for elastically mounted cylinder. Amongst all, system identification offers a better solution in implementing the active control method since it uses the actual input-output data from the vibrating system. Due to this reason, this study will utilize system identification technique in modeling the dynamic behavior of the vibrating system [5].
The implementation of the active vibration control on the vortex induced vibration phenomenon was initially reported by Ffowsc Williams and Zhao in 1989 and Baz and Ro in 1991 [6]. From their study, it was found that the implementation of active control has successfully reduced the velocity fluctuation around 30 dB. Since then, research on active method has been extensive and becomes more advanced nowadays. For instance, some of the strategies that have been studied by previous researchers are; by rotating the body itself [7], creating a local perturbation on cylinder surface [8-10], boundary control approach [11] and most recently implementation of rotary actuator to the cylinder [12]. It should be noted that most of these studies utilized a direct control method to the vibrating system, whereas, the implementation of closed loop control using adaptive method is somehow few. Hence, the objective of this paper is to investigate the implementation of active closed loop control method in simulation environment for the purpose of suppressing the vibration due to the vortex shedding using Fuzzy Iterative PID-Type controller. For a proper arrangement, the content of this paper is separated into four main sections which are the experimental setup, system identification on autoregressive with exogenous input (ARX) parameter using recursive least square (RLS) estimation, Fuzzy Iterative PID-Type controller development and finally some results and discussions obtained from the study.
2. Experimental setup
In the present work, the experiments were conducted at the Mechanics of Machine Laboratory of the Universiti Teknologi Malaysia (UTM). Experiments were carried out in a circulating water tank with effective working section of 0.5 m and 1.0 m long as shown in Fig. 1. The flow speed of the working section is up to 0.4 m/s. Details of the water tank were given [13]. Fig. 2 shows the vertical arrangement of pipe model in the circulating water tank. The cylinder was arranged in vertical position and flexibly mounted with 4 springs at both ends. The total spring stiffness was designed with the value of 140 N/m as to ensure resonance takes place. The cylinder was restricted to move in transverse vibration by using frictionless linear slider at both ends. The cylinder model used in this study is made of aluminium pipe with 615 mm in length and 51 mm in diameter. The small relativity of length to diameter ratio 12.9 used in this work will respond in a single mode of vibration. The detailed parameters of the cylinder model are listed in Table 1.
Fig. 1Circulating tank [13]
![Circulating tank [13]](https://static-01.extrica.com/articles/18350/18350-img1.jpg)
Fig. 2Pipe arrangements inside the circulating water tank
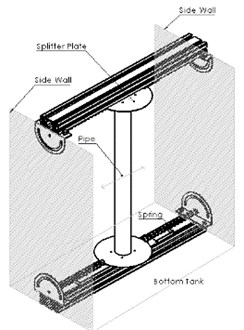
Table 1Physical property of cylinder model
Particulars | Value | Unit |
Length | 615 | mm |
Submerged length | 460 | mm |
Outer diameter | 51 | mm |
Inner diameter | 45 | mm |
Thickness | 6 | mm |
Length/diameter | 12.9 | – |
Total mass | 1.32 | Kg |
Mass ratio | 1.184 | – |
Total Spring stiffness | 140 | N/m |
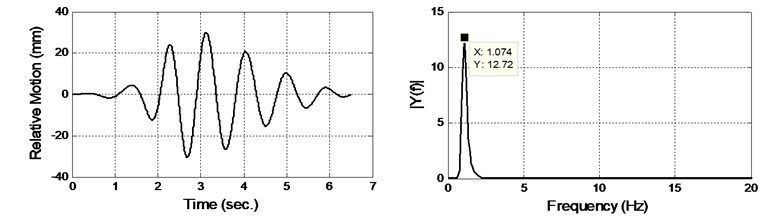
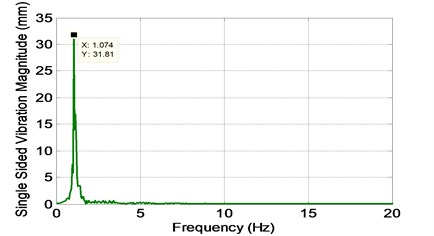
In order to perform the system identification technique, a sufficient pair of input and output data which contains most of the information from the vibrating system is required. In this research, the experiments are run up to 20 seconds of elapsed time. The current flow speed is considered as the input to the system since the vibration is originated from the current flow speed itself. Meanwhile, the output of the system is the cross flow vibration of the modeled pipe. An adequate sampling time of 200 samples per second is adopted in this measurement. In order to ensure that the resonant condition took place, the systems’ vibrating frequency must be equal to the system’s natural frequency. For that purpose, decay test has been performed and by utilizing Fast Fourier Transformation (FFT), the natural frequency of the system is 1.074 Hz and as shown in Fig. 3.
Fig. 3Still water decay test time history and FFT
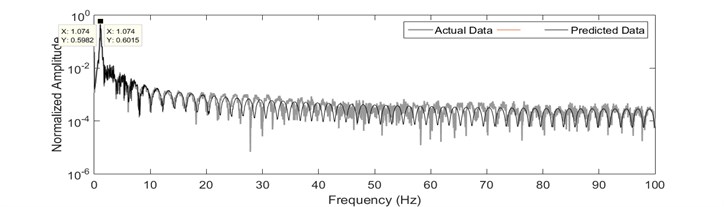
The maximum amplitude of vibration which was produced by its corresponding flow current is measured for identification modeling. Fig. 4(a) and 4(b) show the input and output data for 20 seconds, respectively. The calculated Reynolds number is 15226, where at this condition the vortex is in periodic vortex turbulence stage. Hence, the Strouhal number is taken as 0.20 since the Reynolds number is within ranged of 300 to 2×10⁵. The Fast Fourier Transformation (FFT) of the vibrating system is shown in Fig. 5. It was found that the vibrating frequency is equal to the natural frequency obtained from the decay test, thus indicates that resonant condition was achieved. It is noted that both input and output data consists of 4000 data points and it is separated into two sets of 3600 and 400 data points. The model is trained and tested by using the first and second data sets, respectively.
Fig. 4Data measured from experimental work
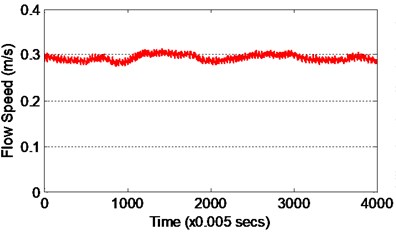
a) Flow speed as input data
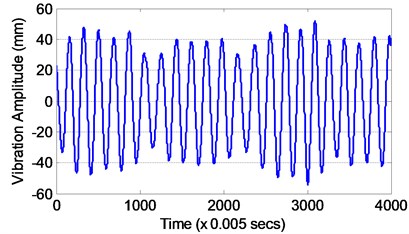
b) Vibration amplitude as output data
Fig. 5Frequency response of output data
3. System identification
The RLS method was utilized in this study in obtaining the ARX model parameters of the dynamic response of flexibly mounted pipe due to vortex induced vibration. The ARX model is commonly used as the model structure to represent the system. The model will be utilized to represent the vortex induced vibration for the flexibly mounted pipe.
3.1. ARX model structure
Due to its simplest form of input and output polynomial model as compared to other models, the ARX model structure is utilized in this study. The system model is similarly given by [14]:
where is the output, is the input, is the random variable white noise, and are the discrete denominator and numerator polynomials, respectively. Multiplying out Eq. (1) with at both sides and substituting Eq. (2) below will give the following Eq. (3):
where and are the denominator and numerator parameters. The in this case will be assumed zero as the value is considerably small. Eq. (3) is then shifted in time steps ahead and giving the following Eq. (4):
For data samples , it can be shown that the Eq. (4) can be written in a matrix form as:
where:
RLS estimator will be employed in estimating the parameters in .
3.2. Recursive least square
Recursive least squares (RLS), which is the extension of least square method could be considered as a simple parametric modeling technique. It is based on the mathematical weighted least square criterion as to provide the best estimation for a set of static data. A set of unknown parameters which consists of numerator and denominator parts need to be estimated during the offline estimation in purpose of providing an accurate model. The RLS algorithm presents the continuous estimate for a set of unknown system parameters and it is one of the examples of an adaptive filtering algorithm. The equation of RLS algorithm is presented as below [15]:
where is the regression vector, is the parameter vector, and is the system output. At each iteration, a new estimation of will be calculated based on recent values of and . The value of , which is a constant in this case is defined as the forgetting factor and it is used to give a higher weight for new measurements of the system. Besides that it helps the algorithm to converge to the global minimum. However, diversion of predicted values of parameters could happen if the becomes smaller.
3.3. Validation test
It is noted that the quality of the model that represents the behavior of the system has to be within the acceptable bounds. Hence, this research utilized the Mean Squared Error (MSE) method, on the prediction of error in investigating the validity of the model. It is important to note that the MSE is commonly used as a tool in the validation test. Basically, the MSE is the value of error determined from the difference between actual output, and the predicted output, of the system [14]:
4. Fuzzy iterative PID-type controller
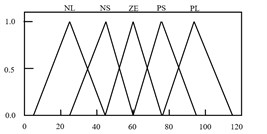
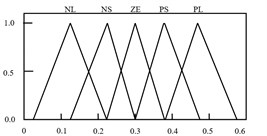
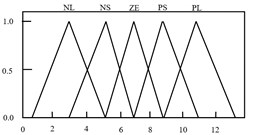
It is noted that the main factors that contribute to the successfulness of attenuation are the proper selection of the proportional (), integral () and derivative () parameters. Conventionally, these parameters are tuned heuristically and by trial and error methods, which is tedious and will lead to control failure as the system response change. Hence, by incorporating Fuzzy with iterative learning algorithm in selecting proper PID parameters, it can enhance the performance of the control system. The Fuzzy Iterative PID controller action depends on the error () and the change of error (). Based on these input, the fuzzy structure will select the best values of , and in order to achieve the highest performance of the system. Trapezoids and symmetrical triangle membership functions with interval of [–0.5 0.5] are selected to represent and . Meanwhile, symmetrical triangle with interval of [0 120], [0 0.6] and [0 13.88] is utilized in representing the, and , respectively. The intervals were chosen based on heuristic approach. Fig. 6 and 7 show the input and output membership functions, respectively.
Fig. 6Membership function for e and de/dt
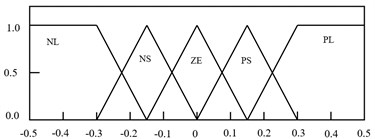
Fig. 7Membership function for output variables of KP, KI and KD
a)
b)
c)
Generally, the rule-base is the set of conditions that need to be followed by the fuzzy system in determining the output of the system based on the given input. It is important to determine a set of appropriate rules in order to enhance the performance of the system. The general form of fuzzy control rule-base was given in the form of:
: if is and is then is , is and is , where, is the fuzzy control condition, is the error of the fuzzy set, 1, 2,…, , is the change of error of the fuzzy control 1, 2,…, .
There are five linguistics variables for both inputs, so for each control parameters (, and ), 25 rules were created as shown in Table 2. Defuzzification is a process that converts the fuzzy set back to the crisp set again. There are various defuzzification techniques available. The minimum (Min) operator was selected as an implication method, and the most popular and standard method of defuzzification process known as centre of gravity (CoG) was chosen.
Table 2Rule-base of Fuzzy PID based controller
Controller parameters F-PID and F-PD | Learning parameter | |||||
NL | NS | ZE | PS | PL | ||
Change of error | NL | NL | NL | NS | NS | ZE |
NS | NL | NL | NS | ZE | PS | |
ZE | NS | NS | ZE | PS | PS | |
PS | NS | ZE | PS | PS | PL | |
PL | ZE | PS | PS | PL | PL | |
In order to enhance the performance of developed Fuzzy PID based controller, iterative learning algorithm (ILA) strategy is incorporated into the control system. The ILA is an intelligent strategy where the performance of any controller will become better as time increases. However, the only requirement is to select the learning parameter of the controller. According to Ahn [16], the PID-type of iterative learning control can be expressed as:
where is input signal, , and are learning parameters, is the system performance error and is the next value of the input signal. At each time step system operates, the input signal and output signal are stored in memory. The learning algorithm evaluates the system performance error as , where and are the desired and actual output of the system, respectively. Based on this error signal, the ILA will compute a new input signal which will be stored for use in the next trial. The next input value is selected in such a way that it will cause the performance error of the system to be reduced. Details can be found in [15].
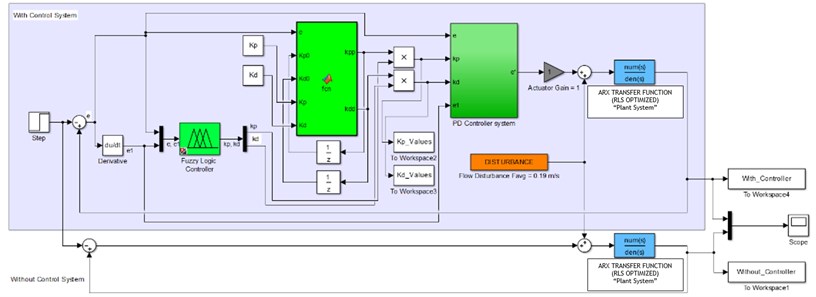
Fig. 8 shows the closed loop Fuzzy Iterative PID controller in SIMULINK interface. Generally, the system consists of a controller and a plant block which the latter is obtained through the system identification process. The iterative learning algorithm was adopted in parallel direction in order to emphasize all the gain values by multiplying its value with the output from fuzzy controller. By implementing this technique, the value of PID parameters could be more precise. During simulation, the controller will store information on parameter gains and use these values as reference in order to compute next parameter gains which are identified by error difference.
Fig. 8SIMULINK diagram for Fuzzy Iterative PD based control system
The iterative algorithm has been incorporated into fuzzy controllers for the purpose of enhancing the performance of vibrating system. This is due to the maximum attenuation required for this vibrating system. The gain values were used as the initial values in these controllers. It is noted that the learning parameters used in this controller were tuned through trial and error method. The learning parameter settings for both controllers are shown in Table 3.
Table 3Fuzzy iterative PID and Fuzzy Iterative PD learning parameters setting
Controller schemes | Learning parameter | Stopping criterion error | ||
Fuzzy Iterative PID | 0.01 | 0.001 | 0.001 | 0.005 |
Fuzzy Iterative PD | 0.01 | – | 0.001 | 0.005 |
5. Results and discussions
5.1. System identification
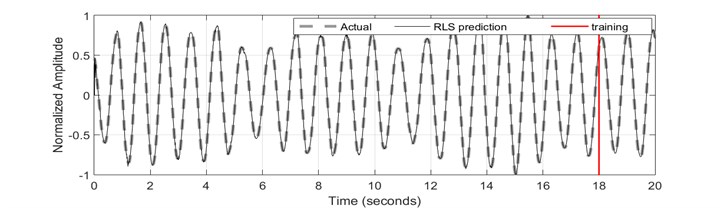
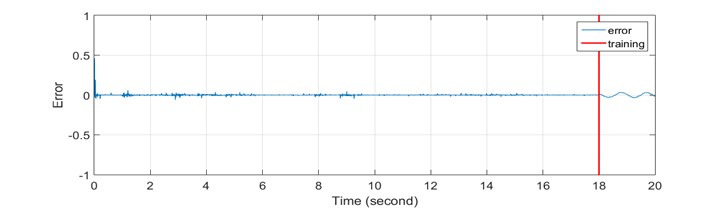
Model order up to 10th is examined in obtaining the finest ARX model parameters in which has the lowest mean squared error values. For identification purpose, as much as 4000 data have been utilized. The data is separated into two categories which are training and testing data. The training data consists as much as 3600 data. Meanwhile, the rest will be utilized as test data. The estimated cylinder response from ARX model and its overall mean squared error with first mode of the vibrating system are plotted in Figs. 9(a), 9(b) and 9(c), respectively. In RLS, there are two parameters that can be varied for model optimization purposes. The parameters are the model order and forgetting factor parameter. The effect of these parameters was studied and the results are tabulated in Tables 4 and 5, respectively. Initially, the model order is varied up to 10th order model system. The lowest mean square error value obtained from tested model order with fixed forgetting factor value of 0.5 is studied. From the analysis, it was found that the lowest MSE is given by the 2nd order model with MSE value of 2.1264×10⁻⁴. The analysis is then continued by examining the effect of forgetting factor parameter towards the 2nd order model system. The forgetting factor is varied from 0.1 until 0.9. The lowest MSE was achieved with model order of 2nd with forgetting factor of 0.1.
Table 4MSE Analysis for RLS estimation at forgetting factor, λ= 0.5
Model order | Mean squared error | Stability | Correlation of error |
2 | 2.1264×10⁻⁴ | Stable | biased |
3 | 2.9427×10⁻⁴ | Stable | biased |
4 | 3.5009×10⁻⁴ | Stable | biased |
5 | 3.9642×10⁻⁴ | Stable | biased |
6 | 4.3891×10⁻⁴ | Stable | biased |
7 | 4.8532×10⁻⁴ | Stable | biased |
8 | 5.2888×10⁻⁴ | Stable | biased |
9 | 5.7299×10⁻⁴ | Stable | biased |
10 | 6.1644×10⁻⁴ | Stable | biased |
Table 5MSE analysis for RLS estimation at varying forgetting factor for 2nd model order
Mean squared error | Stability | Correlation of error | |
0.1 | 1.8921×10⁻⁴ | Stable | biased |
0.2 | 1.9729×10⁻⁴ | Stable | biased |
0.3 | 2.0386×10⁻⁴ | Stable | biased |
0.4 | 2.0788×10⁻⁴ | Stable | biased |
0.5 | 2.1264×10⁻⁴ | Stable | biased |
0.6 | 2.2158×10⁻⁴ | Stable | biased |
0.7 | 2.3442×10⁻⁴ | Stable | biased |
0.8 | 2.5158×10⁻⁴ | Stable | biased |
0.9 | 2.8730×10⁻⁴ | Stable | biased |
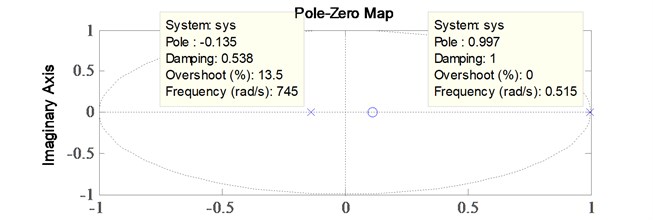
The RLS algorithm has succeeded in achieving the best mean squared error in level of 1.5719×10⁻⁵. For stability analysis, it was found that the poles are located within the unit circle, thus indicating that the system is stable. The pole-zero map is shown in Fig. 10. The convergence of parameters estimation of 2nd order ARX model is shown in Fig. 11 and the discretized model representing the system plant is as follows:
Fig. 9Recursive least square identification results: a) time history response; b) error; c) FFT plot
a)
b)
c)
Fig. 10Recursive least squares pole-zero map
5.2. Fuzzy iterative PID and Fuzzy Iterative PD results
Fig. 12 shows the time history response of the system under Fuzzy Iterative PID and Fuzzy Iterative PD controllers’ action. It could be observed that the controlled system response for both controllers is almost similar to each other, except for the initial part of the controlled system. Minimum overshoot is perceived by Fuzzy Iterative PD controller action upon the controlled system as compared to Fuzzy Iterative PID controller. The attenuation level for both controllers is shown in Fig. 13. It could be remarked that the maximum attenuation is obtained by Fuzzy Iterative PD controller. However, the difference between both controllers in term of attenuation level is not significant. Also, the first mode of vibration for both controllers has shifted to the right side of the first mode of vibration without any controller. The level of attenuation for both controllers upon the system is shown in Table 6. The initial and final gain values for both controllers are shown in Table 7. Meanwhile, the convergence of gain values for both controllers is shown in Fig. 14.
Fig. 11ARX model parameters convergence profile
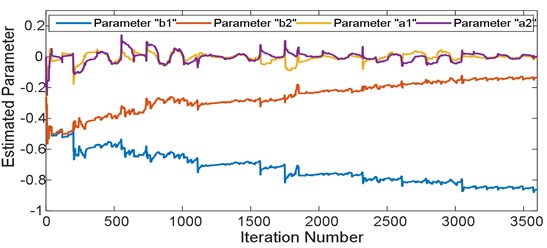
Fig. 12Time history response of vibrating system of uncontrolled and controlled conditions
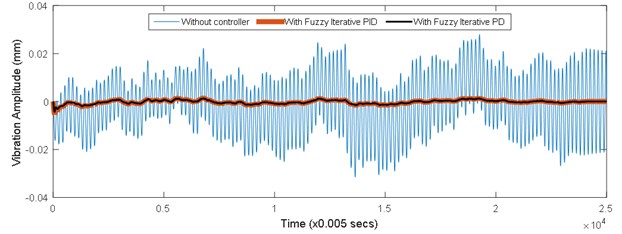
Fig. 13Frequency response of vibrating system of uncontrolled and controlled conditions
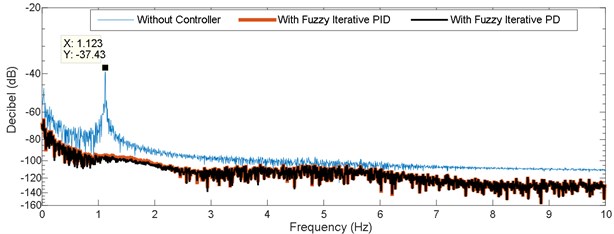
Table 6Fuzzy Iterative PID and Fuzzy Iterative PD attenuation level
Condition | Decibel magnitude | Attenuation level | MSE |
Without controller | –37.43 dB | Reference | 1.3664×10⁻⁴ |
Fuzzy Iterative PID | –103.4 dB | 65.97 dB | 7.6631×10⁻⁷ |
Fuzzy Iterative PD | –104.1 dB | 66.67 dB | 6.2229×10⁻⁷ |
Table 7Fuzzy Iterative PID and Fuzzy Iterative PD based controller gain parameter values
Fuzzy Iterative PID | Fuzzy Iterative PD | ||||
Initial value | Final value | Initial value | Final value | ||
60.00 | 558.00 | 80.00 | 602.90 | ||
0.30 | 2.79 | – | – | ||
6.94 | 64.53 | 9.25 | 69.70 | ||
Fig. 14Gain parameters convergence
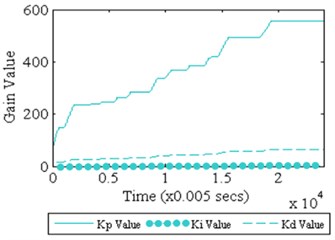
a) Fuzzy Iterative PID
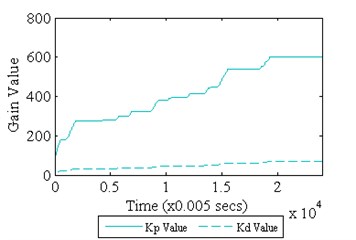
b) Fuzzy Iterative PD
6. Conclusions
The active vibration control of vortex induced vibration via simulation has been conducted in the study. ARX model was chosen as the system structure of the model and RLS method was adopted in determining the parameters of the system structure. MSE analysis was conducted in obtaining the best model order in representing the vortex induced vibration dynamic system. Based on the simulation works, it was found that the Fuzzy Iterative PD controller had succeeded in attenuating the vibration up to 66.67 dB as compared with Fuzzy Iterative PID controller. Also, the system becomes more stable since the amplitude of vibration became lower as time increases with iterative learning effect. Therefore, the results have been encouraging and it indicates that the validity of the technique in suppressing the vibration is possible in real time application. For future work, the designed controller will be tested onto experimental rig with actuator application.
References
-
Griffin O. M., Skop R. A. The vortex-excited resonant vibrations of circular cylinders. Journal of Sound and Vibration, Vol. 31, Issue 2, 1973, p. 235-249.
-
Sarapkaya T. In-Line and Transverse Forces on Cylinders in Oscillatory Flow at High Reynolds Numbers. Offshore Technology Conference-OTC 2533, Houston, Texas, 1976.
-
Gabbai R. D., Benaroya H. An overview of modeling and experiments of vortex-induced vibration of circular cylinders. Journal of Sound and Vibration, Vol. 282, 2005, p. 575-616.
-
Kumar R. A., Sohn C. H., Gowda B. H. L. Passive control of vortex-induced vibrations: an overview. Recent Patents on Mechanical Engineering, Vol. 1, Issue 1, 2008, p. 1-11.
-
Shaharuddin N. M. R., Mat Darus I. Z. System identification of flexibly mounted cylindrical pipe due to vortex induced vibration. Conference Proceeding of IEEE Computers and Informatics, Langkawi, Malaysia, 2013.
-
Baz A., Kim M. Active modal control of vortex-induced vibrations of a flexible cylinder. Journal of Sound and Vibration, Vol. 165, Issue 1, 1993, p. 69-84.
-
Fujisawa N., Kawaji Y., Ikemoto K. Feedback control of vortex shedding from a circular cylinder by rotational oscillations. Journal of Fluids and Structures, Vol. 15, Issue 1, 2001, p. 23-37.
-
Cheng L., Zhou Y., Zhang M. M. Perturbed interaction between vortex shedding and induced vibration. Journal of Fluids and Structures, Vol. 17, Issue 7, 2003, p. 887-901.
-
Zhang M. M., Cheng L., Zhou Y. Closed-loop control of fluid–structure interactions on a flexibly supported cylinder. European Journal of Mechanics – B/Fluids, Vol. 23, Issue 1, 2004, p. 189-197.
-
Cheng L., Zhou Y., Zhang M. M. Controlled vortex-induced vibration on a fix-supported flexible cylinder in cross-flow. Journal of Sound and Vibration, Vol. 292, Issues 1-2, 2006, p. 279-299.
-
How B. V. E., Ge S. S., Choo Y. S. Active control of flexible marine risers. Journal of Sound and Vibration, Vol. 320, Issues 4-5, 2009, p. 758-776.
-
Muddada S., Patnaik B. S. V. An active flow control strategy for the suppression of vortex structures behind a circular cylinder. European Journal of Mechanics – B/Fluids, Vol. 29, Issue 2, 2010, p. 93-104.
-
Shaharuddin N. M. R., Mat Darus I. Z. Experimental study of vortex-induced vibrations of flexibly mounted cylinder in circulating water tunnel. Acta Mechanica, Vol. 226, 2015, p. 3795-3806.
-
Pek Eek, R. T., Mat Darus, I. Z., Sahlan, Samin, P. M., Shaharuddin, N. M. R. Implementation of swarm algorithm in modeling a flexible beam structure. Journal of Vibroengineering, Vol. 18, Issue 8, 2016, p. 4914-4934.
-
Mat Darus I. Z., Tokhi M. O. Parametric and non-parametric identification of a two dimensional flexible structure. Journal of Low Frequency Noise, Vibration and Active Control, Vol. 25, 2006, p. 119-143.
-
Ahn H. S., Chen Y. Q., Moore K. L. Iterative learning control: brief survey and categorization. IEEE Transactions on Systems, Man and Cybernetics Part C: Applications and Reviews, Vol. 37, Issue 6, 2007, p. 1099-1121.
Cited by
About this article

The authors wish to thank the Ministry of Higher Education (MOHE) (Vote No. 4F098) and Universiti Teknologi Malaysia (UTM) for providing the research grant and facilities. This research is supported using UTM Research University grant, Vote No. 02K21 and 15H71.
