Abstract
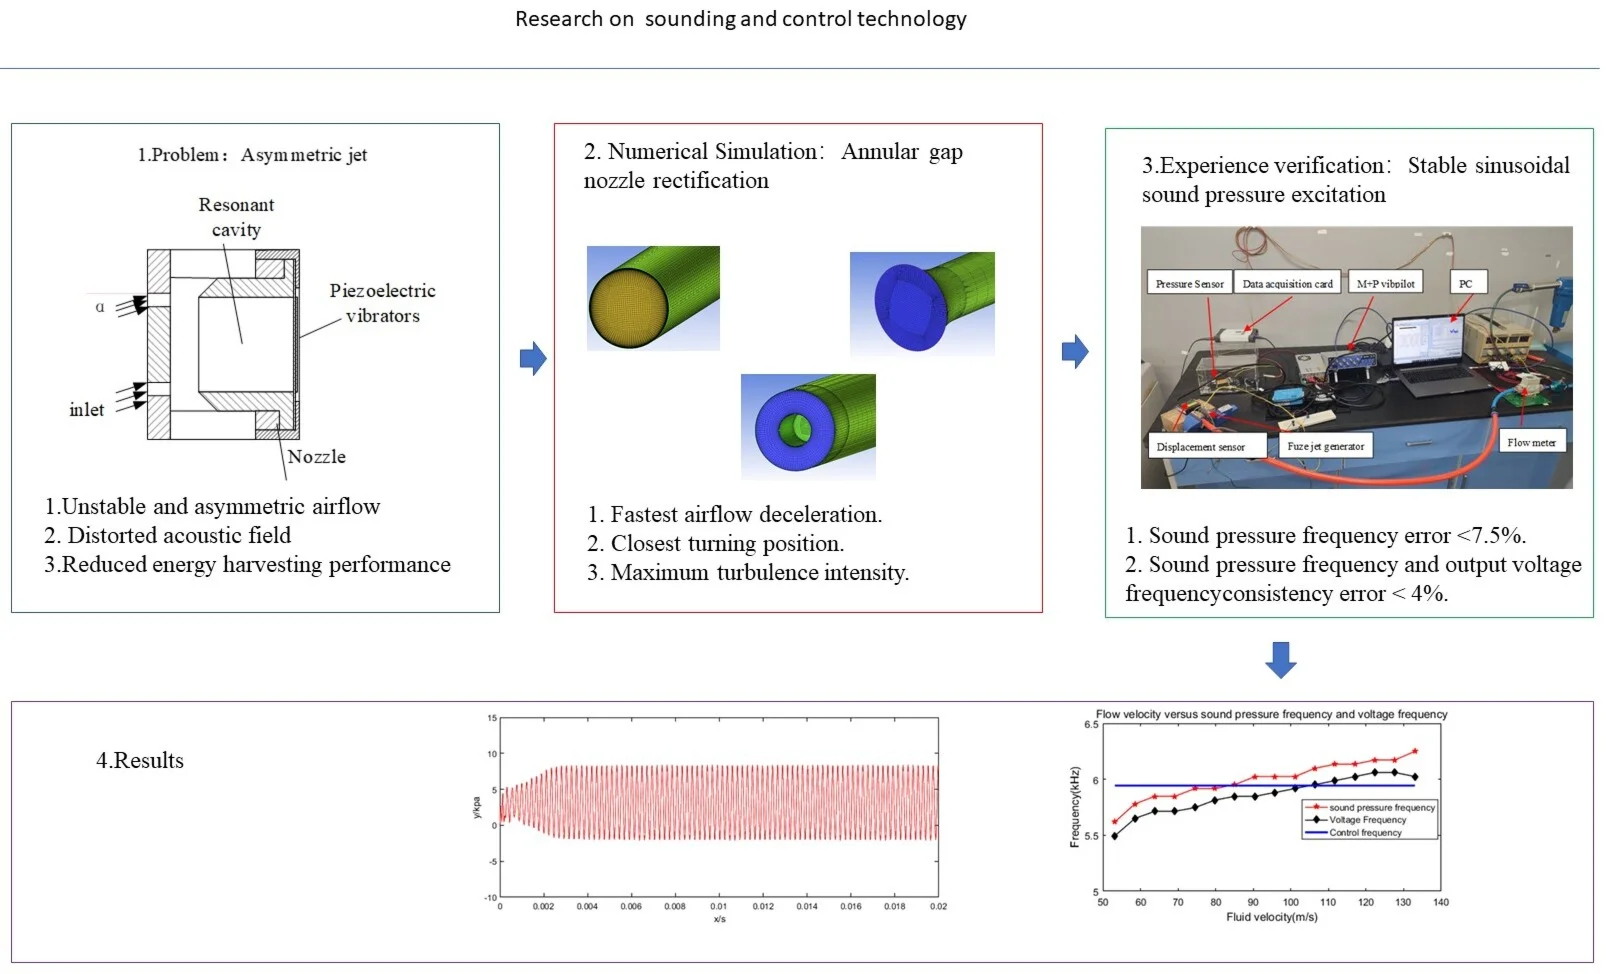
To reveal the response characteristics and rectification mechanism of the nozzle geometry of the airflow acoustic piezoelectric generator (AAPG) to unstable and asymmetric airflow, this paper establishes a control model for modulating the airflow acoustic sounding by studying the structural design scheme for the combination of the fused airflow acoustic piezoelectric generator (AAPG) nozzle-resonant cavity-piezoelectric. Then, the sound pressure curve with sinusoidal vibration is numerically simulated at the bottom of the resonance cavity. Finally, the error between the sound pressure frequency and the theoretical control frequency is less than 7.5 % through experiments, and the portion of the sound pressure frequency and the output voltage frequency are consistent with an error of less than 4 %, verifying that the jet acoustic control model can effectively achieve acoustic control of the asymmetric jet.
Highlights
- To address the miniaturization requirements of fuze power supplies, a non-stable, asymmetric airflow acoustic active control and acoustic-electric conversion control model based on a "nozzle-resonance cavity-piezoelectric vibrator" combined structure was proposed and established.
- An optimization method for nozzles under asymmetric inflow conditions was obtained.
- The acoustic characteristic regulation mechanism of the nozzle-resonant cavity structure was determined.
1. Introduction
Power sources that utilize environmental energy to generate power in fuzing power supplies best meet the criteria for fuse safety design because of their inherent ability to sense environmental information, which can provide environmental signals for fuse safety design. Because airflow has a large degree of continuity in time and space scales, it provides unique convenience for energy collection and is the most accessible environmental energy source in the fuze environment, so it is highly valued by fuze designers.
According to the characteristics of airflow, airflow-excited energy harvesting devices can be categorized into two forms: static-acting and dynamic-acting [1], [2]. The static force acts mainly to cause the rotation of the structure, which is mainly categorized into turbine-type energy harvesting devices and windmill-type energy harvesting devices [3], [4]. Turbine-type energy harvesting devices are difficult to miniaturize because of the complexity of the structure, the need for parts such as coils, blades, and magnets, the high requirements for stability of the mechanical structure and precision of machining, the high cost, the difficulty of maintenance, and the difficulty of miniaturization. The problem of the windmill-type energy harvesting device is that the moving parts will repeatedly hit and rub against each other, which is easy to cause parts failure, and at the same time, each piezoelectric reed needs to be individually leaded, and the wiring is complicated, but the energy conversion efficiency is still very low, and the structure size is not easy to miniaturize. Therefore, the static-acting airflow-excited energy collection device is difficult to meet the miniaturized design requirements of modern fuze power supply, and cannot solve the contradiction between the small volume and high power output of modern fuze power supply. The dynamic action mainly causes vibration of the structure [5], [6], which is mainly categorized into fluid impact type energy harvesting devices, fluid elastic unsteady motion driven energy harvesting devices, and fluid resonance type energy harvesting devices [3]. Fluid impact type energy harvesting device relies on the interaction between gas pressure fluctuation and the elastic restoring force of the piezoelectric cantilever beam to realize the continuous output of electric energy [7-12], [13]. Its main features are a simple structure, can be miniaturized, and low start-up wind speed, but the range of start-up wind speed is small and cannot be applied in the fuzing environment. Fluid elastic unstable motion-driven energy harvesting device is the force accompanied by the movement of the structure over time, and increases the amplitude of oscillation, or due to flow separation and vortex shedding, and the negative damping component of aerodynamic forces, resulting in elongated structure destabilization type of vibration [13-17]. Its vibration process is mostly nonlinear vibration, usually this kind of vibration is easy to cause the destruction of the body structure, the conditions under which the vibration occurs generally require the magnitude and direction of the flow velocity, so this type of energy harvester has poor adaptability to the working bad environment, and also can't satisfy the application in the bad environment of the work of the fuzes. Fluid resonance-type energy harvesting device is when the fluid around the blunt body, will be formed behind the blunt body on both sides of the periodic rotational direction of the opposite direction, the regular arrangement of the double-row vortex, by the nonlinear action, the formation of the Carmen vortex street, at the same time, it will be generated in the blunt body of the alternating pressure, when the blunt body is added to the back of the resonance cavity, the resonance cavity will be captured in the openings vortices shedding and induced within the resonance chamber of the acoustic field oscillations, and ultimately the formation of standing wave resonance [18-21]. The fluid resonance energy collection device has a simple structure, good system shock resistance, high overload strength, high start-up wind speed, and significant improvement in vibration efficiency and output power, which is an ideal solution for designing a new type of fusing power supply. However, at present, only the velocity law between the flow velocity and sound intensity in jet noise can be derived macroscopically, the theory of exploring the vortex sound action mechanism locally is still immature, the research on the characteristics of the excitation source and the excitation mechanism is still in the groping stage, and it is still difficult to theoretically explain and describe the description, excitation, and control mechanism of the airflow and hydrodynamic sound source, and there is no theoretical basis and experience in the design of the engineering structure yet. Therefore, from the local exploration of hydrodynamic acoustic source excitation generated by the acoustic vibration coupling characteristics of the control theory research, can provide the basic theory and method for the design of the fluid resonance type energy harvester, to promote for the flow - solid - acoustic coupling multi-field resonance basic theory research progress.
In this paper, on the basis of the previous research on airflow acoustic piezoelectric generator, we study the response characteristics and rectification mechanism of the nozzle geometric properties to the unstable and asymmetric airflow, analyze its acoustic mechanism, establish the modulated airflow acoustic control model, and finally, through the research of its power generating performance, we reveal the vibration phenomenon of the acoustic wave in the resonance cavity, and verify the consistency of the acoustic pressure frequency at the bottom of the resonance cavity, the vibration frequency of piezoelectric vibrator, and the frequency of the output voltage by experiments, which will provide the theoretical basis for the design of the structural parameters of the acoustic piezoelectric generator for airflow acoustic application in the engineering.
2. Theory of jet sounding and control
2.1. Modeling of jet sounding and control
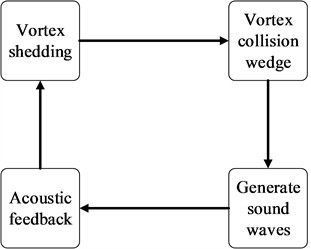
The sound that occurs when a high-velocity fluid flows into a sharp solid is referred to as the edge tone. The formation process of edge tone can be described as follows: a high-speed jet flowing through the static fluid, the boundary of the jet due to high-speed flow and static medium contact, constantly generate vortices, and to the static fluid to push, the jet continues to become wider, a part of the vortex along with the jet forward, encountered edge-ribbed reflections, the reflection of the shockwave back to the nozzle, to stimulate more vortexes. The process of producing edge tone is shown in Fig. 1.
Fig. 1The process of generating edge tone
It has been found that the frequency of the edge tone is proportional to the flow velocity of the fluid and is also related to the distance from the jet outlet to the sharp object according to the empirical Eq. (1):
where represents the frequency of edge sound, represents the velocity of the jet, represents the distance from the nozzle to the wedge, and is the Mach number.
The frequency capture phenomenon is the synchronization effect of the cavity acoustic mode frequency and the vortex shedding frequency caused by the turbulent jet, the study of the cavity acoustic mode and the initial conditions of the jet sounding provides the possibility of the control of the jet sounding, the frequency of the acoustic modes in the cavity is obtained based on the propagation of acoustic waves in the cavity. The acoustic wave equation is shown in Eq. (2):
Converting the three-dimensional acoustic wave equation into a one-dimensional standing wave equation yields Eq. (3) and Eq. (4):
For a cavity with one end open and one end closed, the acoustic modal expression in the resonant cavity can be obtained by substituting according to the condition at the open end, condition , and the condition at the closed end, :
According to the frequency correction research of the short resonant cavity, it is found that the diameter of the resonant cavity also affects the magnitude of the resonant frequency. Through experimental analysis, the frequency correction formula is obtained [16], as shown in Eq. (6):
According to the frequency capture principle, when the frequency of the sound produced by the jet matches the acoustic modal frequency of the resonant cavity, the jet sound will enter a state of increasing vibration with the resonant cavity. At this point, the sound pressure significantly increases and reaches peak resonance. Therefore, if the acoustic modal frequency of the resonant cavity is known, the frequency range of the increasing vibration can be determined. The relationship between the structural parameters and the flow velocity during acoustic resonance can be expressed as shown in Eq. (7):
So the nozzle-resonant cavity structure can be designed to produce acoustic resonance conditions can be referred to as Eq. (7). The right side of the equation is the structural parameters of the nozzle resonant cavity, and the left side of the equation is the flow rate of the jet.
2.2. Acousto-electric transducer vibration modeling
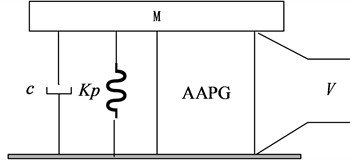
The acousto-electric conversion model for airflow acoustic piezoelectric power generation is shown in Fig. 2. The upper end of the piezoelectric element is solidly connected to the equivalent mass block and the lower face is solidly connected to the cover plate.
Fig. 2Electromechanical coupling equivalent model
The equation of vibration of a piezoelectric oscillator can be expressed as Eq. (8):
where is the excitation force, ; is the vibrational displacement of the piezoelectric oscillator; is the equivalent damping coefficient; is the equivalent stiffness of the mechanical system; and is the piezoelectric return force.
Piezoelectric vibrator is a peripheral fixed installation, parallel to the direction of the electric field of the telescopic vibration mode. Let the surface area of the piezoelectric sheet be , the thickness be , the output voltage be , and the output current be . According to the piezoelectric equations of the fourth type, the macroscopic relationship between the mechanical and electrical quantities is obtained as Eq. (9) and Eq. (10):
According to the initial conditions for the vibration of the piezoelectric oscillator: , , multiply with both sides of Eq. (8), and then perform [0, ] for the definite integral. can be obtained:
The right side of Eq. (11) is equal to the work done by the excitation force , and the left side of the equation is equal to the kinetic energy of the system, the mechanical loss, the elastic potential energy, and the generated electrical energy, so it satisfies the energy conservation theorem.
The fourth term on the left in Eq. (11) is the electrical energy converted by the acousto-electric transducer, denoted :
When the circuit is open, because 0, the generated electrical energy is equal to the stored electrical energy of the static clamping capacitance of the piezoelectric oscillator. At this time , which indicates that the larger the open-circuit voltage is, the larger the static capacitance of the piezoelectric oscillator is, and the larger the generator’s ability to generate electrical energy is.
The full solution of Eq. (11) in the open-circuit state, where is the general solution and is the special solution, and their expressions are Eq. (13) and Eq. (14):
where , , , , , and are constants, and is the intrinsic frequency of the acousto-electric transducer.
is only a transient term, which indicates that the transient vibration of the system decays exponentially and will disappear soon. In the beginning, the amplitude of the system gradually increases, and when disappears, the system will vibrate with equal amplitude according to .
Thus, when the piezoelectric oscillator is in the open circuit state, the relationship between mechanical and electrical quantities can be expressed as Eq. (15), Eq. (16) and Eq. (17):
Therefore, it can be concluded that the acoustic pressure excitation, the vibrational displacement of the piezoelectric oscillator, and the voltage frequency are the same, with a slight difference in phase.
3. Simulation of acoustic resonance characteristics
3.1. Nozzle selection
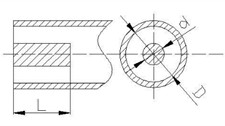
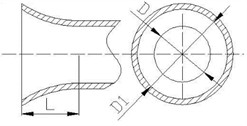
Three kinds of fuzed air inlets, namely, equal-section straight tube port, ring gap port, and variable-section flared port, are studied and numerically simulated under the same conditions for the three air inlets. The structural models of the three inlets are shown in Fig. 3, and the geometrical parameters are shown in Table 1.
Fig. 3Three inlet port structures
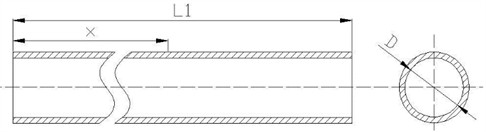
a) Isotropic straight nozzle
b) Annular gap nozzle
c) Flared nozzle
Table 1Geometric parameters of the three intakes
Overall length (mm) | Diameter of straight nozzle (mm) | Nozzle length (mm) | Blocking diameter (mm) | Diameter of horn nozzle (mm) |
200 | 10 | 5 | 6 | 16 |
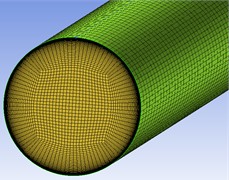
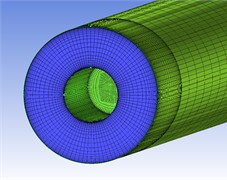
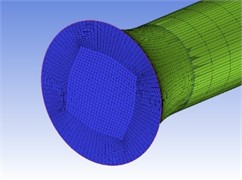
The regions near the wall and near the outflow of the inlet are encrypted separately, and the computational grids corresponding to the regions near the isotropic straight inlet, isotropic annular gap inlet, and variable cross-section flared inlet are shown in Fig. 4(a) to 4(c), respectively.
Fig. 4Three computational grids for the area near the air inlet
a) Isotropic straight nozzle
b) Annular gap nozzle
c) Flared nozzle
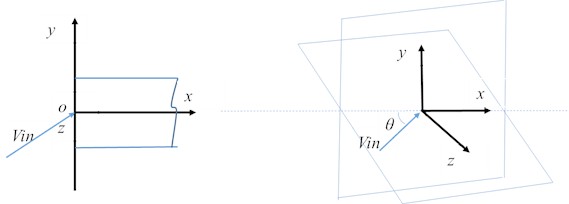
When the projectile is flying in the air, the incoming airflow is generally not parallel to the intake duct, so the simulation of an asymmetric jet is carried out by setting the incoming airflow at a certain angle to the inlet axis. The Cartesian coordinate origin is set to be the center point of the air inlet, and the -axis coincides with the axis of the circular tube air inlet, specifying that the incoming fluid velocity is in the -plane and the angle with the -axis is 45°, as shown in Fig. 5.
Fig. 5Schematic diagram of numerically simulated incoming flow velocity
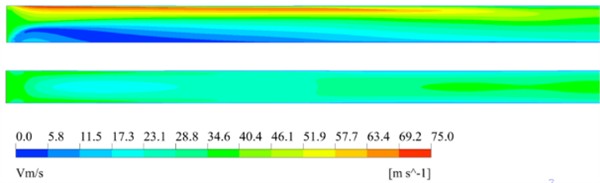
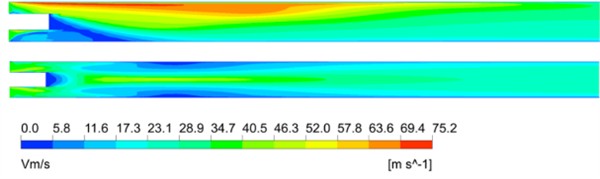
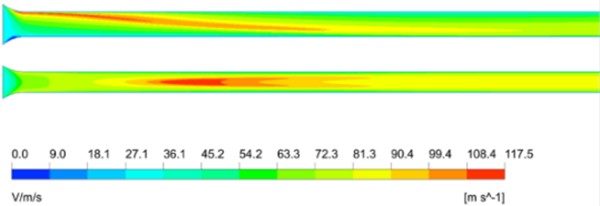
After numerical simulation, the velocity clouds on the three inlet nozzles cross section and cross section are obtained, as shown in Fig. 6.
Fig. 6Velocity clouds of the three nozzles in oxy cross section and oxz cross section
a) Isotropic straight nozzle
b) Annular gap nozzle
c) Flared nozzle
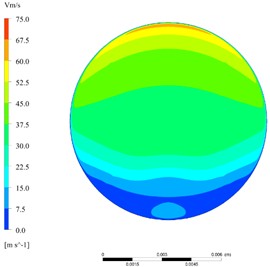
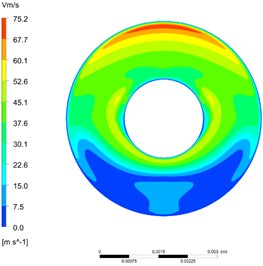
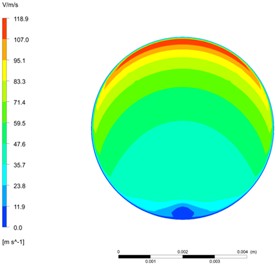
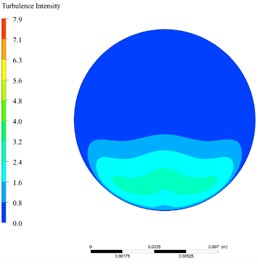
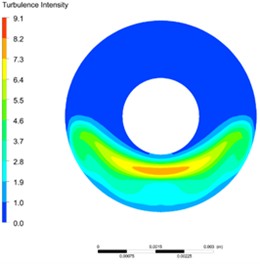
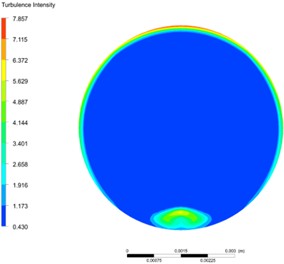
Fig. 7(a-c). represent the velocity distribution of the internal flow field at the cross section at the halfway point of the nozzle, i.e., at 2.5 mm, for the three different nozzles, and Fig. 8(a-c). represent the turbulence degree distribution.
Based on the above graph of data simulation results, the following conclusions can be obtained:
(1) The fastest decrease in airflow velocity at the annular gap nozzle. After the asymmetric fluid enters the three types of nozzles, the airflow velocity decreases with the increase of distance, with the slowest decrease in airflow velocity at the flared nozzle and the fastest decrease in airflow velocity at the annular gap nozzle.
(2) The turning of the airflow in the annular gap nozzle is fast. The center blockage of the annular gap nozzle will cause local vortex phenomenon, the most obvious airflow deceleration, the turning position is close to the inlet, the rectification effect on the airflow is more obvious, and the turning position is not sensitive to the axial length.
(3) The turbulence degree is maximum for the annular gap nozzle. At the halfway point of the inlet duct for all three types of nozzles, i.e., at 2.5 mm, the velocity distribution of the fluid and the degree of turbulence show an inverse correlation, with the degree of turbulence showing a decreasing trend from the lower wall to the upper wall of the duct. The flared nozzle has the highest velocity and the lowest turbulence, while the annular gap nozzle has the intermediate velocity but the highest turbulence.
In summary, under asymmetric inflow conditions, the annular gap nozzle has the most obvious rectification effect, and the turning position is the closest to the inlet; the flare nozzle enables the airflow to enter the pipe more smoothly, and the turbulence of the internal flow field inside the pipe is the smallest and the velocity is the largest, which has a poorer rectification effect. Based on the miniaturization design requirement of the fuzed power supply, it is desired that the inlet port can rectify the incoming flow faster, therefore, the annular gap nozzle is most suitable as the inlet port of the airflow acoustic piezoelectric generator.
Fig. 7Velocity distribution of the three nozzles at the halfway point of the nozzle
a) Isotropic straight nozzle
b) Annular gap nozzle
c) Flared nozzle
Fig. 8Turbulence degree distribution at the nozzle halfway point for three types of nozzles
a) Isotropic straight nozzle
b) Annular gap nozzle
c) Flared nozzle
3.2. Acoustic characterization of nozzle-resonance cavity structures
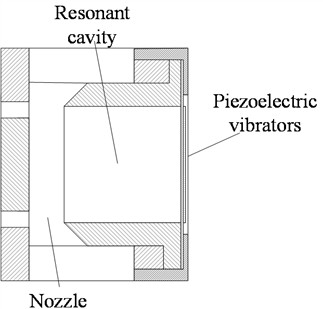
The structural schematic of the fuzed airflow acoustic piezoelectric generator nozzle-resonant cavity-piezoelectric oscillator combination is shown in Fig. 9.
Fig. 9Structure of air flow acoustic piezoelectric generator
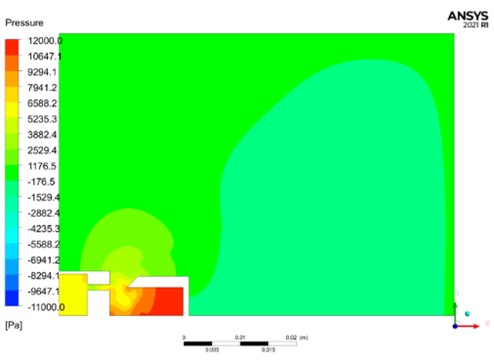
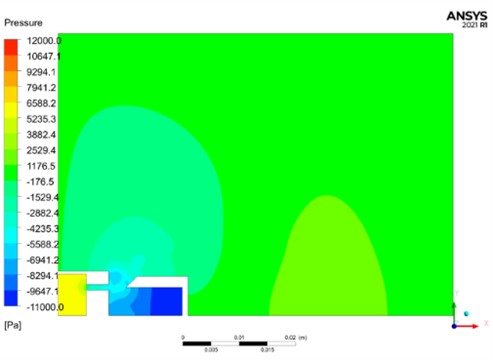
In order to observe the standing wave phenomenon in the resonant cavity, we numerically simulated the pressure change of the flow field in the resonance cavity of the airflow acoustic piezoelectric generator in one cycle when the pressure of the air inlet is 6 kPa, and the cloud diagram of the pressure change is shown in Fig. 10.
Fig. 10Variation of pressure cloud of flow field in the resonance cavity
a)1/4
b)3/4
The pressure cloud can be seen that: at [–1/4, 1/4], the gas inside the resonance cavity compresses, and the pressure inside the resonance cavity reaches the maximum value when / = 1/4, and at /[1/4, 3/4], the gas inside the resonance cavity expands, and the pressure inside the resonance cavity reaches the minimum value when 3/4. When the gas continuously undergoes periodic compression and expansion, a stable standing wave is formed in the resonant cavity.
By detecting the pressure change at the bottom of the resonance cavity, the sound pressure curve at the bottom of the resonance cavity is simulated as shown in Fig. 11.
Setting different initial conditions of inlet pressure, the frequency and amplitude of sound pressure detected at the bottom of the resonant cavity are shown in Table 2.
Based on Fig. 10, Fig. 11 and Table 2, the following conclusions can be drawn:
(1) The nozzle-resonant cavity structure can form a stable standing wave at the bottom of the resonant cavity. Fig. 10 reveals the process of compression and expansion of the gas in the resonance cavity in one cycle.
(2) The acoustic pressure signal at the bottom of the resonant cavity is a string vibration signal. Fig. 11 indicates that a stable standing wave resonance is formed within the nozzle-resonant cavity structure as time changes, and the vibration signal is a stable sinusoidal signal.
(3) Stable sound pressure frequency. According to Table 2, the larger the air pressure at the air inlet, the stronger the sound pressure at the bottom of the resonance cavity, but the sound pressure frequency is almost constant.
In summary, under asymmetric inflow conditions, the airflow acoustic piezoelectric generator can generate acoustic pressure signals under certain inflow conditions, and a stable acoustic pressure profile can be monitored at the bottom of the cavity, and the acoustic pressure frequency is near the acoustic modal frequency of the resonant cavity, which means that acoustic control of the asymmetric jet is realized.
Fig. 11Sound pressure curve at the bottom of the resonance cavity
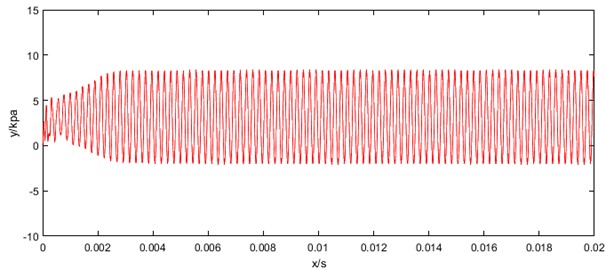
Table 2Amplitude and frequency of sound pressure generated by different inlet pressures
Inlet pressure (kPa) | Flow rates (m/s) | Amplitude (kPa) | Frequency (Hz) |
3 | 70 | 4.39 | 4172 |
4 | 80 | 6.41 | 4215 |
5 | 90 | 9.01 | 4252 |
6 | 100 | 11.09 | 4290 |
8 | 110 | 15.9 | 4350 |
9 | 120 | 17.18 | 4381 |
11 | 130 | 18.62 | 4453 |
13 | 140 | 19.77 | 4494 |
15 | 150 | 20.24 | 4575 |
17 | 160 | 14.22 | 4603 |
3.3. Inflow angle impact analysis
The inflow angle 0°, 20°, 30°, 45°, 60°, 70°, 80° is set to study the effect of different inflow angles on the excitation force. Fig. 12 shows the frequency spectrum of the sound pressure at the bottom of the resonance chamber at different inlet angles when the flow rate is 125 m/s. Table 3 shows the frequency values of the sound pressure at the bottom of the resonance chamber obtained by simulation at different angles.
Summarizing the above we can draw the following conclusions: The nozzle-resonant cavity structure of the airflow acoustic piezoelectric generator is capable of rectifying asymmetric jets. As shown in Fig. 12 and Table 3, the acoustic pressure frequency is unaffected by the angle of attack and produces a frequency-stable acoustic pressure signal at the bottom of the cavity, indicating that the nozzle-resonant cavity structure of the airflow-acoustic piezoelectric generator is capable of rectifying the asymmetric jet.
Fig. 12Spectrum of sound pressure at different angles
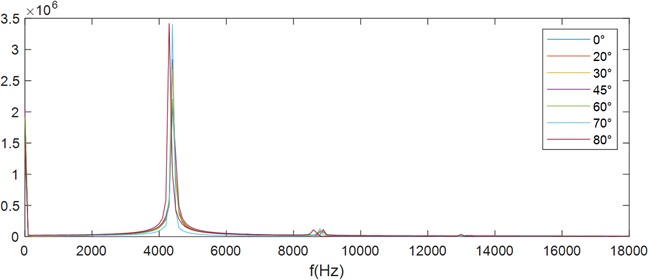
Table 3Frequency values for different inlet angles
(m/s) | (°) | ||||||
0 | 20 | 30 | 45 | 60 | 70 | 80 | |
110 | 4.350 | 4.350 | 4.350 | 4.350 | 4.350 | 4.350 | 4.299 |
125 | 4.394 | 4.394 | 4.394 | 4.394 | 4.394 | 4.394 | 4.296 |
150 | 4.603 | 4.603 | 4.603 | 4.603 | 4.603 | 4.603 | 4.450 |
4. Acoustic frequency verification test of nozzle-resonance cavity structure
The experimental prototype of the airflow acoustic piezoelectric generator is fabricated according to the simulation parameters in Section 2.2. Fig. 13 shows a physical diagram of an airflow acoustic piezoelectric generator, where denotes the annular gap dimension, denotes the standoff distance, and denotes the resonance cavity length.
Fig. 13Experimental prototype of airflow acoustic piezoelectric generator [21]
![Experimental prototype of airflow acoustic piezoelectric generator [21]](https://static-01.extrica.com/articles/25246/25246-img24.jpg)
Fig. 14 shows the block diagram of the measurement experiment system, which simulates the velocity environment of the nozzle-resonant cavity structure by an air compressor, and the equipment system includes the ambient airflow simulation, the inlet modulation mechanism, the acoustic-electrical transducer mechanism, the pressure test system, and the data acquisition system.
Fig. 14Block diagram of the measurement experiment system
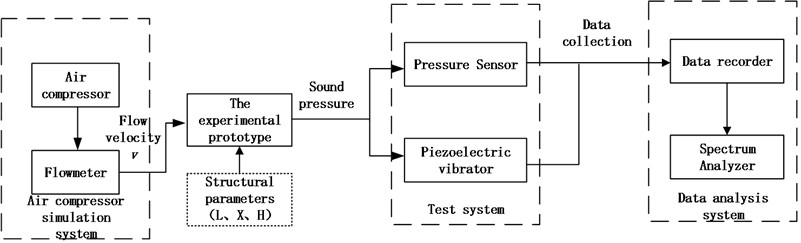
Fig. 15 shows the physical diagram of the measurement experiment system, the pulsation pressure sensor is mainly used to measure the acoustic pressure of acoustic wave at the bottom of the resonance cavity, and the data acquisition card mainly collects the voltage signal of the pulsation pressure sensor and the voltage signal output from the generator.
Fig. 15Physical diagram of the measurement experiment system [16]
![Physical diagram of the measurement experiment system [16]](https://static-01.extrica.com/articles/25246/25246-img26.jpg)
When the structural parameters used in the experiment are 10 mm, 3 mm, and 1 mm, the airflow simulation system is employed to simulate the airflow velocity for simulation experiments. The amplitude and frequency of sound pressure and voltage at different flow rates are shown in Table 4.
Table 4Variation of sound pressure and open circuit voltage with flow velocity
(m/s) | Flow rate (L/min) | Sound pressure frequency (kHz) | Voltage frequency (kHz) | Sound pressure amplitude (kPa) | Voltage amplitude (V) |
53.19 | 100 | 5.62 | 5.495 | 9.46 | 5.298 |
58.51 | 110 | 5.78 | 5.65 | 13.24 | 12.603 |
63.83 | 120 | 5.848 | 5.714 | 14.76 | 13.841 |
69.15 | 130 | 5.848 | 5.714 | 18 | 16.545 |
74.47 | 140 | 5.917 | 5.747 | 20 | 18.847 |
79.79 | 150 | 5.917 | 5.814 | 26.96 | 19.902 |
85.11 | 160 | 5.952 | 5.848 | 30.44 | 20.833 |
90.43 | 170 | 6.024 | 5.848 | 34.16 | 22.01 |
95.74 | 180 | 6.024 | 5.882 | 35.94 | 22.459 |
101.06 | 190 | 6.024 | 5.917 | 39.8 | 24.487 |
106.38 | 200 | 6.098 | 5.952 | 42.52 | 25.229 |
111.70 | 210 | 6.135 | 5.988 | 46.82 | 26.728 |
117.02 | 220 | 6.135 | 6.024 | 48.34 | 27.617 |
122.34 | 230 | 6.173 | 6.061 | 49.76 | 28.293 |
127.66 | 240 | 6.173 | 6.061 | 52.54 | 28.619 |
132.98 | 250 | 6.25 | 6.024 | 54.64 | 28.359 |
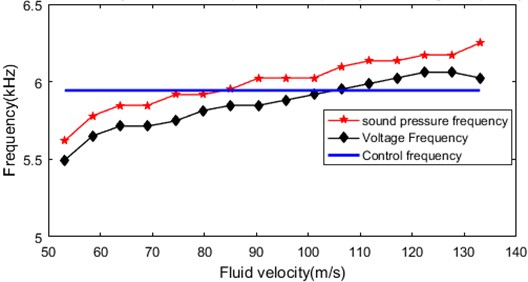
According to Table 2 the sound pressure frequency and voltage frequency are plotted against the control frequency as shown in Fig. 16. Where the control frequency according to Eq. (6), substitution can be obtained: control frequency 5.944 kHz.
From Fig. 16, it can be seen that with the increase of flow velocity, the frequency of acoustic pressure in the resonant cavity gradually increases, while the frequency of the open-circuit voltage of the generator is also gradually increasing, but slightly smaller than the frequency of the acoustic pressure, but the error range is within 4 %, which can be approximated that the frequency of the acoustic pressure is the same as that of the voltage, and it is also found that the frequency of the airflow acoustic piezoelectric generator generating voltage after the frequency of the voltage is always within 7.5 % of the control frequency, which indicates that the nozzle- resonant cavity mechanism achieves acoustic control of the asymmetric incoming flow.
Fig. 16Flow rate versus sound pressure frequency and voltage frequency
5. Conclusions
Through the research of asymmetric jet sound generation and control technology, with the application background of airflow acoustic piezoelectric generator, numerical simulation of different nozzles is carried out through the theory of jet sound generation and control, and the nozzles with fast turning of airflow are selected. Then, the acoustic characteristics of the nozzle-resonant cavity structure under asymmetric inflow are numerically simulated. Finally, it is verified by the air compressor blowing test, and the results show that the frequency after the generator generates voltage is always within 7.5 % of the control frequency, which indicates that the nozzle-resonant cavity mechanism realizes the acoustic control of the unstable asymmetric inlet flow.
The innovations of this paper are as follows:
1) Establishment of an asymmetric jet acoustic control model: To meet the miniaturization requirements of fuze power supplies, a design scheme incorporating a combined nozzle-resonant cavity-piezoelectric vibrator structure for the airflow acoustic piezoelectric generator (AAPG) is proposed. A control model that modulates airflow acoustic sound generation via the nozzle-resonant cavity structure is established, enabling active acoustic control of unstable and asymmetric airflow.
2) Nozzle optimization method under asymmetric inflow conditions: Three types of inlet structures – isotropic straight tube nozzle, annular gap nozzle, and variable-section flared nozzle – are compared and analyzed. Results show that the annular gap nozzle exhibits the most significant rectification effect under asymmetric inflow, achieving the fastest airflow deceleration, the turning position closest to the inlet, and the maximum turbulence intensity. Furthermore, the turning position is found to be insensitive to axial length, providing an optimization basis for the inlet design of miniaturized fuze power supplies.
3) Acoustic characteristic regulation mechanism of the nozzle-resonant cavity structure: Numerical simulations reveal the process by which periodic gas compression and expansion within the resonant cavity form a stable standing wave. It is found that the sound pressure signal at the bottom of the resonant cavity is a stable sinusoidal oscillatory signal, and the sound pressure frequency remains nearly unaffected by changes in inlet pressure. Under different inflow angles (0°-80°), the sound pressure frequency remains stable, demonstrating that the proposed structure can effectively rectify asymmetric jets.
References
-
K. A. Omoteso, R. Marjani, O. Ozioko, O. Bagdasar, T. O. Roy-Layinde, and U. H. Diala, “A study of the response dynamics of a Helmholtz resonator and its application in acoustic energy harvesting,” Results in Engineering, Vol. 27, p. 106470, Sep. 2025, https://doi.org/10.1016/j.rineng.2025.106470
-
Z. Li, Y. Zhang, L. Yang, and H. Chen, “Overview of piezoelectric energy harvester based on wind-induced vibration effect,” Journal of Vibroengineering, Vol. 26, No. 3, pp. 615–628, May 2024, https://doi.org/10.21595/jve.2023.23421
-
G. P. Araujo, J. A. I. Da Silva, and F. D. Marques, “Energy harvesting and passive mitigation from flutter via rotary nonlinear energy sink,” Journal of Sound and Vibration, Vol. 603, p. 118953, May 2025, https://doi.org/10.1016/j.jsv.2025.118953
-
A. Mohammadi, “Vibration-based energy harvesting for sensors,” in Encyclopedia of Sensors and Biosensors, Vol. 3, Elsevier, 2023, pp. 345–351, https://doi.org/10.1016/b978-0-12-822548-6.00071-6
-
N. Nemani, S. Preidikman, and B. Balachandran, “Coupled piezoelastic airfoil oscillators: nonlinear oscillations,” Journal of Sound and Vibration, Vol. 618, p. 119226, Dec. 2025, https://doi.org/10.1016/j.jsv.2025.119226
-
S. Chen and L. Zhao, “A quasi-zero stiffness two degree-of-freedom nonlinear galloping oscillator for ultra-low wind speed aeroelastic energy harvesting,” Applied Energy, Vol. 331, p. 120423, Feb. 2023, https://doi.org/10.1016/j.apenergy.2022.120423
-
T. Yamada, H. Asanuma, Y. Hara, and A. Erturk, “High-fidelity analysis and experiments of a wireless sensor node with a built-in supercapacitor powered by piezoelectric vibration energy harvesting,” Mechanical Systems and Signal Processing, Vol. 224, p. 112147, 2025, https://doi.org/10.1016/j.ymssp.2024.112147
-
K.-J. Ma, T. Tan, F.-R. Liu, L.-C. Zhao, W.-H. Liao, and W.-M. Zhang, “Acoustic energy harvesting enhanced by locally resonant metamaterials,” Smart Materials and Structures, Vol. 29, No. 7, p. 075025, 2020, https://doi.org/10.1088/1361-665x/ab8fcc
-
C. R. Santos, M. R. Hajj, and F. D. Marques, “Structural nonlinearities influence on the energy harvesting from stall-induced oscillations,” in AIAA/ASCE/AHS/ASC Structures, Structural Dynamics, and Materials Conference, Vol. 25, No. 14, pp. 1991–2007, 2018, https://doi.org/10.2514/6.2018-0464
-
T. Deng, L. Zhao, and F. Jin, “Trampoline metamaterial coupled with Helmholtz resonator for enhanced acoustic piezoelectric energy harvesting,” Applied Mathematical Modelling, Vol. 144, p. 116109, Aug. 2025, https://doi.org/10.1016/j.apm.2025.116109
-
L. Dong et al., “Vortex-flutter internal resonance: a new mechanism for wind energy harvesting,” Nano Energy, Vol. 144, p. 111339, Nov. 2025, https://doi.org/10.1016/j.nanoen.2025.111339
-
M. Chehreghani, I. Gholami, A. K. Misra, and M. P. Païdoussis, “Fluid-elastic instability of inverted cantilevered cylinders in axial flow,” Journal of Fluids and Structures, Vol. 115, p. 103778, 2022, https://doi.org/10.1016/j.jfluidstructs.2022.103778
-
S. Sabzpoushan and P. Woias, “Electret-based energy harvesters: a review,” Nano Energy, Vol. 131, p. 110167, Dec. 2024, https://doi.org/10.1016/j.nanoen.2024.110167
-
J. Pan, X. Zhang, Y. Cheng, J. Zhang, and W. Qin, “Harvesting both wind energy and vibration energy by a zigzag structure with hybrid magnetic and piezoelectric effects,” Mechanical Systems and Signal Processing, Vol. 224, p. 112066, Feb. 2025, https://doi.org/10.1016/j.ymssp.2024.112066
-
S. Farsad, S. M. Parpanchi, and M. Rezaei, “Experimental study of vortex shedding phenomenon induced by various bluff body geometries for use in vortex flowmeters,” European Journal of Mechanics – B/Fluids, Vol. 111, pp. 188–200, May 2025, https://doi.org/10.1016/j.euromechflu.2025.01.007
-
Z. Li, J. Li, and H. Chen, “Experimental research on excitation condition and performance of airflow-induced acoustic piezoelectric generator,” Micromachines, Vol. 11, No. 10, p. 913, Sep. 2020, https://doi.org/10.3390/mi11100913
-
X. Xue, H. Xiang, Y. Ci, and J. Wang, “A sustainable galloping piezoelectric energy harvesting wind barrier for power generation on railway bridges,” Energy, Vol. 320, p. 135135, Apr. 2025, https://doi.org/10.1016/j.energy.2025.135135
-
P. Biswal, S. K. Kar, and B. Mukherjee, “Performance improvement of low frequency piezoelectric energy harvester incorporating holes with an in-house experimental set-up,” Meccanica, Vol. 56, No. 1, pp. 59–72, Jan. 2021, https://doi.org/10.1007/s11012-020-01279-y
-
M. Zhou, Y. Fu, B. Wang, and M. S. H. Al-Furjan, “Vibration analysis of a longitudinal polarized piezoelectric tubular energy harvester,” Applied Acoustics, Vol. 146, pp. 118–133, Mar. 2019, https://doi.org/10.1016/j.apacoust.2018.11.016
-
Y. Yuan, H. Wang, C. Yang, B. Li, W. Zhu, and J. Gui, “A flow-induced vibration energy harvester based on bioinspired shell surface bluff body,” European Journal of Mechanics – B/Fluids, Vol. 114, p. 204314, Nov. 2025, https://doi.org/10.1016/j.euromechflu.2025.204314
-
Z. Li, J. Li, and H. Chen, “Sensitive parameters of dynamic excitation on fuze airflow-induced acoustic generator,” Micromachines, Vol. 12, No. 9, p. 1033, Aug. 2021, https://doi.org/10.3390/mi12091033
About this article

The research is financially supported by the Jiangsu College “Qing Lan Project” of China the Jiangsu College Natural Science Foundation of China, the Changzhou Applied Basic Research Plan of China (CJ20200010), and Postgraduate Research and Practice Innovation Program of Jiangsu Province (KYCX21-0263).
The datasets generated during and/or analyzed during the current study are available from the corresponding author on reasonable request.
Zhipeng Li: writing-review and editing, supervision, formal analysis, conceptualization. Zeqian wang: writing-original draft preparation, validation, software, methodology, investigation, conceptualization. Jianan Zhang: writing-original draft preparation, software. Liang Zhao: conceptualization, software, formal analysis. Jianan Zhang: writing-original draft preparation, validation. Hejuan Chen: conceptualization, software.
The authors declare that they have no conflict of interest.

