Abstract
To optimize the welding process for dissimilar metals, this study explores the influence of defocus amount on the microstructure and properties of laser-welded joints between Q235 and 304 stainless steel. Welding experiments were performed using an EFE-LWM-1500 laser welding machine at a fixed laser power of 1200 W with five defocus amounts: –10 mm, –5 mm, 0 mm, +5 mm, and +10 mm. The welded joints were characterized by optical microscopy, X-ray diffraction (XRD), universal tensile testing, scanning electron microscopy (SEM), and electrochemical workstation to analyze the microstructure, phase composition, tensile strength, fracture morphology, and corrosion resistance. Metallographic analysis shows that the 304 stainless steel side is dominated by austenite, the weld center exhibits lath martensite, and the heat-affected zone of Q235 carbon steel contains Widmanstatten structure, pearlite, and acicular ferrite. The weld grains are most uniform and fine at 0 mm defocus. XRD confirms the presence of Fe-Ni solid solution in the joint. Mechanical tests reveal that the average microhardness of the weld reaches a peak of 373.05 HV and the tensile strength reaches a maximum of 309.46 MPa at 0 mm defocus. Electrochemical tests show that the self-corrosion current density is as low as 2.24×10⁻⁵ A/cm2 and the capacitive arc radius is the largest under this condition, indicating the best corrosion resistance. SEM analysis of the fracture surface shows typical necking and dimpled structures, confirming ductile fracture. The defocus amount significantly regulates the properties of Q235/304 dissimilar steel laser-welded joints. A defocus amount of 0 mm achieves the optimal microstructure and comprehensive properties, providing an important reference for optimizing laser welding parameters of dissimilar metals.
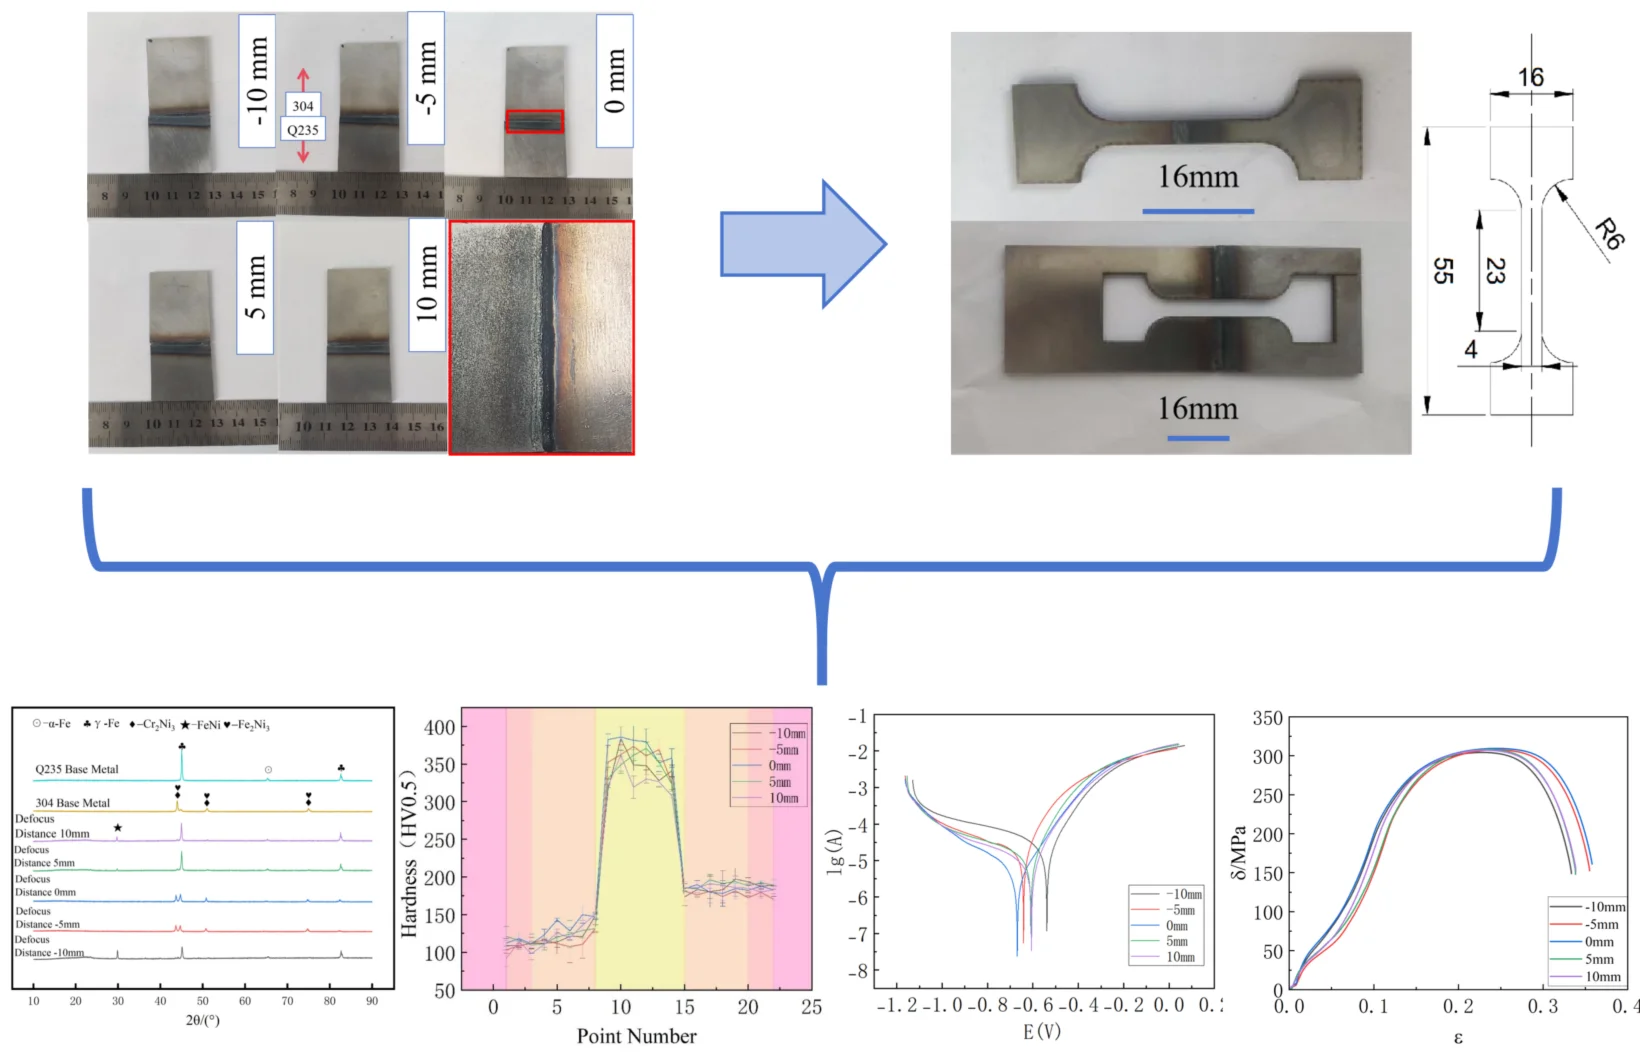
Highlights
- Defocus amount significantly controls Q235/304 laser‑welded joint performance; 0 mm defocus generates the finest, most uniform weld grains.
- 0 mm defocus achieves peak mechanical properties: 373.05 HV microhardness and 309.46 MPa tensile strength. All samples show ductile fracture at the Q235 base metal.
- The 0 mm‑defocus joint has minimum corrosion current density and largest capacitive arc, presenting optimum corrosion resistance in 3.5 % NaCl solution.
- Clear HAZ occurs only on Q235 side; 304 side is dominated by austenite with fine δ‑ferrite in narrow fusion zone.
1. Introduction
In the field of engineering material joining, the quality stability and performance reliability of dissimilar metal welded joints are highly dependent on the precise support of metrology. Q235 low-carbon steel is widely used in the manufacturing of various structural components due to its excellent plasticity, toughness, and significant cost-effectiveness [1-3]; 304 stainless steel, on the other hand, has become the preferred material for key components under harsh working conditions owing to its superior corrosion resistance and high-temperature strength [4-7]. The dissimilar steel combination formed by the two exhibits remarkable advantages in balancing performance and cost. The geometric parameter accuracy, quantitative indicators of microstructure, and metrological results of mechanical properties of their welded joints are the core prerequisites for ensuring the safety of engineering applications, and the acquisition of these indicators all relies on standardized metrological test methods and high-precision measurement technologies. However, there are significant differences between Q235 and 304 in terms of physical properties, metallurgical compatibility, and adaptability to welding processes, which are prone to causing problems such as joint dimensional deviations and uneven microstructure. These issues pose challenges to performance evaluation and quality control based on metrological calibration principles [8-9]. Laser welding, with its advantages of high energy density, precise control of heat input, and small welding distortion, can minimize joint geometric deviations and microstructural fluctuations. It provides a solid technological foundation for the accurate measurement of microstructural parameters (e.g., grain size, phase composition ratio) and mechanical performance indicators (e.g., hardness, tensile strength) of welded joints, while also creating favorable conditions for the in-depth application of metrology in the quality evaluation of dissimilar steel welding [10-12].
Numerous researchers have conducted studies on the welding of Q235/304 and similar dissimilar steel pairs. Wang Jiasheng et al. [13] found that by adjusting the laser beam offset towards the Q235 side, a favorable weld pool shape could be obtained, and the joint exhibited optimal comprehensive properties at an offset of -0.1 mm. Liu Hai et al. [14] used ER50-6 filler wire for laser welding Q345B/304, confirming that this wire reduces cost without producing harmful phases. Luo Xia et al. [15] demonstrated that a low interpass temperature effectively reduces residual stress in 304/Q235 welded joints. Yin Wujia et al. [16] identified 550 °C×1.5 h as the optimal annealing parameters for 304/Q345 laser welds. Wu Wenyong et al. [17] found that high welding speed improves the elongation of carbon steel and stainless steel joints, while Anawa et al. [18] further indicated that high welding speed also reduces residual stress in welds between 316 stainless steel and low-carbon steel. Xu Yulang et al. [19] compared laser autogenous welding and TIG welding, finding that the weld zone had the highest microhardness in both processes, tensile fractures occurred in the lower-strength Q235 base metal side and were mostly ductile fractures; furthermore, laser welding, due to its lower heat input, narrowed the heat-affected zone. Wang Rui et al. [20] also observed carbon migration on the Q235 side when welding Q235B and 316L using double-sided submerged arc welding.
Based on the principles of metrology, this paper systematically investigates the quantitative effects of varying laser welding defocus amounts on the microstructure and properties of Q235/304 dissimilar steel welded joints through experiments. By means of standardized metrological test methods, the quantitative microstructural characteristics (such as grain size, phase composition ratio, etc.) of the weld zone, fusion zone, and heat-affected zone under different defocus amounts are accurately examined. Meanwhile, high-precision metrological testing equipment is employed for the quantitative detection of the mechanical properties (such as microhardness, tensile strength, etc.) of the welded joints. The quantitative relationship between the defocus amount and the comprehensive performance of the welded joints is clarified, laying a foundation for the precise selection of welding process parameters and the metrological control of welding quality in production.
2. Experimental methods
This study used 2 mm thick Q235 low-carbon steel plate and 304 stainless steel plate as raw materials; their chemical compositions are listed in Table 1. The Q235 low-carbon steel and 304 stainless steel raw materials were first ground, polished, and cleaned to remove surface rust, oil stains, and other impurities. They were then cut into 30 mm×30 mm small pieces for welding experiments. A three-axis laser welding robot was employed, with a fixed laser welding power of 1200 W and a welding speed of 500 mm/min. Welding experiments were conducted using five defocus amounts: ±10 mm, ±5 mm, and 0 mm. After welding, specimens were cut as shown in Fig. 1 for tensile testing, and the fracture surface micro-morphology was observed using scanning electron microscopy. An Autolab electrochemical workstation was used to investigate the electrochemical corrosion characteristics of the welded joints in a 3.5 % sodium chloride solution. A Falcon501 Vickers microhardness tester was used to measure the microhardness across different zones of the welded joint. Optical microscopy was used to observe the microstructure of different welding zones, and XRD was used to analyze the phase composition of the weld zone.Each welding condition was repeated at least 3 times to ensure data reliability. The microhardness measurements were conducted with a load of 0.5 kg and dwell time of 10 s, with 3 indentations per zone. The uncertainty of the microhardness tester was ±2 % of the measured value. Tensile tests were performed at a crosshead speed of 1 mm/min with three specimens per condition. Electrochemical measurements were repeated twice to verify reproducibility.
Table 1Chemical element content of raw materials (wt.%)
Element | C | Cr | Ni | Mn | S | P | Si | Fe |
Q235 Steel | 0.22 | – | – | 0.30 | 0.05 | 0.045 | 0.35 | Bal. |
304 Stainless Steel | 0.05 | 17.48 | 8.1 | 0.99 | 0.003 | 0.035 | 0.37 | Bal. |
Fig. 1Tensile specimen and its residual material. Photo by Chen Yuehan, Nanyang, China, Dec 2, 2025
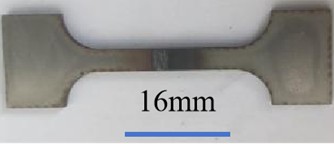
a) Tensile-test physical specimen
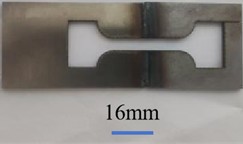
b) Remnant material after removal of the tensile-test specimen
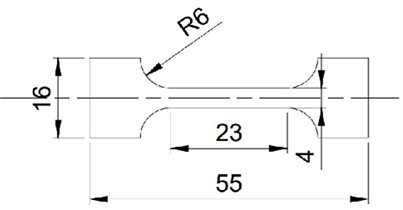
c) Tensile specimen size (unit: mm)
3. Results and discussion
3.1. Macroscopic morphology of welded joints
Fig. 2(a) and Fig. 2(b) show the front and back macroscopic morphologies of the Q235/304 dissimilar metal welded joints at defocus amounts of –10 mm, –5 mm, 0 mm, +5 mm, and +10 mm, respectively. When the defocus amount is –10 mm and +10 mm, the laser spot size acting on the workpiece surface is large, resulting in relatively large weld zone and heat-affected zone (HAZ) areas in the Q235/304 dissimilar steel welded joints, and the weld surface exhibits a slight concave morphology. When the defocus amount is adjusted to –5 mm and +5 mm, the spot size on the workpiece surface decreases significantly. When the laser welding defocus amount is 0 mm, the spot size on the workpiece surface is the smallest, and the corresponding weld zone and HAZ of the dissimilar metal joint are also minimized; the weld surface is generally flat, and the melting and solidification process of the weld metal is more stable, although the surface concavity is relatively more pronounced. Comparing the welding effects of the five different defocus amounts, the macroscopic morphology of the dissimilar metal welded joint is optimal at 0 mm defocus. Furthermore, due to the significant difference in thermal conductivity between 304 stainless steel and Q235 carbon steel – 304 stainless steel has relatively lower thermal conductivity, while Q235 carbon steel has better thermal conductivity – the cooling rate is faster on the Q235 side. This difference ultimately results in no distinct HAZ on the 304 stainless steel side after welding, while the HAZ on the Q235 carbon steel side is clearly visible.
Fig. 2Macroscopic morphology of Q235/304 welded joints. Photo by Chen Yuehan, Nanyang, China, Dec 5, 2025
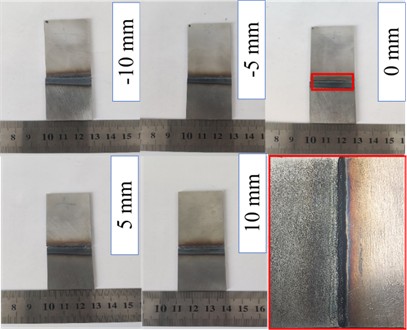
a) Front morphology
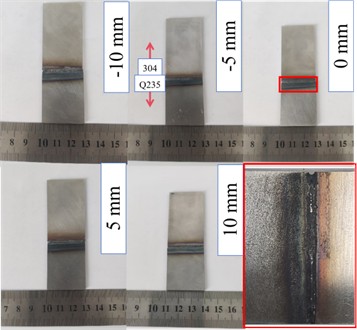
b) Back morphology
3.2. Metallographic structure of welded joints
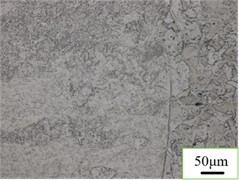
The microstructure of the laser-welded Q235/304 dissimilar steel joint is shown in Fig. 3. From Fig. 3(a), it can be observed that a fusion zone, distinct from both the HAZ and the weld microstructure, appears at the interface between the weld and the 304 stainless steel. This fusion zone contains numerous fine, vermicular, and banded -ferrite distributed along the austenite grain boundaries, with a width of approximately 40-50 μm. Although the grains in the HAZ of the 304 stainless steel grew due to overheating, the effect is not significant compared to the 304 base metal, and the HAZ of the 304 stainless steel is relatively narrow. Therefore, for this study investigating the effects of different defocus amounts on the laser welding of dissimilar steels, the primary focus is on the Q235 carbon steel and the weld zone. Fig. 3(b) shows the microstructure of the center region of the weld in the Q235/304 dissimilar steel laser-welded joint, indicating that the weld zone consists mainly of martensite. Fig. 3(c) shows the microstructural morphology near the fusion line on the Q235 low-carbon steel side. The fusion line is very clear. In the overheated zone just left of the fusion line, feathery and flake-like Widmanstätten structure appears. This is because the heat input in this area is relatively high, and the temperature remains above the complete austenitization temperature for an extended period, allowing carbides to precipitate and grow along certain directions within the austenite grains.
Fig. 3Metallographic structure of Q235/304 welded joints. Photo by Chen Yuehan, Nanyang, China, Dec 7, 2025
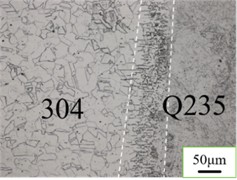
a) Fusion zone at 304 side
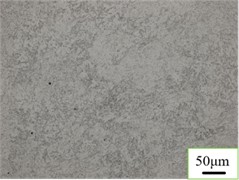
b) Weld center region
c) Fusion line on Q235 side
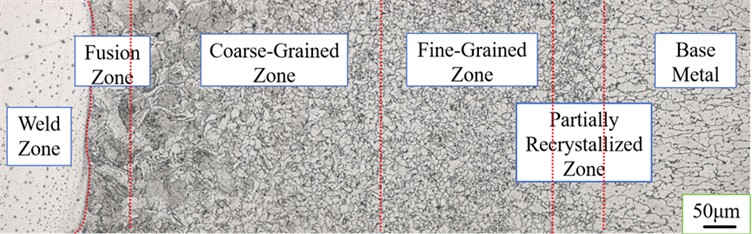
Fig. 4 shows the metallographic microstructure of the HAZ on the Q235 low-carbon steel side. As this involves dissimilar metal welding, two different etching procedures were used to observe the microstructure; this figure shows the result of the first etching, so the microstructure of the weld zone cannot be observed. The figure shows clear boundaries between the HAZ, the weld zone, and the base metal zone. The grain size in the HAZ gradually decreases from left to right. The HAZ can be further divided into four distinct regions: the fusion zone, the coarse-grained zone, the fine-grained zone, and the incomplete recrystallization zone. In the fusion zone, part of the metal is heated to a molten state and solidifies into as-cast structure, while another part consists of severely overheated austenite, which results in coarse grains after cooling. The coarse-grained zone, also known as the overheated zone, experiences high temperatures causing austenite grains to grow rapidly, resulting in coarse ferrite and pearlite structures after cooling. The fine-grained zone, also called the normalized zone, is heated to a temperature higher than the normal normalization temperature but for a short time and cooled rapidly, equivalent to a normalization treatment, resulting in uniform and fine ferrite and pearlite structures at room temperature. The incomplete recrystallization zone, or partial phase transformation zone, experiences welding temperatures where only part of the structure transforms to austenite; after cooling, fine ferrite and pearlite are obtained, while the remainder retains the original structure. Consequently, the grain size is non-uniform, and the mechanical properties are relatively poor. Since the microstructure on the 304 stainless steel side consists entirely of austenite, as shown in Fig. 3(a), distinguishing different zones is difficult, and thus it is not shown again.
Fig. 4Metallographic structure of the Q235 side in Q235/304 welded joints. Photo by CHEN Yuehan, Nanyang, China, Dec 10, 2025
3.3. Phase analysis
Fig. 5 shows the XRD patterns of the Q235 carbon steel base metal, 304 stainless steel base metal, and the weld metal from the dissimilar metal laser welds at different defocus amounts. It can be seen from the figure that the main phase in the Q235 base metal is the Fe phase, consistent with the characteristic of Q235 low-carbon steel where ferrite is the primary constituent. The main phase in the 304 base metal is -Fe, consistent with the austenitic matrix of 304 stainless steel. Additionally, phases containing chromium and nickel, such as Cr2Ni4 and Fe2Ni3, are present, which is expected given the significant content of these elements in 304 stainless steel. For the dissimilar steel welded joints at different defocus amounts, as the defocus amount changes, phases from both base metals appear, along with new phases not present in the base metals (e.g., FeNi). This is likely due to factors such as the material differences, temperature, and elemental diffusion during the laser welding process. Overall, the XRD results for the five different defocus amounts show that, besides the matrix Fe phase, the Fe-Ni phase is generally present in all cases, and no harmful phases are detected.
3.4. Microhardness analysis
The microhardness profile is shown in Fig. 6, and the average hardness values of the weld zone for the dissimilar metal welded joints at different laser welding defocus amounts are listed in Table 2.
Fig. 5XRD analysis of the weld zone
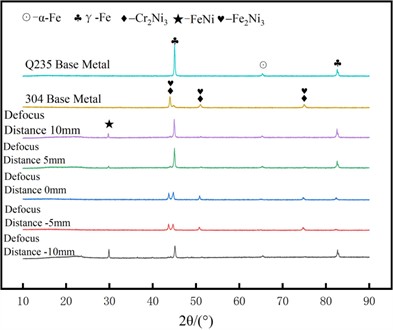
Fig. 6 clearly shows that the hardness of the weld zone is significantly higher than that of the regions on either side. This is because the microstructure of the weld zone consists mainly of lath martensite, which has high hardness. The formation of Fe-Ni solid solution in the weld zone, as confirmed by XRD, also contributes to the high hardness. Wu et al. [23] demonstrated that solid-solution strengthening from lattice distortion significantly enhances hardness in multi-component alloys.
Fig. 6Microhardness curve diagram
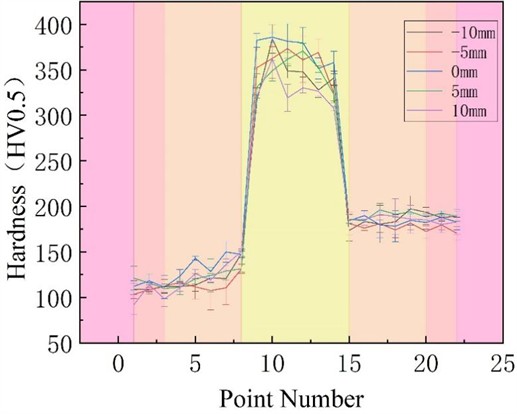
Similarly, the Fe-Ni solid solution formed during laser welding of Q235 and 304 stainless steel, together with the lath martensite, contributes to the peak microhardness of 373.05 HV at 0 mm defocus, where the finest grain structure maximizes this strengthening effect. The lowest hardness value occurs on the Q235 low-carbon steel side. On the Q235 side, it is also evident that the hardness in the HAZ is higher than that in the base metal zone. This phenomenon can be attributed to several factors. Firstly, during the welding of Q235 carbon steel and 304 stainless steel, the concentration distributions of Cr and Ni elements are relatively stable within the HAZ, but exhibit significant gradient changes near the fusion line, with the variation in Cr content being particularly notable. Furthermore, when laser welding is used to join these two materials, martensite phase forms partially in the microstructure of the HAZ. This phase has significantly higher hardness than the original ferritic structure, leading to an overall increase in HAZ hardness. Simultaneously, the high temperatures during welding can easily cause melting reactions in the base metals, promoting effective diffusion of alloying elements and thereby further enhancing the hardness of the metal near the fusion zone [21-22]. Table 2 indicates that the maximum average hardness in the weld zone is 373.05 HV at a laser welding defocus amount of 0 mm, and the minimum average hardness is 327.69 HV at a defocus amount of +10 mm.
Table 2Average hardness
Laser welding defocus amount (mm) | Average weld zone hardness (HV) |
–10 | 344.23 |
–5 | 356.99 |
0 | 373.05 |
5 | 347.94 |
10 | 327.69 |
3.5. Electrochemical corrosion analysis
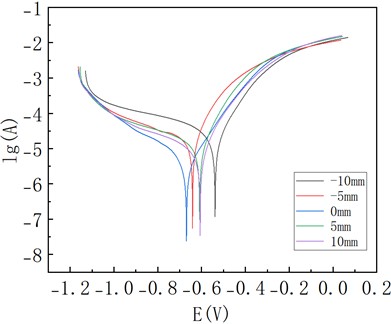
Potentiodynamic polarization was used to determine the polarization curves of the dissimilar metal laser-welded joints in a 3.5 % sodium chloride solution for the five different defocus amounts. Fig. 7 shows the polarization curves for the different defocus amounts. According to relevant theory, the corrosion resistance of a material is closely related to its self-corrosion potential and self-corrosion current density, with the self-corrosion current density having a greater influence on corrosion resistance than the self-corrosion potential. That is, a higher (more noble) self-corrosion potential and a lower self-corrosion current density indicate better corrosion resistance of the welded joint. To accurately obtain the key electrochemical parameters, the Tafel extrapolation method was used to systematically analyze the polarization curves. The calculated results are shown in Table 3. The table shows that when the laser welding defocus amount is 0 mm, the self-corrosion current density is the lowest at 2.24×10⁻5 A/cm2, indicating the best corrosion resistance of the welded joint under this condition. When the defocus amount deviates from 0 mm, the self-corrosion current density increases, and the corrosion resistance of the welded joint deteriorates.
Fig. 7Polarization curves
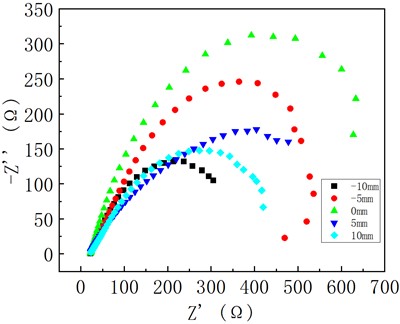
Electrochemical impedance spectroscopy (EIS) was performed on the dissimilar metal welded specimens at different laser welding defocus amounts at the open circuit potential. The corresponding Nyquist plots are shown in Fig. 8. The radius of the capacitive arc reflects the difficulty of charge transfer on the material surface; a larger capacitive arc radius indicates more difficult charge transfer and better corrosion resistance. The figure shows that the capacitive arc radius is largest at a laser welding defocus amount of 0 mm and smallest at a defocus amount of -10 mm. This indicates that the welded joint has the best corrosion resistance at 0 mm defocus, which is consistent with the results obtained from the polarization curves.
Table 3Self-corrosion current density and self-corrosion potential
Laser welding defocus amount (mm) | Self-corrosion current density (A/cm2) | Self-corrosion potential (V) |
–10 | 2.89×10⁻⁵ | –0.548 |
–5 | 2.27×10⁻⁵ | –0.641 |
0 | 2.24×10⁻⁵ | –0.669 |
5 | 2.44×10⁻⁵ | –0.609 |
10 | 2.46×10⁻⁵ | –0.607 |
Fig. 8Impedance curves
3.6. Tensile test analysis
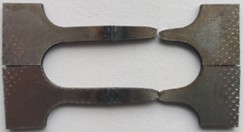
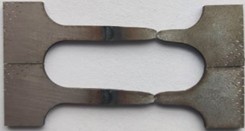
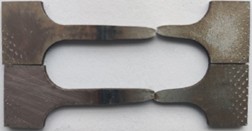
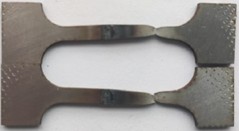
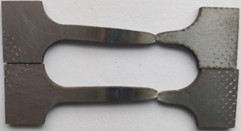
The macroscopic results of the tensile tests are shown in Fig. 9. It can be observed that all tensile specimens fractured on the Q235 side, and the specimens exhibited significant overall elongation after testing. This occurs because the rapid heating and cooling characteristic of laser welding can produce a fine-grained structure in the micro-region of the weld. The formation of this fine-grained structure can enhance material properties through grain refinement strengthening. Additionally, the martensitic structure in the weld contributes to strength. As the content of elements like Cr and Ni in the weld is higher than in the base metal, these atoms can occupy interstitial sites in the lattice during high-temperature melting, resulting in substitutional or interstitial strengthening. Therefore, the overall strength of the weld is higher than that of the Q235 base metal. The mechanical strength of 304 stainless steel is significantly higher than that of Q235 steel. Consequently, during tensile testing, the Q235 base metal portion becomes the weakest link in the welded specimen in terms of tensile strength, and failure initiates there when the stress exceeds its tensile strength.
Fig. 10 shows the stress-strain curves of the tensile specimens. The elastic stage, strengthening stage, and necking stage are visible in the curves. The yield stage is not distinctly apparent in the figure, possibly because the yield stage of the Q235 carbon steel/304 stainless steel dissimilar metal welded specimens is not pronounced. Table 4 presents the tensile test results for specimens at different welding defocus amounts. The table shows that the average tensile strength is highest, at 309.46 MPa, at a laser welding defocus amount of 0 mm, followed by the values at –5 mm and +5 mm. The lowest average tensile strengths are observed at defocus amounts of –10 mm and +10 mm. The elongation of the tensile specimen is also greatest at 0 mm defocus. The fracture surface morphology was examined using scanning electron microscopy (SEM), as shown in Fig. 11 (Note: Text refers to Fig. 10, but context suggests Fig. 11 for SEM). The results clearly show that the fracture surface exhibits a typical dimpled structure, confirming that the fracture is ductile in nature.
Fig. 9Tensile test results of specimens at different defocus amounts. Photo by CHEN Yuehan, Nanyang, China, Dec 11, 2025
a) Defocus amount: –10 mm
b) Defocus amount: –5 mm
c) Defocus amount: 0 mm
d) Defocus amount: +5 mm
e) Defocus amount: +10 mm
Fig. 10Stress-strain curves at different defocus amount
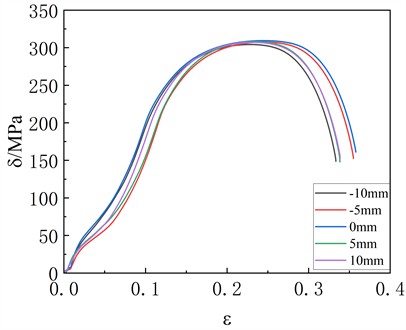
Fig. 11SEM morphology of tensile specimen fracture surface. Photo by CHEN Yuehan, Nanyang, China, Dec 11, 2025
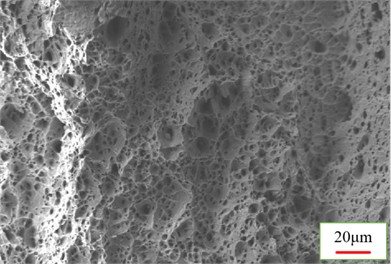
a) 500X
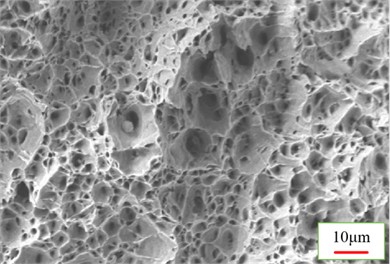
b) 1000X
Table 4Average values of tensile strength and elongation
Laser welding defocus amount (mm) | Average tensile strength (MPa) | Average elongation (%) |
–10 | 304.33 | 33.39 % |
–5 | 307.60 | 35.53 % |
0 | 309.46 | 37.12 % |
5 | 308.09 | 34.23 % |
4. Conclusions
This experiment investigated the effect of defocus amount (–10 mm, –5 mm, 0 mm, +5 mm, +10 mm) on the microstructure and properties of laser-welded Q235/304 dissimilar steel joints using methods including macroscopic observation, optical microscopy, XRD phase detection, microhardness testing, electrochemical corrosion analysis, tensile testing, and SEM fractography. The following conclusions were drawn: The microstructure on the 304 side is primarily austenitic, with fine δ-ferrite near the fusion line. The microstructure on the Q235 side is complex with a distinct HAZ; the defocus amount had little influence on the general microstructural types. XRD showed that the welds at all defocus amounts contained Fe phase and Fe-Ni phase. The weld zone exhibited the highest hardness. The average weld hardness increased as the defocus amount changed from –10 mm to 0 mm, reaching a maximum of 373.05 HV at 0 mm, and then gradually decreased up to +10 mm. The trends for tensile strength and corrosion resistance were consistent with the hardness trend. At 0 mm defocus, the self-corrosion current density was minimized (2.24×10⁻5 A/cm2), the capacitive arc radius was the largest, indicating optimal corrosion resistance, and the average tensile strength peaked at 309.46 MPa. All tensile specimens fractured in the Q235 base metal. The fracture surfaces exhibited necking and dimpled structures, characteristic of ductile fracture.
References
-
P. Han, Z. Sun, Y. Li, C. An, M. Zhou, and J. Fan, “Synergistic corrosion inhibition behavior of synthesized NPSA and KI as inhibitor for Q235 steel in 3.5 wt% NaCl solution,” Colloids and Surfaces A: Physicochemical and Engineering Aspects, Vol. 727, No. P3, p. 138457, 2025, https://doi.org/10.1016/j.colsurfa.2025.138457
-
S. Qin, S. Li, and X. Wang, “Corrosion behavior of Q235 steel in tropical marine atmosphere of Hainan Island,” Journal of Constructional Steel Research, Vol. 236, No. PA, p. 109982, Sep. 2025, https://doi.org/10.1016/j.jcsr.2025.109982
-
H. Zhang et al., “Corrosion behavior of Q235 under dynamic simulated seawater and online monitoring using resistance probes,” Journal of Materials Research and Technology, Vol. 38, pp. 1313–1322, Jul. 2025, https://doi.org/10.1016/j.jmrt.2025.07.288
-
J. Yue, H. Wu, L. Du, and X. Gao, “Effect of laser welding process on microstructure and properties of submicron-grained 304 stainless steel welded joints,” Journal of Materials Engineering and Performance, Vol. 35, No. 7, pp. 6167–6188, Sep. 2025, https://doi.org/10.1007/s11665-025-12051-2
-
W. Xia, J. Meng, R. Liu, Z. Li, Y. Cao, and Y. Zhao, “Efficient preparation of strong and tough 304 stainless steels via high-frequency pulse forging,” Journal of Materials Science and Technology, Vol. 251, pp. 297–310, 2025, https://doi.org/10.1016/j.jmst.2025.06.051
-
K. Jain, M. Gautam, A. M. Saeed, S. Sharma, R. Tiwari, and A. Soni, “Analysis using a modified Johnson-cook model for AISI 304 stainless steel and of prior dynamic tensile behavior deformed AISI type 304 stainless steel,” Archive of Applied Mechanics, Vol. 95, No. 10, pp. 231–231, 2025, https://doi.org/10.1007/s00419-025-02934-0
-
X. Song, X. Zhong, W. Wang, and K. Dou, “Mitigation of black streak defects in AISI 304 stainless steel via numerical simulation and reverse optimization algorithm,” Materials, Vol. 18, No. 14, p. 3414, Jul. 2025, https://doi.org/10.3390/ma18143414
-
X. Luo, J. Wang, and X. Xu, “Study on the effect of welding process on residual stress of 304 stainless steel and Q235 carbon steel joints,” Machine China, No. 17, pp. 31–37, 2025.
-
Y. Li et al., “Research on preparation of SUS304/Q235 clad plate by linear friction welding method,” (in Chinese), Steel Rolling, Vol. 41, No. 5, pp. 174–179+187, 2024, https://doi.org/10.13228/j.boyuan.issn1003-9996.20240517
-
X. Zhang et al., “Research on laser cladding process of piston rod of disc spring hydraulic mechanism for high-voltage switch,” (in Chinese), High Voltage Apparatus, Vol. 60, No. 6, pp. 57–64, 2024, https://doi.org/10.13296/j.1001-1609.hva.2024.06.008
-
X. Gao et al., “Progress and trend on laser welding process and simulation technology,” Electric Welding Machine, Vol. 55, No. 9, pp. 28–46+79, 2025.
-
Y. Liu and Z. Liu, “Progress in welding of titanium/steel dissimilar metals,” (in Chinese), Welding Technology, Vol. 54, No. 8, pp. 4–10, 2025, https://doi.org/10.13846/j.cnki.cn12-1070/tg.2025.08.026
-
J. Wang and L. Shu, “Effect of laser beam displacement on microstructure and mechanical properties of Q235 /304 by laser welding,” Journal of Shaanxi University of Technology (Natural Science Edition), Vol. 35, No. 2, pp. 1–5, 2019, https://doi.org/10.1016/j.jmatprotec.2018.08.013
-
H. Liu and H. Chen, “Structure and properties of Q345B/304 dissimilar steel joint using ER50-6 welding wire laser welding,” (in Chinese), Journal of Netshape Forming Engineering, Vol. 16, No. 6, p. 129, 2024, https://doi.org/10.3969/j.issn.1674-6457.2024.06.016
-
X. Luo et al., “Effect of welding process on residual stresses in dissimilar metal welded joints of stainless steel 304 and carbon steel Q235,” (in Chinese), Metallurgical Standardization and Quality, Vol. 63, No. 2, pp. 46–54, 2025, https://doi.org/10.26915/j.issn1003-0514.2025.02.011
-
W. Yin et al., “Effect of annealing treatment on microstructure and properties of laser welded joint of dissimilar steel,” (in Chinese), Journal of Netshape Forming Engineering, Vol. 16, No. 5, pp. 1–10, 2024, https://doi.org/10.3969/j.issn.1674-6457.2024.05.001
-
W. Wu, S. Hu, and J. Shen, “Microstructure, mechanical properties and corrosion behavior of laser welded dissimilar joints between ferritic stainless steel and carbon steel,” Materials and Design (1980-2015), Vol. 65, pp. 855–861, 2014, https://doi.org/10.1016/j.matdes.2014.09.064
-
E. M. Anawa and A. G. Olabi, “Control of welding residual stress for dissimilar laser welded materials,” Journal of Materials Processing Technology, Vol. 204, No. 1-3, pp. 22–33, Apr. 2008, https://doi.org/10.1016/j.jmatprotec.2008.03.047
-
Y. Xu et al., “Study on microstructure and mechanical properties of laser welded joint of Q235/304 dissimilar steel,” (in Chinese), Applied Laser, Vol. 42, No. 4, pp. 21–28, 2022, https://doi.org/10.14128/j.cnki.al.20224204.021
-
R. Wang et al., “Analysis of bending property of dissimilar steels welded joints,” Transactions of the China Welding Institution, Vol. 34, No. 2, pp. 58–62, 2013.
-
Q. Pan, “Study on welding process and properties of TP304/Q235 composite steel plate,” (in Chinese), Chemical Equipment and Pipeline, Vol. 60, No. 1, p. 22, 2023, https://doi.org/10.3969/j.issn.1009-3281.2023.01.005
-
J. Xu and P. Zhao, “Study on welding process and properties of 405/Q345 composite steel plate,” (in Chinese), Foundry Technology, Vol. 38, No. 10, pp. 2503–2505, 2017, https://doi.org/10.16410/j.issn1000-8365.2017.10.050
-
Y. Wu et al., “Relationship between the unique microstructures and behaviors of high-entropy alloys,” International Journal of Minerals, Metallurgy and Materials, Vol. 31, No. 6, pp. 1350–1363, 2024, https://doi.org/10.1007/s12613-023-2777-4
About this article

This work was Supported by the 2025 Mechanical Discipline University-Industry-Research Innovation Fund Project (Grant No. JXCXYB250201).
The datasets generated during and/or analyzed during the current study are available from the corresponding author on reasonable request.
Chen Yuehan: conceptualization, methodology, supervision, writing-review and editing. Zhang Zhengyi: data curation, investigation, formal analysis. Wang Minghui: software, validation, writing-review and editing. Yan Jisen: software, visualization. Liu Qingshan: investigation, writing-original draft preparation. Zhou Yang: writing-original draft preparation, resources.
The authors declare that they have no conflict of interest.

