Abstract
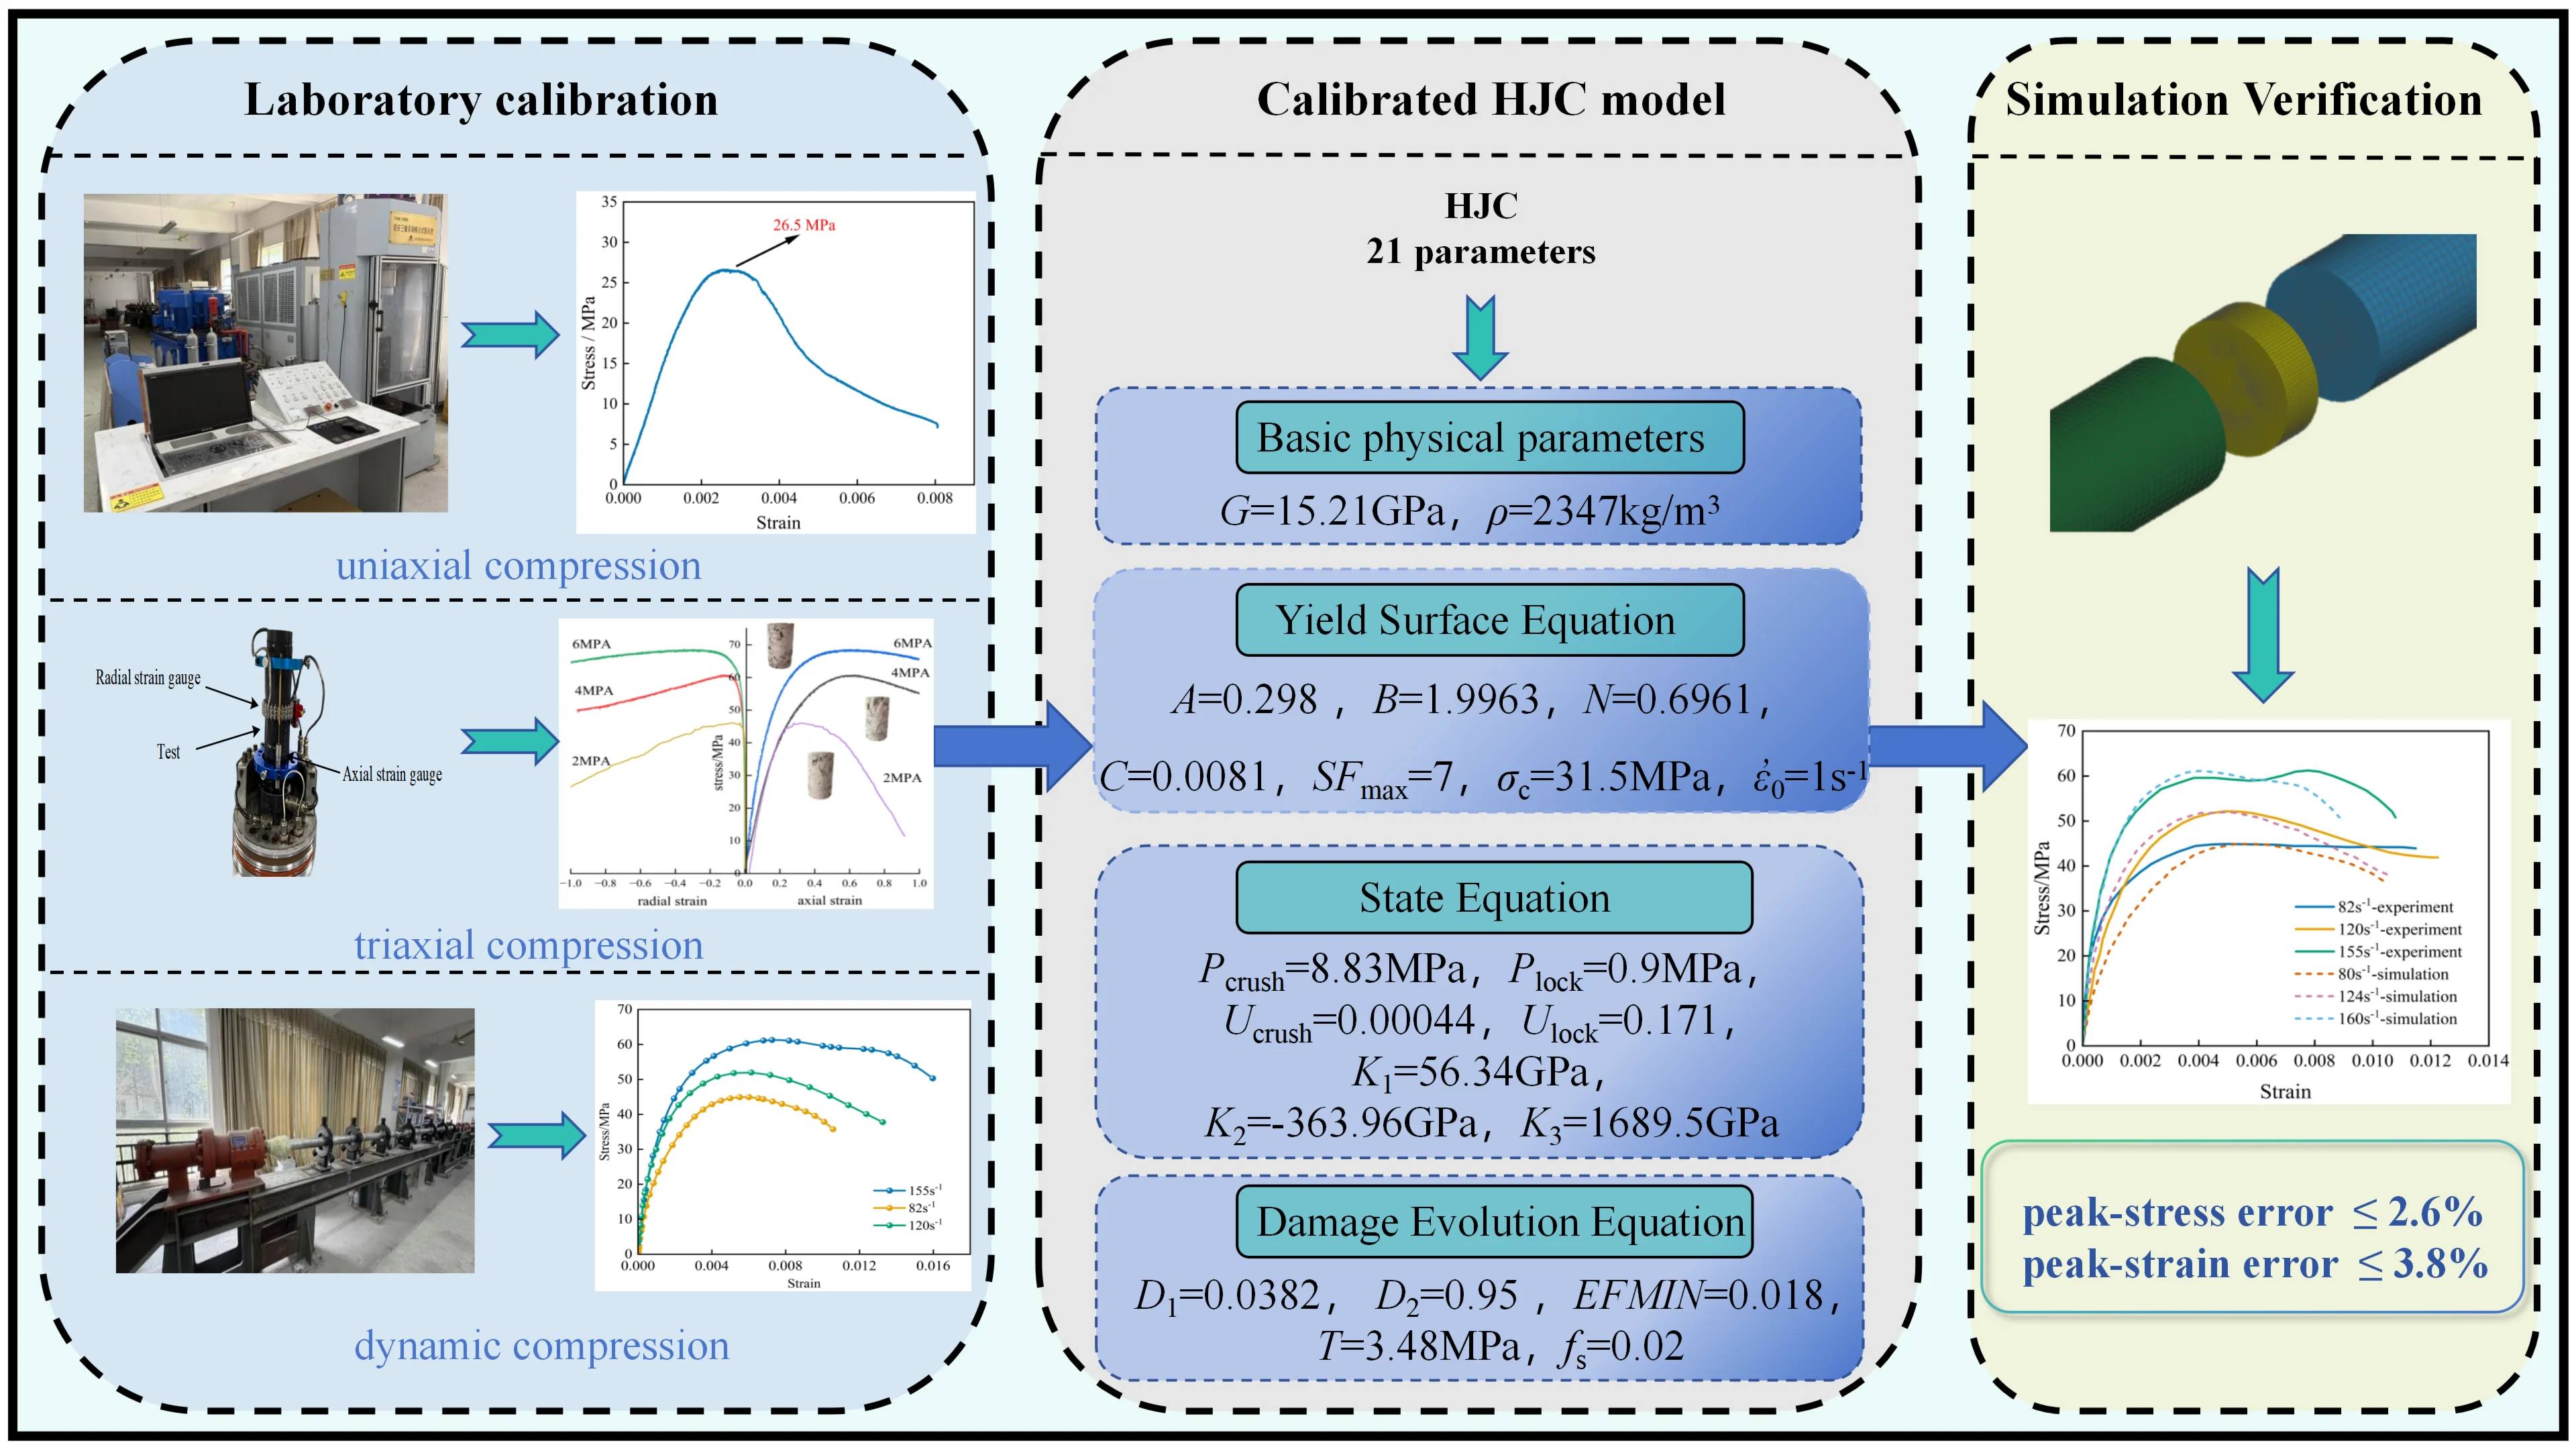
The Holmquist-Johnson-Cook constitutive model is widely adopted to analyze the dynamic response of concrete-like materials under impact and blast loading. In this study, a modified set of HJC constitutive parameters for C30 concrete was calibrated through a series of tests. Uniaxial compression tests were used to determine the uniaxial compressive strength and elastic parameters; conventional triaxial compression tests were performed to obtain the yield-surface parameters , , and ; uniaxial cyclic loading-unloading tests were conducted to determine the damage parameters and ; and split Hopkinson pressure bar (SHPB) tests were carried out to identify the strain-rate parameter . Numerical validation was conducted using a finite element model of the SHPB test. The results demonstrate that the proposed HJC model parameters can effectively represent the dynamic mechanical behavior of C30 concrete under impact loading at low-to-medium strain rates. Both the stress-strain curves and failure modes derived from numerical simulations agree well with the experimental observations. These findings can provide reference for the impact- and blast-resistant design of concrete structures.
Highlights
- A modified HJC parameter set for C30 concrete was calibrated using uniaxial compression for strength and elastic properties, triaxial compression for A, B, and N, cyclic loading–unloading for D1 and D2, and SHPB tests for the strain-rate parameter C.
- Through uniaxial cyclic loading and unloading tests, the degradation of elastic modulus and cumulative plastic strain data were optimized and fitted to obtain D1, D2, and EFMIN.
- The forms and patterns of sample failure were studied through numerical simulation, and the accuracy of model parameters was compared and verified.
1. Introduction
As a core material in civil construction and protective engineering [1]-[2], concrete exhibits distinct dynamic mechanical responses under extreme dynamic loads such as impact and blast, and these responses directly determine the safety and damage mitigation performance of engineering structures. In recent years, with the increase in threats such as terrorist attacks, accidental explosions, and weapon penetration, in-depth research on the dynamic constitutive behavior of concrete materials under high strain-rate loading [3] and the establishment of accurate and reliable numerical prediction models [4], have become key issues in the design and evaluation of protective engineering.
The Holmquist-Johnson-Cook (HJC) [5] constitutive model has been widely integrated into explicit dynamic analysis software such as LS-DYNA because of its ability to comprehensively describe the strain-rate strengthening effect, damage softening behavior, confining pressure dependence, and crushing-compaction characteristics of concrete materials [6-9], as well as its advantages in clear parameter interpretation and high computational efficiency [10]. It has become an important tool for simulating the dynamic response of concrete structures under blast and impact loading.
However, the HJC model still faces significant challenges in practical applications, as the determination of its material parameters is highly dependent on comprehensive experimental data. Numerous studies have confirmed that the HJC model is highly sensitive to pressure-related parameters [11-13], and that concrete with different strength grades requires independent parameter calibration [14-16].
Current research generally focuses on improving the applicability of the HJC model by reconstructing the yield equation [17, 18], the damage evolution equation [19, 20], and the equation of state [21, 22], or by calibrating model parameters based on experimental results to expand the applicability of the HJC model to new materials such as rock masses [23-26] and high-performance concrete [27-29]. However, for low-strength concrete such as C30, which is widely used in engineering practice, comprehensive parameter calibration for the HJC model remains insufficient. In numerical simulations of engineering structures made of low-strength concrete, the parameters of the original HJC model which are based on 48 MPa concrete, are often directly adopted, which makes it difficult to accurately capture the actual mechanical behavior of low-strength concrete under complex stress paths [30]. This leads to significant deviations between numerical predictions and actual responses, seriously restricting the credibility and application value of the HJC model in refined blast-resistant design and evaluation. Recent studies on concrete pipe structures have shown that reliable mechanical models and parameter selection are essential for numerical prediction. Zhai et al. [31] analyzed the effects of CFRP width and thickness on the strengthening of PCCP, Zhai et al. [32] proposed an analytical solution for liner-rehabilitated concrete pipes under external load, and Zhai and Moore [33] investigated the mechanical response of pipe liners across ring fractures or joints under shear action. Although these studies mainly focus on structural-scale behavior, they indicate that accurate simulation of concrete-related structures depends strongly on appropriate material models and calibrated parameters. Therefore, it is necessary to establish reliable material-level constitutive parameters for commonly used concrete such as C30.
To address this research problem, this study focuses on C30 concrete and aims to resolve three specific limitations: the lack of a complete experimentally calibrated HJC parameter set for ordinary C30 concrete, the uncertainty in determining damage and strain-rate parameters from laboratory tests, and the insufficient numerical verification of calibrated parameters under medium- and low-strain-rate impact loading. Based on the original HJC constitutive model and the results of static compression and SHPB impact tests, a modified HJC constitutive model applicable to C30 concrete was calibrated and established to accurately describe the dynamic mechanical behavior of low-strength concrete materials within the low-to-medium strain-rate range. Furthermore, numerical simulations of concrete SHPB tests were carried out using the finite element software LS-DYNA to reproduce the stress-strain curves and the damage evolution of specimens during impact loading. Comparative analysis confirmed that the simulation results agreed well with the experimental results. The modified HJC constitutive model can reasonably reproduce the dynamic damage evolution of C30 concrete under impact loading, indicating that the material parameters and numerical implementation used in the numerical simulation are reasonable.
2. Introduction to the HJC model
The HJC model consists of three core components: the equation of state, the yield surface function, and the damage evolution law. These components are described in detail in this section.
2.1. Yield surface equation
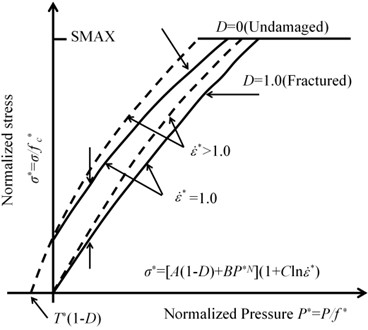
When the pressure is in the positive region (0), the equivalent stress as a function of pressure, damage and strain rate effect (which is presented in Fig. 1) is expressed as:
where and are the dimensionless equivalent stress and hydrostatic pressure respectively; is the dimensionless strain rate, where is the true strain rate and is the reference strain rate; is the cohesive strength parameter; is the pressure hardening coefficient; is the pressure hardening index; SFMAX is the maximum value that the characterized equivalent stress can reach; is the damage variable; is the strain rate effect coefficient.
Fig. 1Evolution of the yield surface for concrete with damage
2.2. State equation
In the HJC model, the piecewise equation of state shown in Fig. 2 is used to represent the relationship between hydrostatic pressure and the volumetric strain of concrete.
Fig. 2Curves of hydrostatic pressure and volumetric strain of concrete
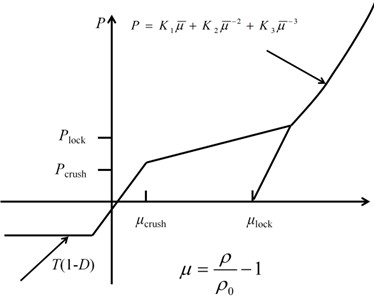
The first stage (OA) is the linear elastic stage, . Load or unload segments as follows:
where is the bulk modulus; and are the hydrostatic pressure and volumetric strain respectively, at which the voids start to close; and are the current density and initial density respectively.
The second stage (AB) is the transition stage, where . In this stage, the concrete begins to develop crushing-induced microcracks and gradually undergoes plastic deformation, but completely damaged has not yet occurred. The expression for the loading branch is as follows:
where is the compaction pressure, and is the compaction volumetric strain. The expression for the unloading branch is as follows:
where is the plastic volumetric modulus, and are the maximum volumetric pressure and volumetric strain reached before unloading.
The third stage (BC) is the fully compacted stage, where . In this stage, the concrete has been crushed, and the expression for the loading branch is as follows:
where , , and are pressure constants.
The unloading segment expression is as follows:
2.3. Damage evolution equation
Material damage is described by the accumulation of equivalent plastic strain and plastic volumetric strain, as shown in Fig. 3.
Fig. 3Damage evolution equation
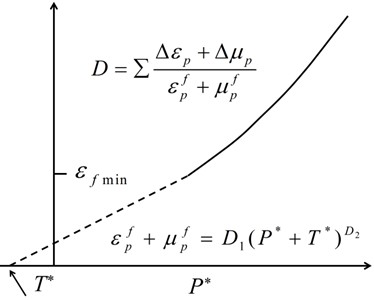
The damage evolution equation is expressed as follows:
where and are the equivalent plastic strain and plastic volumetric strain within an integration cycle, respectively; is the plastic strain for material fragmentation under confining pressure; is the maximum normalized equivalent tensile stress of the material; is the maximum tensile stress of the material; and are the damage parameters of the model; and EFMIN is the minimum plastic strain required to fracture the material.
The HJC constitutive model contains a total of 21 parameters, of which 19 are computational parameters. In this paper, these parameters are divided into basic physical parameters, yield surface parameters, equation of state parameters, damage parameters, and software parameters, as shown in Table 1. The parameters of C30 concrete were determined by combining relevant experiments, theoretical derivations, and finding from the literature.
Table 1Twenty-one parameters of the HJC model
Basic physical parameters | Yield surface parameters | State equation parameters | Damage parameters | Software parameters |
(kg/m3) | A | (MPa) | (s-1) | |
(MPa) | B | (MPa) | ||
(MPa) | N | EFMIN | – | |
(GPa) | C | – | – | |
– | , , (MPa) | – | – |
3. Experimental basis and determination of HJC model parameters
The determination of parameters in the HJC constitutive model is highly dependent on comprehensive experimental data. This section first introduces a series of tests carried out to calibrate the HJC model parameters for C30 concrete, including specimen preparation, static mechanical property tests (uniaxial compression, conventional triaxial compression, and uniaxial cyclic loading-unloading tests), and dynamic impact tests (SHPB tests). Subsequently, based on these experimental results, together with theoretical analysis and findings from the literature, all 21 parameters (including 19 computational parameters) of the modified HJC constitutive model applicable to C30 concrete are systematically presented and determined.
3.1. Specimen Preparation
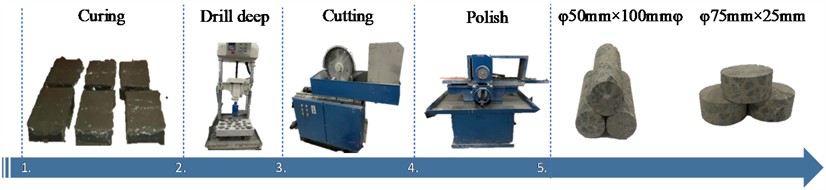
Considering the compatibility with the experimental apparatus and the widespread engineering application of C30 concrete, specimens of this strength grade were prepared. After 28 days of curing, cylindrical specimens of 50 mm × 100 mm for static tests and 75 mm × 25 mm for impact tests were prepared by drilling, cutting, and grinding, as shown in Fig. 4. The coarse aggregate in the concrete was continuously graded crushed stone with a particle size not exceeding 20 mm, and the sand ratio was designed to be 35 %. Tap water was used, and P.C 32.5 composite Portland cement was adopted. The concrete mix proportion was cement: water:sand:stone = 1:0.5:3.07:1.58.
Table 2Main experimental conditions for HJC parameter calibration
Test type | Specimen size | Loading condition | Parameters obtained |
Uniaxial compression test | Φ50 mm × h100 mm | Preload:5 kN; Loading rate:0.2 mm/min | , , , , , |
Conventional triaxial compression test | Φ50 mm × h100 mm | Confining pressures:2, 4, and 6 MPa; Axial loading rate of 0.2 mm/min | , , |
Cyclic loading-unloading test | Φ50 mm × h100 mm | 10 cycles at 70 % of peak stress; Loading/unloading rate:0.2 mm/min | , , EFMIN |
SHPB impact compression test | Φ75 mm × h25 mm | Impact velocities: 3.33, 4.72, and 5.43 m/s; strain rates of 82, 120, and 155 s⁻1 | and numerical verification |
To improve the reproducibility of the experimental procedure, the main testing conditions used in HJC parameter calibration are summarized in Table 2. The static tests were conducted using a TAW-2000 triaxial multi-field coupling test system, and the dynamic tests were conducted using a Φ75 mm SHPB system. Before testing, both end faces of the cylindrical specimens were ground and polished to minimize eccentric loading. The static tests were mainly used to determine the basic physical parameters, yield surface parameters, and damage parameters, while the SHPB tests were used to determine the strain-rate parameter and validate the dynamic response predicted by the calibrated HJC parameters.
Fig. 4The process of concrete specimen molding
3.2. Determination of basic physical parameters
Basic physical parameters such as , , , and can be obtained by combining uniaxial compression tests with theoretical formulas.
3.2.1. Experiment overview and result analysis
The TAW-2000 rock triaxial multi-field coupling experimental system comprises a main frame, a hydraulic pressure system, a confining pressure system, a high-low-temperature system, and oil cooling system, and power distribution system. Equipped with deformation sensors, it directly measures the axial and radial deformations of concrete under uniaxial and triaxial loading conditions. The control unit is an imported controller from DOLI, enabling closed-loop control of any channel and smooth switching during experiments. Through the control system, axial pressure is applied to the specimens incrementally, while high-precision sensors and a data acquisition system record real-time stress and deformation, which are then collected and analyzed by a computer. A transparent protective cover is installed externally to prevent injury from flying debris during loading, as shown in Fig. 5.
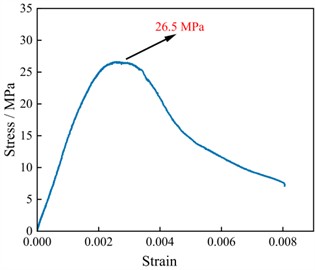
The prepared Փ50 mm × 100 mm cylindrical concrete specimens were loaded, with radial and axial displacement sensors installed. Before the formal loading stage, a preloading force of 5 kN was applied to the specimens. Then, static compression was performed on the cylindrical concrete specimens under displacement control at a loading rate of 0.2 mm/min. The uniaxial compressive stress-strain curves of the specimens were obtained by processing the data recorded by the displacement sensors, as shown in Fig. 6.
As shown in Fig. 6, at a strain rate of = 3×10⁻⁴ s-1, the curve rose steeply from the origin, with stress and strain being approximately linearly related. At this stage, no microcracks developed inside the concrete, which remains in an elastic state consistent with to Hooke's law. With increasing strain, the curve slope decreased, the stress increase became more gradual, and the relationship deviated from linearity, indicating that microcracks started to appear and the material enters the elastoplastic stage.
Further increases in load caused microcracks to expand and coalesce, making concrete deformation increase faster than stress. The curve peaked at 26.52 MPa, where numerous microcracks developed into macroscopic cracks and the load-carrying capacity reached its limit. After the peak, stress decreased with increasing strain due to internal structural damage and crack propagation. The curve declined slowly initially but then decreased more rapidly as strain increases, progressive concrete damage.
Fig. 5Rock triaxial multi-field coupling experimental system
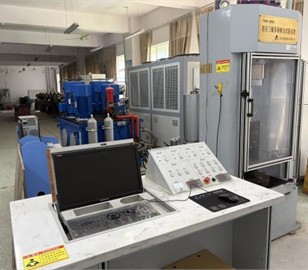
Fig. 6Uniaxial compression stress-strain curve diagram
3.2.2. Process of determining basic physical parameters
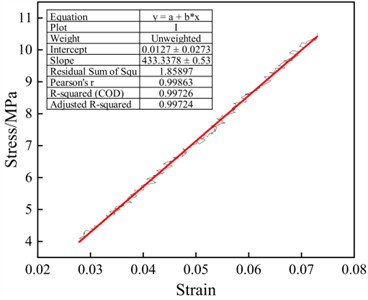
The basic mechanical parameters in the HJC model were determined as follows. The density was determined as 2347 kg/m3 using the volumetric method; that is, the specimen volume was measured and the density was calculated from its mass and volume. The static uniaxial compressive strength was obtained from the test as 26.5 MPa. The Poisson’s ratio was equal to , where the data of axial and radial strains were selected from multiple stress points in the linear elastic stage (15 %-30 % of ), and the average value was taken as 0.18. The elastic modulus was equal to , and the data points in the linear segment corresponding to 15 %-30 % of were also selected. After linear fitting, 43.33 GPa was obtained, as shown in Fig. 7.
Fig. 7Fitting diagram of elastic modulus E
The tensile strength 3.19 Mpa can be obtained from the relationships proposed by the American Concrete Institute (ACI): . The shear modulus 15.21 GPa and the bulk modulus 23.67 GPa were obtained from the following relationships respectively:
3.3. Determination of yield surface parameters
The yield surface equation describes the relationship between the normalized equivalent stress and the damage variable, hydrostatic pressure, and strain-rate effect. The yield surface parameters , , and can be obtained from conventional triaxial compression tests combined with uniaxial compression tests, and the strain-rate effect parameter C can be obtained from the SHPB test.
3.3.1. Experiment overview and result analysis
1) Confining pressure test and results analysis.
Using the same testing machine as in the uniaxial compression test, static compression tests were conducted under three confining pressures of 2, 4, 6 MPa. The prepared Փ50 mm × 100 mm cylindrical specimens were loaded. Before loading in the confining pressure test, a heat-shrink tube was first placed on the specimen and heated with a hot-air gun so that the tube shrank and completely wrapped the specimen. The radial and axial strain sensors were then installed, as shown in Fig. 8.
Fig. 8Schematic diagram of sample installation for triaxial experiment specimens
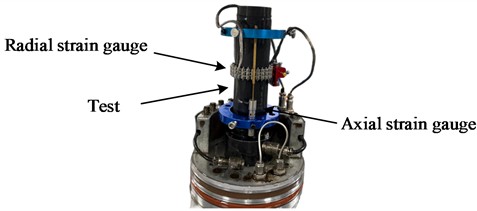
The specimen was placed on the base of the confining-pressure chamber. An appropriate spacer block was selected to fix the top of the specimen. After the specimen was fixed, the confining-pressure chamber was closed, and liquid injection was initiated. During the experiment, the confining pressure was applied under force control at a rate of 0.1 MPa/s, and the axial load was applied under displacement control at a rate of 0.2 mm/min until the specimen failed. Three parallel tests were conducted for each specimen type under each confining-pressure level.
Fig. 9Stress-strain curves and failure modes of concrete under different confining pressures
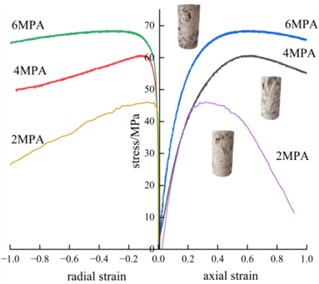
As shown in Fig. 9, confining pressure had a significant influence on the peak stress and failure mode of concrete. Under a confining pressure of 2 MPa, the stress-strain curve exhibited typical brittle characteristics, with a peak stress of approximately 45.9 MPa at an axial strain of 0.2 %, which is similar to the behavior observed under uniaxial compression. After reaching the peak, the stress drops rapidly, and the failure mode is characterized by brittle fracture accompanied by local shear bands, radial expansion, and rapid microcrack propagation.
Under a confining pressure of 4 MPa, the confinement effect became prominent: at an axial strain of 0.6 %, the peak stress rose to 60.8 MPa, representing an increase of 25 % compared with that under a confining pressure of 2 MPa. A short plateau region appeared after the peak, and the failure mode transitioned to a ductile mode with the development of multiple cracks.
Under a confining pressure of 6 MPa, the concrete exhibited strain-hardening behavior: at an axial strain of 0.7 %, the peak stress reached 68.4 MPa, representing an increase of 33 % compared with that under a confining pressure of 2 MPa. After the peak, the stress decayed slowly, and the failure mode is characterized by plastic flow under uniform compression.
2) SHPB compression test and result analysis.
The dynamic compression tests were conducted using the SHPB system at the Impact and Structural Dynamics Laboratory of Nanyang Normal University. In this experiment, the specimens, as well as the projectile, incident bar, transmission bar, and energy absorption bar, were all cylindrical with a diameter of 75 mm, and the length of the projectile was 800 mm. The projectile, incident bar, and transmission bar were all made of high-strength alloy steel. Strain gauges mounted on the incident and transmission bars were used to record the incident, reflected, and transmitted waves, and the dynamic stress–strain curves were reconstructed from the measured wave signals.
Fig. 10Device diagram of SHPB experimental system
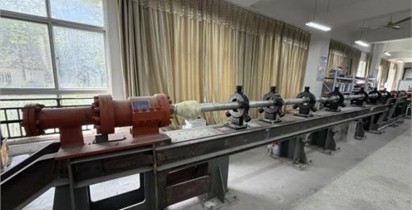
For the concrete SHPB impact tests, cylindrical specimens with dimensions of Φ75 mm × 25 mm were fabricated. The average loading strain rates ranged from 80 s-1 to 160 s-1, and the specific test conditions were presented in Table 3.
Table 3Impact test concrete working conditions
Speed (m/s) | Strain rate (s-1) | Number of specimens (piece) | Concrete size (mm) |
3.33 | 82 | 3 | 75×25 |
4.72 | 120 | 3 | 75×25 |
5.43 | 155 | 3 | 75×25 |
Fig. 11Stress-strain curves of concrete under different strain rates
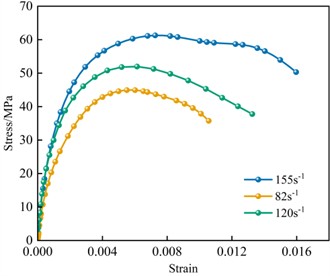
Fig. 11 presents the stress-strain curves of concrete under different strain rates. It could be observed that the peak strengths at average strain rates of 82 s-1, 120 s-1, and 155 s-1 are 121 %, 141 %, and 202 % higher than the quasi-static uniaxial compressive strength, respectively. This indicates that the concrete strength increases significantly with increasing strain rate.
3.3.2. Determination process of yield surface parameters
When the influence of strain rate is not considered, the yield surface equation in Eq. (8) can be transformed into the static failure surface equation:
where σ* is the dimensionless equivalent stress; is the normalized cohesive strength; is the normalized pressure hardening factor; is the dimensionless hydrostatic pressure; is the concrete damage parameter; and is the pressure hardening index. The physical meaning of Eq. (13) is that the failure strength of the material is jointly determined by the cohesive strength weakened by damage and the pressure-hardening effect. Its theoretical basis is derived from the linearized form of the Drucker-Prager criterion, and it extends to damage mechanics by introducing the damage variable . The term under the square root in Eq. (14) corresponds to the second invariant of the deviatoric stress tensor, and the denominator provides the normalization. Under uniaxial compression, substituting gives 1. The normalization design of Eq. (15) correlates the hydrostatic pressure with the compressive strength of the material, and under uniaxial compression.
During the static loading process, concrete reaches its maximum strength, and the material undergoes the elastic and yield stages. Due to the compression of internal pores, the concrete incurs partial damage. Zhang et al. [34] obtained the damage degree 0.6594 at failure from the uniaxial compression failure strength of 48 MPa concrete and generalized it to other cases. This value of was adopted in this paper. First, was solved. To this end, the corresponding normalized equivalent stress and normalized hydrostatic pressure were calculated using the triaxial equi-tensile strength , uniaxial compressive strength, and a set of triaxial data under a confining pressure of 2 MPa. Substituting the three obtained data sets and the determined value into Eq. (13), the system of equations can be written as:
From the calculated values of , and , 0.298 was selected. In the second step, using 0.298 and the two sets of triaxial confining-pressure strength test values mentioned earlier: 0.611 and 1.633 under 4 MPa, and 0.856 and 1.967 under 6 MPa, the parameters and were refitted, resulting in 1.9963 and 0.6961.
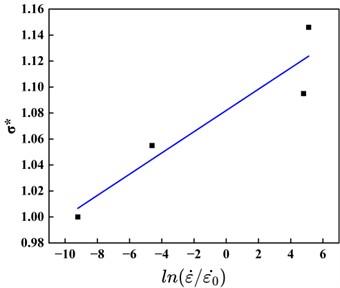
The strain-rate coefficient was calculated from the static and dynamic compressive strengths. The compressive strengths of C30 concrete at different strain rates were obtained through SHPB tests, as shown in Table 4. Under dynamic loading, the increase in material strength is jointly affected by the strain-rate effect and hydrostatic pressure. When determining parameter , it is first necessary to eliminate the influence of hydrostatic pressure. As shown in Fig. 12, starting from the maximum normalized tensile strength of concrete , lines corresponding to different strain rates were drawn through the data points in Table 4. A vertical line was drawn at 1/3 to intersect with the lines corresponding to different strain rates at four points, which represent the normalized strengths after eliminating the influence of hydrostatic pressure at different strain rates. The normalized equivalent stress of each intersection point and the corresponding strain-rate data were subjected to linear fitting, and a relationship curve with is plotted. As shown in Fig. 13, the slope of the fitted line is the strain-rate coefficient , with 0.0081.
represents the maximum value of the normalized equivalent stress can reach. In most parameter sensitivity analyses, this parameter is insensitive to the dynamic response.
Table 4Mechanical parameters of concrete under different strain rates
Strain rate | Compressive strength | ||
10 s-4 | 26.5 | 1.000 | 0.333 |
10 s-2 | 35.12 | 1.059 | 0.353 |
82 s-1 | 41.2 | 1.555 | 0.518 |
120 s-1 | 55.7 | 2.102 | 0.701 |
Fig. 12The relationship between equivalent stress and hydrostatic pressure under different strains
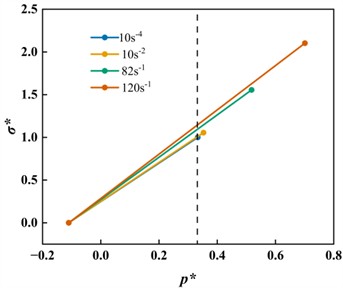
Fig. 13The relationship between the uniaxial compressive strength of concrete and the strain rate
3.4. Determination of state equation parameters
The equation of state of concrete reflects the change in the relationship between pressure and volume during the compression.
In the HJC model, the equation of state of concrete is divided into three regions, namely the elastic region, the transition region, and the compaction region, including seven parameters: , , , , , , and .
The specific determination process is as follows: is the hydrostatic pressure at the elastic limit, and is the corresponding volumetric strain:
Substituting gives 8.83 MPa, 0.00044.
The compaction stage parameters , , , ,and can be determined by plate impact tests. In this paper, the research results on the equation of state parameters of C25 concrete by Sun Yuxiang et al. [35] were adopted, where 56.34 GPa, –363.96 GPa, 1689.5 GPa, 0.171 and 0.9. The experimental principle is as follows:
A concrete flyer is used to impact an oxygen-free copper target plate, and the initial velocity of the flyer and the particle velocity of the copper target are accurately recorded using a Doppler probe system (DPS). Based on the one-dimensional strain elastoplastic wave theory, given the bulk wave velocity of the copper target, the particle velocity upon impact, and the slope of the relationship between the shock-wave velocity and particle velocity, the actual propagation velocity of the shock wave in the copper target can be obtained from the equation of state .
The propagation of the shock wave in the oxygen-free copper target plate satisfies the Hugoniot jump conditions, and the impact Hugoniot stress in the target plate can be calculated using the formula . Due to the continuity of the impact interface between the flyer and the target plate, the Hugoniot stress, which is also the Hugoniot stress in the concrete flyer, is approximately equal to the hydrostatic pressure of the concrete under one-dimensional strain conditions. By applying the Hugoniot jump conditions to the concrete flyer, the wave velocity and particle velocity in the flyer can be calculated, respectively.
The shock adiabat of concrete can be fitted from the experimental data using the shock adiabatic relationship of concrete materials to obtain the coefficients and . Then, the pressure-volume strain () relationship is calculated using the mass-momentum conservation relations, and the density and volume strain corresponding to each hydrostatic pressure value in the experiment can be calculated as follows:
To obtain a cubic polynomial relationship between pressure and volumetric strain without a constant term, the pressure-volumetric strain relationship in the compaction stage is corrected to the pressure-compacted volumetric strain relationship. The HJC model states that the compacted density of concrete is the density at which concrete voids are completely collapsed. Its value can be calculated based on the concrete porosity (which can be obtained by the water saturation method) as Based on this, the compacted volume strain is defined and the relationship in the compaction stage is corrected, where . Finally, the coefficients in the cubic polynomial were determined by fitting, and the compaction starting pressure was determined from the intersection with the straight line of the original HJC transition stage.
3.5. Determination of damage parameters
This study investigated the stiffness degradation behavior and damage evolution characteristics of C30 concrete under repeated loading through uniaxial cyclic loading tests and calibrated the damage parameters , and EFMIN in the HJC model.
3.5.1. Experiment overview and result analysis
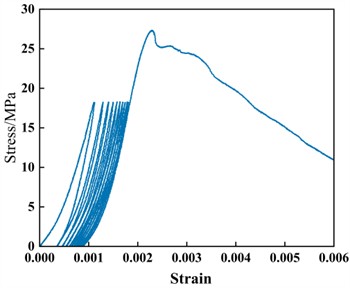
The experimental equipment was the same as that used in the uniaxial compression test. The Փ50 mm × 100 mm specimens were mounted and then fixed on the loading platform. In this cyclic loading test, displacement control was adopted, with a loading and unloading rate of 0.2 mm/min. Ten cycles were performed at the same stress level corresponding to 70 % of the peak stress. After ten cycles, the specimens were loaded at a rate of 0.2 mm/min until failure. The elastic modulus and residual plastic strain during each unloading stage were recorded until the final failure of the specimens. The equivalent plastic strain at failure and the stress-strain curve were also recorded.
The deformation characteristics of the complete stress-strain curve obtained from the uniaxial cyclic loading-unloading tests can be divided into three stages: the initial main deformation stage, the stable deformation stage, and the late accelerated deformation stage. As shown in Fig. 14, the cyclic loading-unloading stress-strain curves of the specimens mainly underwent a transition from sparse to dense, without reaching the accelerated deformation stage. The transition of the cyclic loading-unloading stress-strain curves of the specimens from sparse to dense occurs because concrete is a heterogeneous material containing randomly distributed micropores and microcracks. After being subjected to the previous loading level and then unloaded, the specimens cannot fully recover to their initial state, thereby forming hysteresis loops. The strain corresponding to each hysteresis loop of the specimen includes an elastic component and a residual component.
Fig. 14The stress-strain curve of concrete under uniaxial cyclic loading and unloading experiments
3.5.2. Process of determining damage parameters
Based on the dynamic constitutive model of concrete proposed by Holmquist and Johnson, the cumulative expression for the damage variable is:
In this paper, the damage variable is characterized by the degradation of the elastic modulus, where is the initial elastic modulus and is the elastic modulus after the -th unloading. Then, the values of and in each cycle were calculated according to Eq. (23) and (24). As obtained above, 0.33 and 0.12 under uniaxial compression, so 0.12 is a constant value of 0.45. Finally, , and EFMIN are fitted according to Eqs. (21) and (22).
The residual plastic strain increment is calculated from the unloading segment using the elastic modulus :
where is the total strain.
The volumetric strain is characterized by the axial and transverse strains as follows:
where is the axial strain, and is the plastic strain.
Based on the cited literature, the specific steps are as follows: Using the uniaxial cyclic loading-unloading test data in Table 5, the least-squares method was adopted to fit and , and the MATLAB lsqnonlin function was used for automatic optimization. After optimization, 0.0382 and 0.95 were obtained. The optimized and were substituted back into Eq. (21) to calculate the damage variable , which was then compared with the experimental . A high degree of curve agreement was found, indicating a good fit. The determined and were substituted into Eq. (22) to obtain EFMIN = 0.018. This is close to the values of 0.04, 1, and EFMIN = 0.01 for 48 MPa concrete reported in the original literature. Subsequent experiments have proven that this damage parameter was reasonable.
Fig. 15Comparison diagram of fitting effects
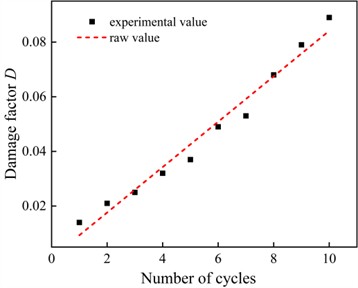
Table 5Results of uniaxial cyclic loading and unloading experiments of concrete
Cycle index | Peak stress / MPa | Elastic modulus of unloading segment / GPa | |||
1 | 18.2 | 21.45 | 0.036 | 0.020 | 0.014 |
2 | 18.2 | 21.31 | 0.010 | 0.016 | 0.021 |
3 | 18.2 | 21.22 | 0.009 | 0.010 | 0.025 |
4 | 18.2 | 21.07 | 0.007 | 0.009 | 0.032 |
5 | 18.2 | 20.95 | 0.005 | 0.008 | 0.037 |
6 | 18.2 | 20.70 | 0.006 | 0.005 | 0.049 |
7 | 18.2 | 20.61 | 0.004 | 0.006 | 0.053 |
8 | 18.2 | 20.30 | 0.004 | 0.005 | 0.068 |
9 | 18.2 | 20.06 | 0.004 | 0.004 | 0.079 |
10 | 18.2 | 19.84 | 0.003 | 0.003 | 0.089 |
Destruction | 27.8 | – | – | – | – |
3.6. Determination of software parameters
The parameter is used to normalize the strain rate. Its original value is taken as 1 s-1. In the simulation, when the value ranges from 1 to 100 s-1, it was found that the simulation results of various indicators do not differ significantly. Therefore, the original value of 1 s-1 was used here.
The parameter defines the equivalent plastic strain threshold for concrete at tensile/shear failure, which is used to control the failure mode of the concrete material. Johnson reported that the value range of is usually between 0.01 and 0.05. Through simulation, it was found that when is set to 0.02, the simulation results are in the best agreement with the experimental results.
Thus, all the parameters required for the HJC model of C30 concrete were obtained, as shown in Table 6.
Table 6HJC model parameters of C30 concrete
/ MPa | EFMIN | ||||||||
0.298 | 1.9963 | 0.6961 | 0.0081 | 3.48 | 7.0 | 0.018 | 0.0382 | 0.95 | 0.171 |
/ GPa | / GPa | / GPa | / MPa | / GPa | / kg·m3 | / s-1 | |||
8.83 | 56.34 | –363.96 | 1689.50 | 31.5 | 15.21 | 2347 | 1.0 | 0.02 | 0.00044 |
4. Numerical simulation verification of model parameters
4.1. Establishment of the SHPB finite element model
4.1.1. Establishment of the geometric model and mesh generation
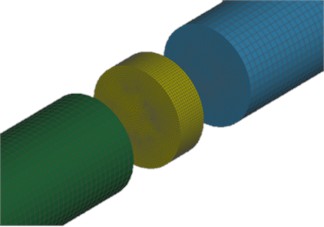
The SHPB model was established based on the dimensions of the laboratory SHPB experimental equipment and specimens mentioned earlier. The projectile length was 800 mm, the incident bar length was 4000 mm, and the transmission bar length was 3000 mm. All the above bars had a diameter of 75 mm, and the projectile, incident bar, and transmission bar were modeled as coaxial cylinders. The concrete cylindrical specimen had a diameter of 75 mm and a height of 25 mm. For mesh generation, the 3D SOLID164 hexahedral element was adopted. The mesh size of the projectile and bars was 5 mm, and the mesh size of the specimen was 2 mm. Mesh refinement with eight equal divisions was performed on each contact surface, as shown in Fig. 16.
Fig. 16Local mesh division diagram
4.1.2. Loading method and material model
The loading method was the same as that used in the experiment, where a certain initial velocity was assigned to the projectile to make it impact the incident bar, thereby generating and transmitting strain waves in the pressure bar.
Both the projectile and pressure bars used the linear elastic material model *MAT_ELASTIC from the LS-DYNA material library, with a density of 7800 kg/m3, an elastic modulus of 210 GPa, and a Poisson's ratio v of 0.3. The pulse shaper was modeled as a metal pulse shaper and used the kinematic plastic material model *MAT_PLASTIC_KINEMATIC, with a density of 9000 kg/m3, an elastic modulus of 120 GPa, a Poisson's ratio of 0.35, a yield strength of 400 MPa, and a tangent modulus of 20 GPa. For the concrete part, the HJC constitutive model from the LS-DYNA material library was selected and combined with the principal strain erosion failure criterion *MAT_ADD_EROSION to delete failed elements in the numerical simulation.
4.1.3. Contact types and calculation settings
In the SHPB concrete dynamic compression test, the commonly used contact type is surface-to-surface contact. In this model, the contact between the projectile and the incident bar was set as AUTOMATIC_SURFACE_TO_SURFACE, and the contact between both ends of the specimen and the bars was set as ERODING_SURFACE_TO_SURFACE. The contact surfaces were defined as frictionless, and the penalty-function contact algorithm was used to reduce numerical instability.
4.2. Comparative analysis of concrete damage under impact loading
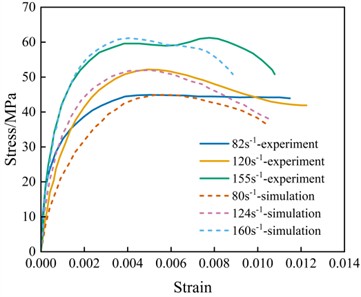
Comparative analysis indicated that the stress-strain curves from the numerical simulation agreed well with the experimental measurements, indicating that the HJC model could be used to simulate the concrete SHPB test. Concrete exhibits different characteristics in the dynamic failure process at different strain rates. For brevity, only the cases at strain rates of 82 s-1 and 124 s-1 are analyzed herein.
4.2.1. Comparison of specimen failure results
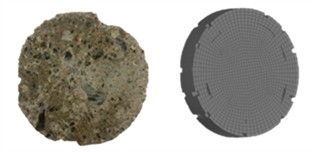
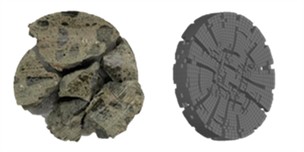
Fig.17 shows the experimental and simulated failure results at strain rates of 80 s-1 and 124 s-1.
Fig. 17Failure modes of concrete at different strain rates
a) Minor cracks
b) Fracture
When the strain rate reached 80 s-1 (Fig. 17(a)), the integrity of the specimen was generally maintained, with slight erosion and a small number of microcracks appearing on the surrounding surfaces. When the strain rate is further increased to 124 s-1 (Fig. 17(b)), the specimen undergoes structural failure, showing a core-retention phenomenon. The failure progresses from the periphery to the center, and relatively large spalled fragments can also be observed.
4.2.2. Analysis of the failure process of the specimen
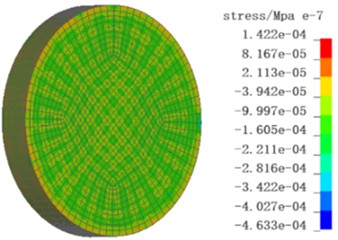
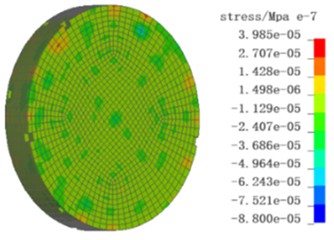
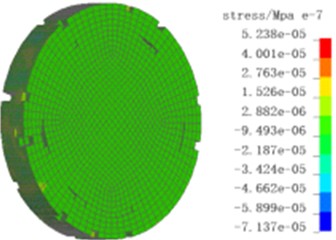
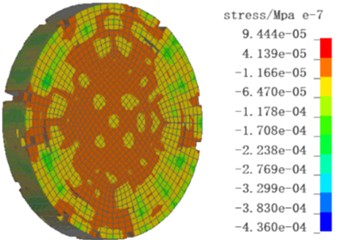
(1) Damage process at a strain rate of 80 s-1. The stress wave reached the front end of the specimen at 951 μs. At 1290 μs, damage and failure began to appear around the front and rear ends of the specimen. At 1360 μs, radial cracks appeared on the side surface of the specimen. At 2000 μs, cracks on the side and end faces of the specimen increased significantly. After the impact test, the entire specimen still retained a certain degree of integrity.
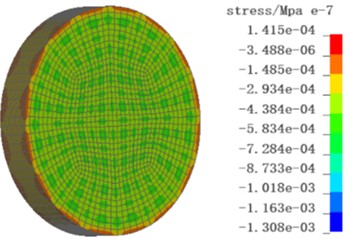
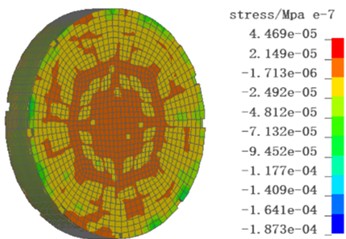
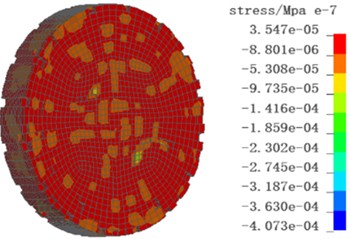
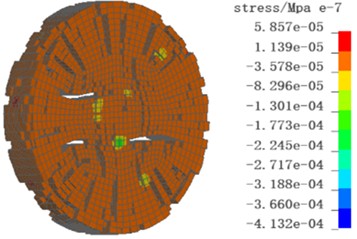
(2) Damage process at a strain rate of 124 s-1. The stress wave reached the front end of the specimen at 950 μs. At 1055 μs, damage and failure began to appear around the front and rear ends of the specimen. At 1085 μs, radial cracks appeared on the side surface of the specimen. At 1155 μs, many cracks started to appear around the end face of the specimen and propagate toward the center. The specimen broke into relatively larger fragments, showing a core-retention phenomenon.
As shown in the above figures, in the concrete SHPB impact test, the failure mode of the specimen was mainly tensile failure along the axial direction. The analysis suggests that the side surface of the specimen is a free surface, and the compressive wave forms a tensile wave after reflection. Although the tensile stress is not high, it can easily cause tensile failure in concrete because of its low tensile strength. When the impact velocity is low, cracks appear on the end faces and side surfaces of the specimen, but a certain degree of integrity is still retained, as shown in Fig. 18. When the velocity increases, the specimen breaks into relatively larger fragments, and the failure progresses from the periphery to the center, showing a core-retention phenomenon, as shown in Fig. 19.
Fig. 18The impact failure process of concrete with a strain rate of 80 s-1
a) 951 μs
b) 1290 μs
c) 1360 μs
d) 2000 μs
Fig. 19The diagram of the impact failure process of concrete with a strain rate of 124 s-1
a) 951 μs
b) 1055 μs
c) 1085 μs
d) 1155 μs
4.3. Comparative analysis of stress-strain curves
The stress-strain curves of C30 concrete specimens were reconstructed using the two-wave method and compared with the experimental results, as shown in Fig. 20, where the solid lines represent the experimental curves and the dashed lines represent the simulation results corresponding to different strain-rate conditions. Due to the unavoidable errors in SHPB tests and the inherent complexity of concrete materials, the stress-strain curves from numerical simulations cannot completely coincide with the test waveforms. As shown in Table 7, all simulation errors are less than 5 %. The above results indicate that the modified HJC constitutive model parameters can accurately and effectively reproduce the dynamic mechanical properties of C30 concrete under impact compression loading.
Table 7Comparison of errors between experiments and simulations
Strain rate | Experiment 82 s-1 | Simulation 80 s-1 | Experiment 120 s-1 | Simulation 124 s-1 | Experiment 155 s-1 | Simulation 160 s-1 |
Peak stress | 44.3 | 44.9 | 51.4 | 52.1 | 59.8 | 61.4 |
Error | 1.3 % | 1.4 % | 2.6 % | |||
Peak strain | 0.0057 | 0.0059 | 0.0050 | 0.0052 | 0.0037 | 0.0038 |
Error | 3.4 % | 3.8 % | 2.7 % | |||
Fig. 20Simulation and experimental stress-strain curves of concrete under different strain rates
4.4. Identification of key HJC parameters
Although the HJC model contains 21 parameters, their influences on the dynamic response of concrete differ. Based on the physical meaning of the model parameters and the numerical verification results of the SHPB tests, the key parameters affecting the dynamic response of C30 concrete were identified as , , , , , and .
The parameters , , and determine the pressure-dependent yield surface of the HJC model. Therefore, they directly affect the compressive strength, pressure-hardening behavior, and peak stress of concrete under dynamic loading. Among them, represents the normalized cohesive strength, while and control the pressure-hardening effect. The strain-rate parameter controls the dynamic increase in strength and is therefore important for reproducing the strain-rate effect observed in the SHPB tests.
The damage parameters and mainly control damage accumulation, post-peak softening behavior, failure strain, and the element erosion process. These two parameters have a smaller influence on the initial elastic response, but they are important for describing the progressive failure and damage evolution of concrete specimens under impact loading.
Compared with the above parameters, the basic physical parameters, such as density, shear modulus, and tensile strength, are necessary input parameters but can be obtained directly from physical and static mechanical tests. The equation-of-state parameters mainly affect the volumetric compaction response under high hydrostatic pressure. Under the low and medium-strain-rate SHPB loading conditions considered in this study, their influence on the peak stress-strain response is relatively limited compared with , , , , , and . Therefore, , , , , , and should be regarded as the key parameters for predicting the dynamic response of C30 concrete in this study.
5. Limitations
Although the calibrated HJC parameters can reasonably reproduce the dynamic response of C30 concrete in the SHPB tests, this study still has several limitations. First, the parameters are mainly applicable to the tested C30 concrete with the specific mix proportion and curing conditions used in this study, and their applicability to other concrete strength grades requires further verification. Second, the SHPB tests were conducted within a low-and medium-strain-rate range of approximately 80-160 s-1, so further validation is needed for extremely high strain-rate conditions such as strong blast loading or high-velocity penetration. Third, some equation-of-state parameters were obtained from existing plate impact data for similar concrete materials, which may introduce uncertainty under very high hydrostatic pressure. Finally, the numerical verification was performed at the specimen scale, while the mesoscopic heterogeneity of concrete was not explicitly considered. These issues will be further investigated in future work.
6. Conclusions
In this study, the 21 parameters of the HJC model were categorized into five groups: basic physical parameters, yield surface parameters, equation-of-state parameters, damage parameters, and software-related parameters. A set of model parameters applicable to C30 concrete was determined by combining relevant tests, theoretical derivations, and findings from literature. Furthermore, within the strain rate range of 80-160 s-1, split Hopkinson pressure bar tests and numerical simulation of concrete were conducted. Based on the experimental and numerical simulation results, the following conclusions can be drawn:
1) A complete set of HJC model parameters for C30 concrete was determined through a series of laboratory tests. The basic physical parameters were obtained from uniaxial compression tests: 26.5 MPa; the initial density 2347 kg/m3 was measured using the volumetric method; the elastic modulus 43.33 GPa and Poisson’s ratio 0.18 were obtained by fitting data from the elastic segment of the uniaxial compression curve; and the tensile strength 3.19 MPa was derived using empirical formulas.
The yield surface parameters were calibrated by combining conventional triaxial compression test data with uniaxial compression data, resulting in 0.298, 1.9963, and 0.6961. Based on SHPB dynamic tests, the strain-rate parameter 0.0081 was obtained by fitting after eliminating the influence of hydrostatic pressure. The damage parameters were optimized and fitted using data on elastic modulus degradation and plastic strain accumulation from uniaxial cyclic loading-unloading tests, yielding 0.0382, 0.95, and EFMIN = 0.018.
2) The parameters of the elastic segment in the equation of state, 8.83 MPa and 0.00044, were derived from uniaxial compression data combined with formula calculations. For the compaction-stage parameters, this paper summarized a method based on plate impact tests, with 56.34 GPa, –363.96 GPa, 1689.5 GPa, 0.171 and 0.9. The software parameters were determined through simulation calibration as 1 s-1 and 0.02.
3) The concrete stress-strain curves obtained from the numerical simulation of the SHPB tests using this set of HJC constitutive model parameters were in good agreement with the experimental curves. The errors in peak strain and peak strength between the experiment and simulation did not exceed 5 %, indicating that the model can accurately reproduce the dynamic mechanical response of C30 concrete under impact compression loading. The maximum principal strain failure criterion effectively described the core-retention failure phenomenon of the specimen.
4) From an engineering perspective, the calibrated HJC parameters can be used as material input parameters for numerical simulations of C30 concrete structures subjected to impact and blast loading. Compared with directly adopting the default HJC parameters, the parameters determined in this study can better reflect the strength level, strain-rate effect, and damage evolution characteristics of ordinary C30 concrete. Therefore, the proposed parameter set can provide a reference for the dynamic analysis and protective design of C30 concrete members, tunnel linings, and impact-resistant structures.
References
-
J. Zhou, X. Gao, and C. Liu, “Optimization of mix design of micro-concrete for shaking table test,” (in Korean), Advances in Concrete Construction, Vol. 13, No. 3, pp. 215–221, 2022, https://doi.org/10.12989/acc.2022.13.3.215
-
S. Viswanath, J. M. Lafave, and D. A. Kuchma, “Concrete compressive strain behavior and magnitudes under uniaxial fatigue loading,” Construction and Building Materials, Vol. 296, p. 123718, Aug. 2021, https://doi.org/10.1016/j.conbuildmat.2021.123718
-
Y. Du, J. Wei, K. Liu, D. Huang, Q. Lin, and B. Yang, “Research on dynamic constitutive model of ultra-high performance fiber-reinforced concrete,” Construction and Building Materials, Vol. 234, p. 117386, Feb. 2020, https://doi.org/10.1016/j.conbuildmat.2019.117386
-
J. H. Kee, J. Y. Park, and J. H. Seong, “Effect of one-way reinforced concrete slab characteristics on structural response under blast loading,” (in Korean), Advances in Concrete Construction, Vol. 8, No. 4, pp. 277–283, 2019, https://doi.org/10.12989/acc.2019.8.4.277
-
G. R. Johnson and T. J. Holmquist, “An improved computational constitutive model for brittle materials,” in AIP Conference Proceedings, Vol. 309, No. 1, pp. 981–984, 1994, https://doi.org/10.1063/1.46199
-
M. Abedini and C. Zhang, “Performance assessment of concrete and steel material models in LS-DYNA for enhanced numerical simulation: A state-of-the-art review,” Archives of Computational Methods in Engineering, Vol. 28, No. 4, pp. 2921–2942, 2020, https://doi.org/10.1007/s11831-020-09483-5
-
B. Chen and Q. M. Li, “About the strain-rate effect in HJC model,” International Journal of Impact Engineering, Vol. 195, p. 105132, Jan. 2025, https://doi.org/10.1016/j.ijimpeng.2024.105132
-
C. D. Lou, R. Zhang, L. Ren, J. F. Zhou, Y. Peng, and Z. T. Zhang, “Determination and numerical simulation for HJC constitutive model parameters of Jinping marble,” IOP Conference Series: Earth and Environmental Science, Vol. 861, No. 3, p. 032074, Oct. 2021, https://doi.org/10.1088/1755-1315/861/3/032074
-
X. Tian, T. Tao, Q. Lou, and C. Xie, “Modification and application of limestone HJC constitutive model under the impact load,” Lithosphere, Vol. 2021, No. Special 7, Mar. 2022, https://doi.org/10.2113/2022/6443087
-
L. Yan, L. Chen, B. Chen, and Q. Fang, “Analysis and evaluation of suitability of high-pressure dynamic constitutive model for concrete under blast and impact loading,” International Journal of Impact Engineering, Vol. 195, p. 105145, Jan. 2025, https://doi.org/10.1016/j.ijimpeng.2024.105145
-
J. Liu and J. Zhang, “A modified HJC model for geological materials subjected to blasting loadings,” Structures, Vol. 58, p. 105483, Dec. 2023, https://doi.org/10.1016/j.istruc.2023.105483
-
X. Long, A. Turgun, R. Yue, Y. Ma, and H. Luo, “Influence factors analysis of RC beams under falling weight impact based on HJC model,” Shock and Vibration, Vol. 2018, No. 1, pp. 1–16, Oct. 2018, https://doi.org/10.1155/2018/4731863
-
H. Xu and H. M. Wen, “A computational constitutive model for concrete subjected to dynamic loadings,” International Journal of Impact Engineering, Vol. 91, pp. 116–125, May 2016, https://doi.org/10.1016/j.ijimpeng.2016.01.003
-
M. Polanco-Loria, O. S. Hopperstad, T. Børvik, and T. Berstad, “Numerical predictions of ballistic limits for concrete slabs using a modified version of the HJC concrete model,” International Journal of Impact Engineering, Vol. 35, No. 5, pp. 290–303, May 2008, https://doi.org/10.1016/j.ijimpeng.2007.03.001
-
G.-M. Ren, H. Wu, Q. Fang, and X.-Z. Kong, “Parameters of Holmquist-Johnson-Cook model for high-strength concrete-like materials under projectile impact,” International Journal of Protective Structures, Vol. 8, No. 3, pp. 352–367, 2017, https://doi.org/10.1177/2041419617721552
-
L. Ren, X. Yu, M. Zheng, Z. Xue, B. Wu, and Y. He, “Evaluation of typical dynamic damage models used for UHPC based on SHPB technology,” Engineering Fracture Mechanics, Vol. 269, p. 108562, Jun. 2022, https://doi.org/10.1016/j.engfracmech.2022.108562
-
B. Sun et al., “Peridynamics-based reformulation of HJC constitutive model for concrete failure analysis under impact,” International Journal of Impact Engineering, Vol. 201, p. 105269, Jul. 2025, https://doi.org/10.1016/j.ijimpeng.2025.105269
-
G. L. Wu and H. Wang, “Nonlinear correction of elastic section in HJC constitutive model,” International Journal of Impact Engineering, Vol. 189, p. 104955, Jul. 2024, https://doi.org/10.1016/j.ijimpeng.2024.104955
-
K. Liu, C. Wu, X. Li, Q. Li, J. Fang, and J. Liu, “A modified HJC model for improved dynamic response of brittle materials under blasting loads,” Computers and Geotechnics, Vol. 123, p. 103584, Jul. 2020, https://doi.org/10.1016/j.compgeo.2020.103584
-
Z. Wang, Y. Ni, J. Wang, and S. Li, “Improvement and performance analysis of constitutive model for rock blasting damage simulation,” Simulation Modelling Practice and Theory, Vol. 138, p. 103043, Jan. 2025, https://doi.org/10.1016/j.simpat.2024.103043
-
I. M. A. Kamran, “A new material model for concrete subjected to high rate of loading,” International Journal of Impact Engineering, Vol. 180, p. 104673, Oct. 2023, https://doi.org/10.1016/j.ijimpeng.2023.104673
-
G. Ren, H. Wu, H. Dong, and F. Huang, “Prediction of dynamic response of high-strength concrete based on the modified constitutive model,” Computers and Structures, Vol. 305, p. 107515, 2024, https://doi.org/10.1016/j.compstruc.2024.107515
-
J. Dong et al., “Experimental characterization and numerical simulation of dynamic compression behavior of multi-mica granite (MMG),” Structures, Vol. 71, p. 108001, Jan. 2025, https://doi.org/10.1016/j.istruc.2024.108001
-
A. Wan, T. Tao, X. Tian, C. Xie, and J. Jia, “Calculation method of HJC constitutive model parameters of natural joint angle slate,” Scientific Reports, Vol. 13, No. 1, Sep. 2023, https://doi.org/10.1038/s41598-023-42544-w
-
S. Wei, J. Li, M. Wang, and C. Yu, “Parameter determination and numerical simulation of the sandstone HJC constitutive model,” ACS Omega, Vol. 10, No. 18, pp. 18744–18752, May 2025, https://doi.org/10.1021/acsomega.5c00300
-
B. Xie, Z. Yan, Y. Du, Z. Zhao, and X. Zhang, “Determination of Holmquist-Johnson-Cook constitutive parameters of coal: laboratory study and numerical simulation,” Processes, Vol. 7, No. 6, p. 386, 2019, https://doi.org/10.3390/pr7060386
-
H. Jia, T. Shen, Y. Zhao, F. Liu, W. Wu, and Q. Song, “Study on dynamic mechanical properties and damage evolution model of C80 concrete,” (in Korean), Advances in Concrete Construction, Vol. 20, No. 2, pp. 65–78, 2025, https://doi.org/10.12989/acc.2025.20.2.065
-
J. Liu, C. Liu, K. Qu, J. Li, and C. Wu, “Calibration of Holmquist Johnson Cook (HJC) model for projectile penetration of geopolymer-based ultra-high performance concrete (G-UHPC),” Structures, Vol. 43, pp. 149–163, 2022, https://doi.org/10.1016/j.istruc.2022.06.034
-
Y. Lv, H. Wu, H. Dong, H. Zhao, M. Li, and F. Huang, “Experimental and numerical simulation study of fiber-reinforced high-strength concrete at high strain rates,” Journal of Building Engineering, Vol. 65, p. 105812, 2023, https://doi.org/10.1016/j.jobe.2022.105812
-
Z. Bi, J. Liu, M. Zhao, and X. Cui, “Research on dynamic constitutive model of concrete material with different matrix strength under medium-high strain rates,” KSCE Journal of Civil Engineering, Vol. 29, No. 3, p. 100059, Mar. 2025, https://doi.org/10.1016/j.kscej.2024.100059
-
K. Zhai et al., “The impacts of CFRP widths and thicknesses on the strengthening of PCCP,” Structures, Vol. 56, p. 104856, Oct. 2023, https://doi.org/10.1016/j.istruc.2023.07.046
-
K. Zhai, H. Fang, N. Wang, B. Li, J. Dong, and B. Xue, “Mechanical response of concrete pipe rehabilitated by liner under external load: analytical solution,” International Journal for Numerical and Analytical Methods in Geomechanics, Vol. 48, No. 4, pp. 911–924, Dec. 2023, https://doi.org/10.1002/nag.3664
-
K. Zhai and I. D. Moore, “Mechanical study and equations for gravity flow pipe liners stretching across ring fractures or joints under shear action,” Ocean Engineering, Vol. 314, No. P1, p. 119721, Dec. 2024, https://doi.org/10.1016/j.oceaneng.2024.119721
-
R. Q. Zhang, Y. Q. Ding, W. H. Tang, and X. W. Ran, “Failure strength parameters of HJC and RHT concrete constitutive models,” (in Chinese), Chinese Journal of High Pressure Physics, Vol. 25, No. 1, p. 15, 2011, https://doi.org/10.11858/gywlxb.2011.01.003
-
Y. Sun et al., “Experiment and simulation on high-pressure equation of state for concrete,” Chinese Journal of Explosion and Shock Waves, Vol. 40, No. 12, 2020.
About this article

The authors acknowledge the funding support from the Henan Provincial Science and Technology Research Projects (No. 252102320207, 252102321016 and 262102320347) and Nanyang Normal University Doctoral Special Project (No. 2020ZX007, 2026QN019). Special thanks go to the faculty and postgraduates of the Structural Impact Laboratory for their help in operating the SHPB system and processing experimental data.
The datasets generated during and/or analyzed during the current study are available from the corresponding author on reasonable request.
Yu Wu: conceptualization, methodology, supervision, writing-review and editing. Tong Ye: investigation, data curation, formal analysis, visualization, writing-original draft preparation. Xiaoyang Wu: data curation, formal analysis, visualization. Jie Zhou: data curation, formal analysis, visualization.
The authors declare that they have no conflict of interest.

