Abstract
Gear transmission has a non-negligible influence on the dynamic responses and wheel wear of high-speed motor cars. This work analyzes the influence of the driving system on dynamic responses and wheel wear of high-speed motor cars during acceleration. Firstly, a fully nonlinear multibody system(MBS) is developed and various nonlinear factors, such as various types of dampers and wheel-rail contact relation, are considered, and the detailed gear transmission is also introduced to obtain the accurate dynamic responses. Secondly, a wheel wear prediction model integrating the Archard wear model and the vehicle dynamics system is established based on wheel tread update strategy of target speed, and wheel wear evolution of high-speed motor car is obtained in one re-profiling cycle, and simulation results are compared with the field measured data respectively to validate vehicle model and wheel wear prediction procedure. Finally, the effects of gearbox suspension rod stiffness and vertical motor suspension joint stiffness on dynamic responses and wheel wear during acceleration process are simulated respectively. The results show that as the gearbox suspension rod stiffness increases, the gearbox suspension force gradually increases, which not only suppresses the nodding motion of the gearbox but also reduces the absolute value of the longitudinal wheel creepage, resulting in the reduction of wear depth. Moreover, the difference between the dynamic response of high-speed motor cars with and without gear transmission is huge, which indicates that gear transmission is not negligible in the process of dynamics simulation and wheel wear prediction.
Highlights
- A detailed helical gear transmission model reveals that internal excitations from the driving system significantly influence the dynamic responses and wheel wear of high-speed motor cars, showing that such effects are non-negligible in simulations.
- Increasing the stiffness of the gearbox suspension rod suppresses gearbox nodding motion and reduces the absolute value of longitudinal wheel creepage, leading to a decrease in wheel wear depth during acceleration.
- Higher vertical stiffness of motor suspension joints increases longitudinal creepage and vertical vibration energy of the bogie, resulting in greater wheel wear depth, highlighting the importance of optimizing these parameters.
1. Introduction
Over the past decade of rapid high-speed train development in China, most vehicle dynamics issues have been closely linked to wheel wear [1]. Developing a predictive model for wheel wear is therefore essential for safety, economic, and operational reasons, as accurate estimation of wear rates plays a critical role in planning wheelset maintenance [2, 3].
Auciello et al. proposed a comprehensive model for evaluating wheel wear and profile evolution through dynamic simulations [4], and further investigated the influence of rail flexibility in wheel/rail wear prediction. In their approach, contact forces, creepages, and wheel/rail contact locations were computed using a multi-body system combined with three-dimensional contact formulations that incorporate rail flexibility [5]. Bosso and Zampieri proposed a Simpack-MATLAB co-simulation method that uses an innovative smoothing algorithm to enhance numerical stability when applying wear multipliers [6]. Luo applied a wear prediction model for high-speed trains to examine the effects of wheel/rail parameters within the speed range of 200-350 km/h [7]. In addition, he accurately predicted the evolution of wheel profile wear by accounting for stochastic wheel/rail interactions, including rail profiles, track geometries, track irregularities, and segment-specific interface characteristics [8].
However, most of the papers on wheel wear prediction do not consider the influence of the driving system. In these works on vehicle models considering the driving system, it is only limited to its impact on vehicle dynamic performance. Cui established the control models of motor bogies considering gear transmission and motor bogies without considering gear transmission and asynchronous traction motors and used Simpack and Matlab/Simulink to develop the mechatronic control simulation model, and the effect of the vibration characteristics of the transmission system on the longitudinal, lateral and vertical dynamics of the high-speed vehicle under operating conditions is analyzed [9]. Wei established a multi-degree-of-freedom dynamics analysis model for high-speed locomotives by considering the effects of various nonlinear factors such as time-varying meshing stiffness, tooth surface clearance, and bearing clearance, and quantitatively obtained the effects of parameters such as internal gear excitation, tooth surface clearance and bearing clearance on the high-speed locomotive [10]. Xu also established an overall vehicle dynamics model including the driving system and studied the effects of motor crane plate length, torsional stiffness and damping of coupling, suspension stiffness damping of the gearbox, and harmonic torque of the motor on the operating stability, critical speed, and safety of the motor car [11]. Sang developed a detailed high-speed train model comprising motor cars with gear transmission systems and trailer cars, and predicted the wheel wear evolution of motor cars during both long-term operation and acceleration processes [12, 13]. Qi established a high-speed EMU vehicle model to investigate the influence of motor harmonic torque on wheel wear. The simulations revealed that harmonic torque significantly affects the wheel-rail vertical force and longitudinal creep force, while exerting only a minor influence on the lateral creep force [14]. Alfi S reviewed criteria for nonlinear assessment of vehicle stability by simulating responses to random track irregularities. The study also examined the effect of elastic motor connections on the bogie frame through linear and nonlinear analyses, showing that the stiffness and damping characteristics of motor connections strongly influence vehicle stability [15]. Chen proposed a comprehensive locomotive–track coupled vertical dynamics model that incorporates the interactions between the gear transmission system and other components, such as the motor and wheelset, based on detailed structural analysis and working mechanisms. The findings indicate that excitations from both the wheel–rail contact interface and the gear mesh interface significantly affect the dynamic responses of components within this coupled system [16]. Yang further analyzed the effect of traction force on wheel wear, but considered only a constant motor force without modeling the full traction system [17]. Wang developed a vehicle model that included traction systems but did not explicitly examine the influence of the drive system on wheel wear [18]. Although these studies address the role of drive torque in wheel wear, they generally overlook the detailed structural aspects of the drive system, including gear pairs, flexible couplings, and traction motors.
In this work, to address the gap in existing wheel wear studies which often overlook the influence of the driving system, a fully nonlinear multibody system (MBS) model of a high-speed motor car is developed. Unlike prior models that simplify or omit the drivetrain, this model incorporates a detailed helical gear transmission system. This approach enables a direct investigation into the differences in dynamic response between simulations that include and exclude the drive system's internal excitations.
Furthermore, a novel wheel wear prediction framework is constructed by integrating the Archard wear model with the high-fidelity vehicle dynamics model. A key distinction from conventional methods is the implementation of a wheel tread update strategy based on target speed progression during acceleration, rather than distance traveled. The validity of this integrated model is then verified through comparison with field measurement data.
Finally, utilizing the developed and validated model, this study systematically simulates and analyzes the effects of two key suspension parameters – gearbox suspension rod stiffness and vertical motor suspension joint stiffness – on both the dynamic responses and the wheel wear of the high-speed motor car during the traction process.
2. Wheel wear prediction procedure
2.1. Vehicle system model
The simulation model developed in this study is based on the following core assumptions to ensure computational tractability while focusing on the primary mechanisms through which the driving system parameters influence wheel-rail wear:
1) Gear Transmission Dynamics: The time-varying meshing stiffness of the helical gear pair is calculated using empirical formulas and is considered a primary source of internal excitation within the driveline. The stiffness of the gearbox suspension rod and the motor suspension joints is treated as linear for the parametric studies conducted.
2) Wheel-Rail Contact Theory: The normal contact is governed by Hertzian contact theory, and the tangential creep forces are solved using Kalker’s FASTSIM algorithm. The wheel-rail profiles (LMB10 wheel tread with CNH60 rail) are assumed to remain unchanged within a single simulation cycle for the wear parameter analysis.
3) Wear Calculation Model: The Archard wear model is employed, which assumes that wear occurs only within the slip zone of the contact patch. The wear coefficient is selected from a pressure- and sliding-velocity-dependent function as defined by Jendel.
4) Operational Condition: The traction acceleration process follows the prescribed force-speed characteristic. Crucially, track irregularities were excluded in the parametric sensitivity analysis to isolate the effect of the driveline suspension parameters from random track excitations.
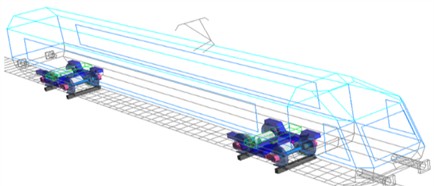
Based on the geometric structure and suspension parameters of a 400 km/h-class high-speed motor car in China, a detailed multi-body dynamics model was developed within the SIMPACK environment, as illustrated in Fig. 1(a). The model incorporates key components including wheelsets, axle boxes with swivel arms, bogie frames, car body, primary and secondary suspension systems, and a detailed drive system.
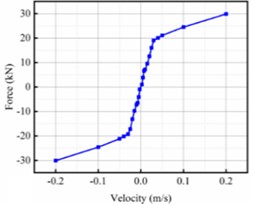
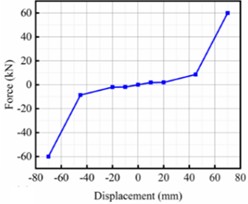
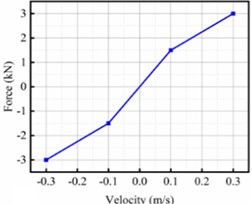
The secondary suspension system, supporting the car body on the two bogies, comprises large-capacity capsule-type flexible air springs and several hydraulic dampers. The primary suspension, connecting each bogie frame to the wheelsets, consists of axle box coil springs, rubber nodes, and primary vertical hydraulic dampers. A critical aspect of model fidelity is the detailed representation of nonlinear damping characteristics across multiple components. As depicted in Fig. 1(b), 1(c), and 1(d), dampers such as the yaw damper, lateral stops, and secondary lateral damper exhibit strong velocity-dependent nonlinear behavior, which is crucial for accurately capturing the vehicle's dynamic response, especially under large-amplitude motions or specific excitation frequencies. These nonlinearities are implemented based on experimentally obtained force-velocity curves to ensure model accuracy.
Table 1Calculation parameters of high-speed railway vehicle
Vehicle parameters | value | unit | |
Primary horizontal/vertical stiffness | / | 0.3/0.9 | MN/m |
Primary horizontal/vertical damping | / | 0.3/0.9 | kN/(m/s) |
Circumferential/transverse stiffness of rotating arm joint | / | 25/10 | MN/m |
Horizontal/vertical stiffness of air spring | / | 0.131/0.205 | MN/m |
Longitudinal distance of bogie centers | 17.5 | m | |
Wheelbase | 2.5 | m | |
Stiffness of gearbox suspension rod | 6 | MN/m | |
Damping of gearbox suspension rod | 6 | kN/(m/s) | |
Vertical stiffness of motor mounting node | 30 | MN/m | |
Lateral stiffness of attachment point of motor | 1.5 | MN/m |
The driving system of the motor bogie is configured in a rack-suspension layout, featuring a rear-mounted motor on the first axle and a front-mounted motor on the second axle, with further details provided in the following section. The degrees of freedom (DOFs) assigned include longitudinal, lateral, vertical, roll, pitch, and yaw motions for the car body, bogie frames, and wheelsets, while the axle boxes with swivel arms are assigned a pitch DOF.
Furthermore, an equivalent stiffness and damping track model was established. During simulations, the wheel-rail interface employs the LMB10 wheel profile matched with the CNH60 rail profile. Track irregularities are introduced using the measured JiaoJi spectrum. The wheel-rail contact interaction is solved utilizing Hertzian contact theory for normal forces and the FASTSIM algorithm for tangential creep forces. Key vehicle parameters are summarized in Table 1 [19].
Fig. 1Dynamic system: a) high-speed motor car; nonlinear characteristics of dampers: b) yaw damper; c) lateral stops; d) secondary lateral damper
a)
b)
c)
d)
2.2. Gear transmission
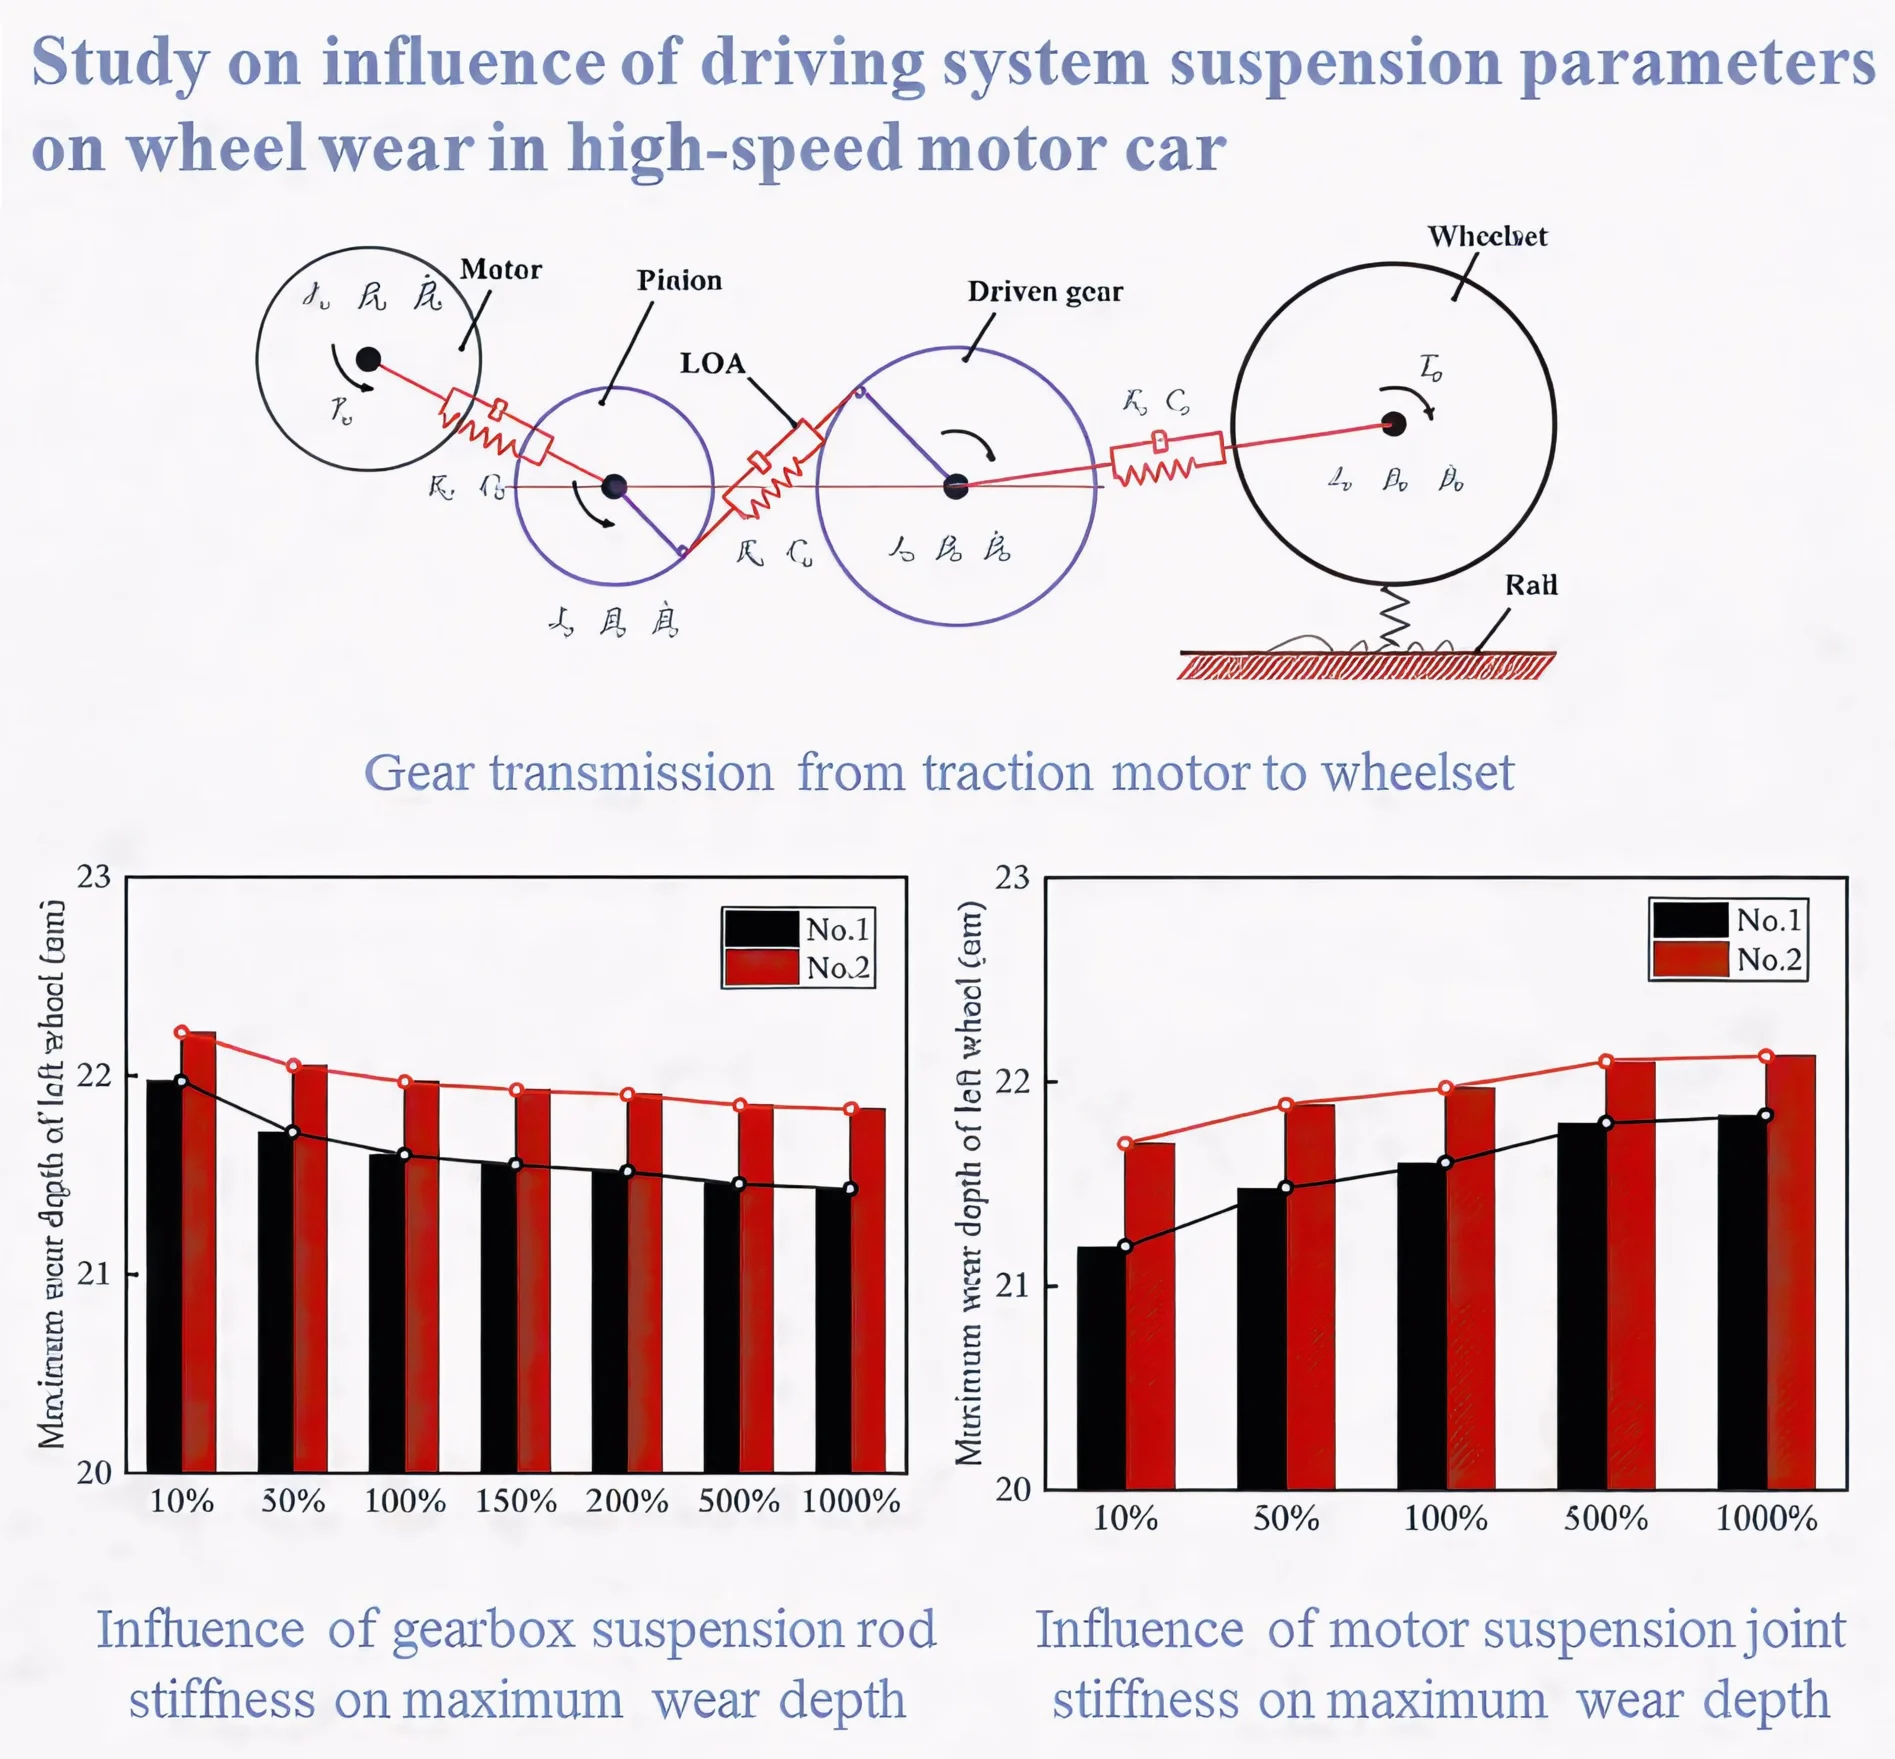
The gear transmission can convert the electrical energy from the pantograph into mechanical energy to drive the high-speed motor car forward, and then the motor car can pull the trailer car to achieve continuous operation, so the gear transmission has an important influence on the dynamic performance of the motor car. In the high-speed motor car model, a detailed single-stage helical gear transmission is established, and the parameters of the gear pairs are shown in Table 2.
Fig. 2Gear transmission from traction motor to wheelset
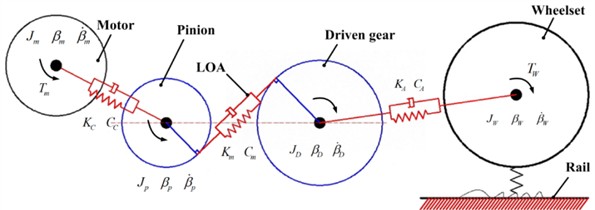
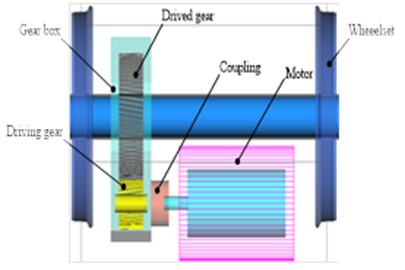
The traction motor is suspended from the frame by four rubber joints, and the output shaft of the traction motor and the pinion in the gearbox is connected by a flexible coupling that can adapt to the relative motion in all directions and transmit the torque. The gearbox is then suspended from the axle by two clamping bearings and is connected to the bottom of the frame using a gearbox suspension bar. The active gear inside the gearbox is coupled to the large gear fixed to the axle by a gear mesh. A detailed topology of the gear transmission from the motor to the wheelset is shown in Fig. 2.
Table 2Gear transmission system parameters
Specification | Normal module / mm | Number of teeth | Helix angle / rad | Pressure angle / rad | Center distance / mm | Blank of gear / mm | |
Pinion | Driven gear | ||||||
7 | 29 | 73 | 0.13 | 0.35 | 380 | 150 | |
During gear pair engagement, meshing stiffness serves as a key parameter, and the internal excitation it generates has a substantial influence on vehicle dynamic performance. The time-dependent variation of gear train meshing stiffness can be expressed by Eq. (1) [20]:
where denotes the general error function of the gears. The subscript corresponds to the tooth pair number experiencing the maximum flexible deformation at a given time, such that , where is the number of tooth pairs in contact. The total mesh force along the line of action (LOA) is represented by . The term refers to the single-tooth mesh stiffness of the tooth pair, which can be calculated using Eq. (2):
where represents the tooth bending stiffness resulting from tooth deflection, and denotes the stiffness associated with fillet-foundation deformation. The subscript corresponds to the pinion, while refers to the driven gear. Additionally, signifies the Hertzian contact stiffness. The frequency content of the dynamic system becomes more complex when excitations from the traction transmission system are considered. The gear mesh frequency between gear pairs can be determined using Eq. (3):
where, the subscript denotes the pinion and denotes the driven gear, while denotes the rotational frequency and the number of gear teeth. The rotational frequency can be determined using Eq. (4):
The actual traction characteristics are considered during the acceleration of the high-speed motor car, and the traction force is applied to the output shaft of the traction motor, and the traction force is expressed in Eq. (5). During operation, a railway vehicle is subjected to multiple forms of resistance, such as mechanical wheel-rail interaction and aerodynamic drag, among other factors. Consequently, the total resistance is quantified by Eq. (6).
Traction force :
Equivalent resistance :
where indicates the running speed, km/h.
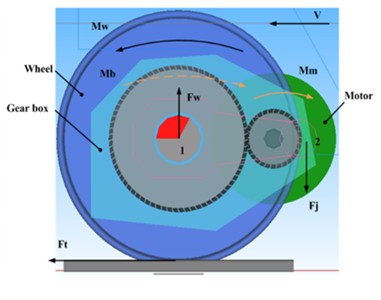
During high-speed motor car operation, the traction motor transmits torque through a flexible coupling to the pinion, which in turn drives the driven gear and wheelset via the gear pair. The wheelset then propels the motor car through the wheel-rail friction interface, generating creep forces. A detailed schematic is presented in Fig. 3(a).
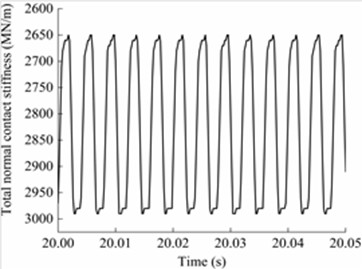
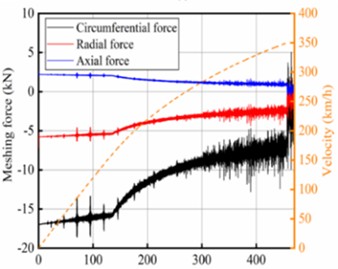
Fig. 3Dynamical characteristics of driving system: a) schematic diagram of transmission system; b) time-varying meshing stiffness; c) angular velocity of gear pair and d) meshing force of gear pair
a)
b)

c)
d)
When the gear pairs in the traction drive system engage, the gear mesh stiffness varies periodically due to changes in the number of teeth in contact. In addition, variations in tooth thickness at different radii further contribute to fluctuations in both the number of meshing teeth and the normal contact force. Fig. 3(b) illustrates the time-varying meshing stiffness of the gear pair in the time domain, consistent with this analysis. Fig. 3(c) presents the angular velocities of the pinion and driven gear during acceleration, showing that the two gears rotate in opposite directions when meshed, and that the pinion rotates faster than the driven gear due to the transmission ratio. Fig. 3(d) shows the meshing force in three directions between the gear pairs during acceleration. It can be found that the absolute values of the axial force, radial force, and circumferential force of the gear pair gradually decrease with the increase of operating speed, and the maximum decreases reach 64 %, 58 %, and 62 % respectively, which indicates that the force environment of the gear pair during the acceleration process is extremely severe and unfavorable for the long-term service of the gear pair.
2.3. Wear model
Mainstream wear calculation models primarily include the Krause/Poll model, the Pearce model, and the Archard model. Among these, the Archard model is widely applied and is adopted in this study for wheel wear prediction. According to the Archard model, wear occurs exclusively within the slip zone of the wheel-rail contact area, while the adhesion zone remains unaffected [21, 22]. Based on the normal contact force and the sliding distance within the wheel–rail contact patch, the wear depth is determined using Eq. (7) [22]:
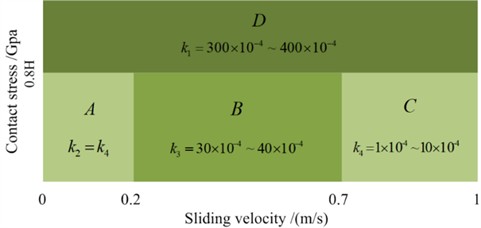
where denotes the normal contact force, is the relative sliding distance, and refers to the hardness of the softer material in the contacting pair. The wear coefficient corresponds to one of four wear levels, while Jendel describes the relationship between the wear coefficient and contact pressure, stress, and sliding velocity, as depicted in Fig. 4. The relative sliding velocity is denoted by , and , represents the transition velocities for the four wear levels. The sliding distance within the contact patch is computed using Eq. (8):
where is the single unit length.
Fig. 4Wear coefficients
Under steady-state rolling conditions, the general sliding velocity within the contact patch is given by Eq. (9):
where , , denote the longitudinal, lateral, and spin creepages, respectively; and represent the elastic displacement differences in the and directions within the contact patch. These displacements can be obtained from Eq. (10):
where is the surface contact force within the contact patch, denotes the displacement at the contact point, and represents the flexibility coefficient along the and directions(where = 1, 2). Substituting Eq. (10) into Eq. (9) yields Eq. (11):
where denotes the modified flexibility coefficient, while and represent the major and minor semi-axes of the elliptical contact patch, respectively. The terms , , and correspond to the creep coefficients, and refers to the elastic modulus.
Fig. 5Wheel wear prediction process
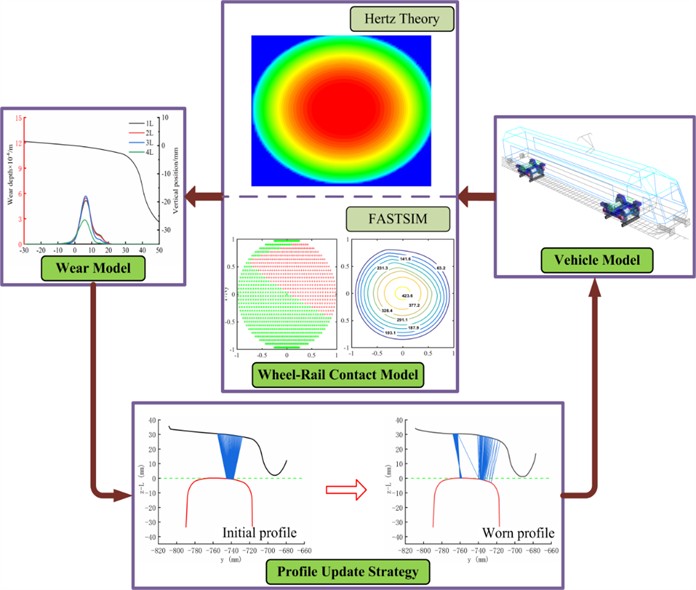
Based on the aforementioned dynamic model, wheel-rail contact model, Archard wears model, and tread update strategy, a detailed wheel wear prediction process was established, as shown in Fig. 5, and the specific wear prediction process includes.
1) Initial wheel-rail contact parameters: Based on the initial wheel-rail geometry, including contact point positions and profile dimensions, the contact patch shape and the normal force distribution are determined using Hertzian contact theory.
2) Creepage and creep forces: Using the contact patch, normal force, and creepage obtained in step 1, the adhesion-slip zone and creep force distribution within the contact patch are calculated with Kalker’s simplified theory (FASTSIM).
3) Wear depth calculation and tread smoothing: The wear depth and its distribution within the sliding region of the contact patch are calculated using the Archard wear model, with the accumulated wear applied to the wheel tread surface.
4) Wheel tread update: Once the predicted wheel tread reaches the update threshold, the worn profile replaces the initial tread, and the wheel wear prediction simulation proceeds to the next cycle.
This study primarily focuses on wheel wear during the acceleration process. In the wear prediction procedure, running speed is used as the tread update threshold, with vehicle acceleration from 0 to 350 km/h defined as a single simulation cycle. Once the speed reaches 350 km/h, the simulation is terminated, the wheel tread is updated with the worn profile, and the subsequent wear cycle is initiated.
During traction acceleration, high-speed railway vehicles experience continuous wheelset hunting motion caused by both track excitation and external excitation from the gear transmission. As the wheelset oscillates laterally, the simulated contact points do not shift smoothly, resulting in a sawtooth waveform along the transverse direction of the wheel. This produces localized impacts at the wheel-rail interface, which deviates from real-world conditions. To address this, the simulated wheel wear profile is smoothed. Considering both computational efficiency and accuracy, this study applies the sliding average method for tread smoothing.
3. Model validation
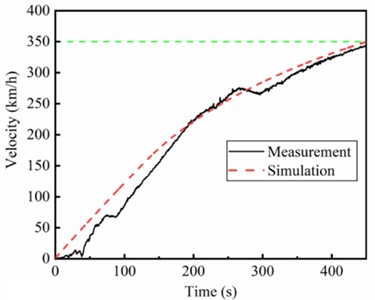
In this section, the proposed dynamic model and wheel wear prediction model are validated using field test data. Fig. 6(a) compares the simulated and measured vehicle speeds during acceleration, showing good agreement in the overall trend. While local discrepancies exist, particularly in the mid-to-low speed range, they are attributable to several factors not fully captured in the simulation: (1) simplifications in modeling driver control actions and the precise application of traction/braking forces; (2) differences between the statistical track irregularity spectrum used in the simulation and the specific, localized conditions encountered during the field test; (3) inevitable parameter variations and connection states in the actual vehicle components compared to the nominal values used in the model. These minor deviations do not affect the validity of the model for analyzing the core phenomena under investigation, as the key dynamic characteristics and evolution trends remain reliably captured.
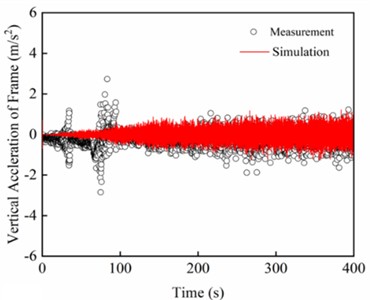
As shown in Fig. 6(b), the vertical vibration acceleration of the bogie frame increases progressively with speed, and the simulation results align closely with the test data. Notably, the bogie frame exhibits a short period of abnormal vertical vibration at a relatively low speed of 80-90 km/h, far below the commercial operating speed of 350 km/h. This anomaly is primarily attributed to irregular vehicle operation when traversing a high-speed turnout or to driver-related influences.
In addition, a representative high-speed railway track in China was incorporated into the wheel wear prediction model to investigate the long-term evolution of wheel wear.
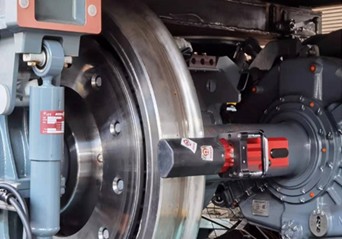
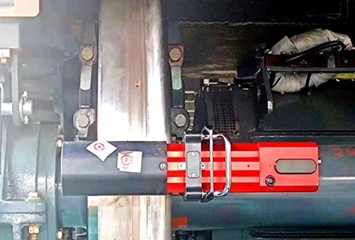
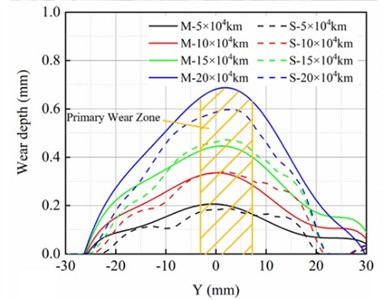
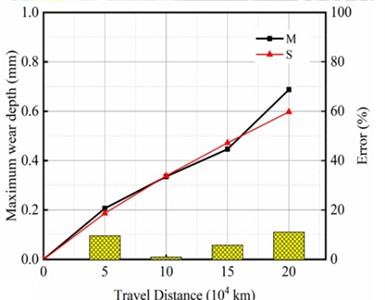
Fig. 7 presents the validation of the wheel wear prediction model against field measurements. Subfigures (a) and (b) show photographic records of the wheel wear measurement system installed on the motor car. Subfigure (c) illustrates the wheel tread wear distribution after 200,000 km of service, where the horizontal axis (Y) represents the lateral coordinate across the wheel profile (in mm), and the vertical axis indicates the wear depth (in mm). The labels “M” and “S” denote the measured and simulated profiles, respectively, at accumulated distances of 50,000 km, 100,000 km, 150,000 km, and 200,000 km. It can be observed that the primary wear zone is consistently located near the nominal rolling circle ( 0 mm) in both experimental and numerical results. Subfigure (d) compares the evolution of the maximum wear depth with travel distance. The solid line with circular markers corresponds to the measured data, while the dashed line with square markers represents the simulation outcomes. The shaded band illustrates the deviation between the two, which remains within 11.4 % across all distances. The close agreement in wear location, profile shape, and growth trend confirms the reliability of the proposed wear prediction model, consistent with the findings reported in Paper [9].
Fig. 6The time history of the velocity of a) vehicle and b) vertical acceleration of bogie
a)
b)
Fig. 7Wheel profile measuring system of motor car: a) side view; b) front view; c) measured and simulated wheel wear distribution; d) measured and simulated maximum wheel wear depth. Fig. 7(a) and (b) were taken by Jie Hu in Qingdao in July 2025
a)
b)
c)
d)
However, discrepancies are observed between the measured and simulated wheel wear bandwidths. The main reasons for these differences include: 1) The simulation model incorporates only typical track conditions rather than the full range of actual tracks; 2) Modeling simplifications for certain components, such as coupling buffers and secondary suspension elements, affect the accuracy of the results; 3) The wheel-rail contact is modeled under the Hertzian assumption.
4. Simulation and discussions
Based on the established dynamic model and wheel wear prediction procedure, the effects of gearbox suspension rod stiffness and the vertical stiffness of motor suspension joints on the dynamic response during acceleration and on wheel wear of the high-speed motor car were analyzed. The specific operating conditions are summarized in Table 3. The initial stiffness values for the gearbox suspension rod and the motor suspension joints were set to 6 MN/m and 30 MN/m, respectively.
Table 3Simulation cases
Stiffness of gearbox suspension rods (MN/m) | 0.6 | 3 | 6 | 9 | 12 | 30 | 60 |
Ratio (%) | 10 % | 50 % | 100 % | 150 % | 200 % | 500 % | 1000 % |
Vertical stiffness of motor suspension joints (MN/m) | 3 | 15 | 30 | 150 | 300 | ||
Ratio (%) | 10 % | 50 % | 100 % | 500 % | 1000 % | ||
4.1. Dynamic responses of gear transmission
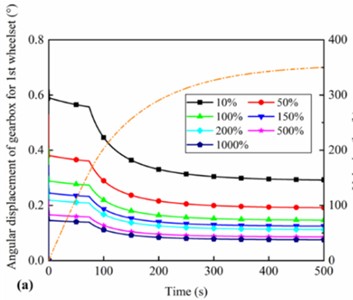
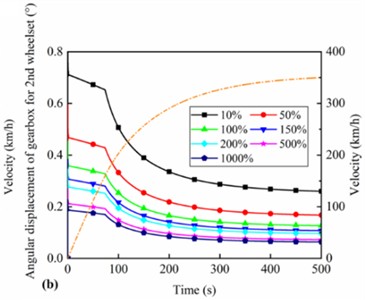
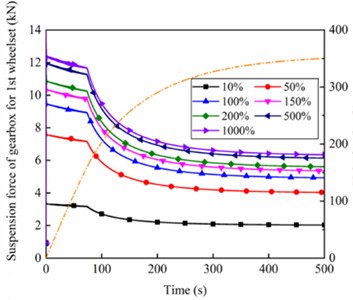
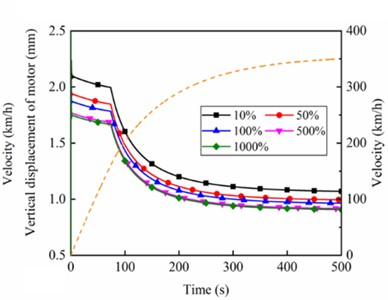
Fig. 8 shows the angular displacement and displacement of the gearbox and motor with different stiffness of the gearbox suspension rod and different vertical stiffness of motor suspension joints. With the increase of running speed, the nodding angle of the gearbox on the 1-position and 2-position wheelset gradually decreases, and the nodding angle gradually remains stable when approaching the target speed, and its change law is consistent with the traction characteristics of the motor. Furthermore, as the stiffness of the gearbox suspension rod increases, the nodding angle of the gearbox decreases, while the rate of this reduction gradually diminishes. This trend suggests the presence of an optimal stiffness value that more effectively suppresses gearbox nodding motion, as illustrated in Fig. 8(a) and Fig. 8(b). The main reason is that the hanging force of the gearbox also gradually increases with the suspension rod stiffness increasing, making its restraint on the nodding motion of the gearbox more significant, as shown in Fig. 8(c). Fig. 8(d) gives the vertical displacement of the motor for different vertical stiffness of motor suspension joints. The variation of the motor's vertical displacement is also consistent with the traction characteristics of the high-speed train. Moreover, with the increase of the vertical stiffness of motor suspension joints, the vertical displacement gradually reduces and the gradient of the variation also decreases. In addition, comparing the angular displacements of the gearboxes on the 1-position and 2-position wheelsets under different stiffnesses of gearbox suspension rod reveals that the angular displacements of the gearboxes on the 1-position wheelset are smaller than those on the 2-position wheelset, and the detailed reasons for this will be explained in the next section.
4.2. Dynamic responses of the motor car
4.2.1. Longitudinal creepage
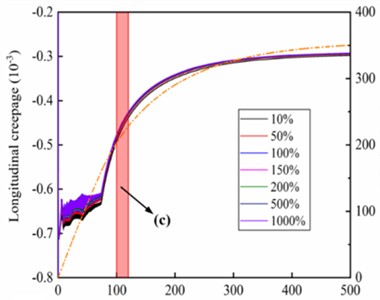
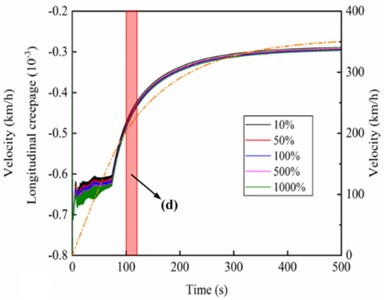
The longitudinal creepage of the wheel for the left wheel of the 1-position wheelset is given in Fig. 9.
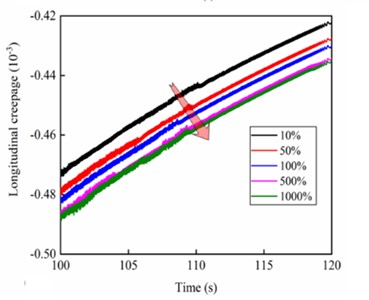
Among them, Fig. 9(a) and Fig. 9(c) are caused by the action of different stiffness of the gearbox suspension rod, while Fig. 9(b) and Fig. 9(d) are caused by the action of different vertical stiffness of motor suspension joints. Under the two types of simulation cases, the longitudinal creepage between the wheel and rail and the traction characteristics of the vehicle are highly positively correlated with the increase in the operating speed. In particular, the absolute value of the longitudinal creepage of the wheels gradually decreases with the increasing stiffness of the gearbox suspension rod, and the gradient of the variation is also gradually decreasing, as shown in Fig. 9(c).
Fig. 8Angular displacement of the gearbox under different stiffness of suspension rods for a) 1st and b) 2nd wheelset; c) suspension force from suspension rods of the gearbox; d) vertical displacement of the motor for 1st wheelset under different stiffness of motor suspension joints
a)
b)
c)
d)
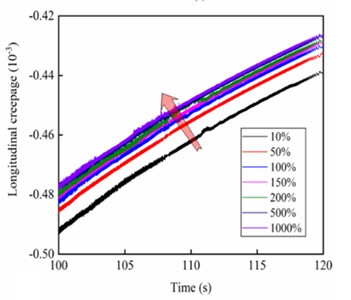
In contrast, as the vertical stiffness of the motor suspension joints increases, the absolute value of the longitudinal creepage of the wheel gradually increases and the gradient of variation gradually decreases, as shown in Fig. 9(d). The main reason is that since one end of the gearbox is suspended from the wheelset by the axle-holding bearings and the other end is hung on the bottom of the frame by the suspension rod, most of its mass belongs to the underspring mass while a small part of it belongs to the overspring mass. When the stiffness of the suspension rod increases, the suspension force of the gearbox also increases gradually, which makes the wheelset rigidly connected to it be more closely pressed on the track, prompting the area of the adhesion zone within the wheel-rail contact patch to increase while the area of the sliding zone decreases, thus leading to the reduction of the creepage. The traction motor is suspended directly from the frame by four rubber joints, all of which belong to the overspring mass. When the vertical stiffness of the motor suspension joints is increased, it is equivalent to the transition from a flexible connection to a rigid connection between the motor and the frame and increases the ratio between the underspring mass and overspring masses, which is beneficial for relieving the impact of the wheel from the irregularities of the track and slowing down the wheel wear.
Fig. 9Longitudinal creepage under different a) stiffness of gearbox suspension rod and b) vertical stiffness of motor suspension joints; Local zoom about different c) stiffness of gearbox suspension rod and d) vertical stiffness of motor suspension joints; e) dynamic axle load and f) principle of axle weight transfer
a)
b)
c)
d)
e)
f)
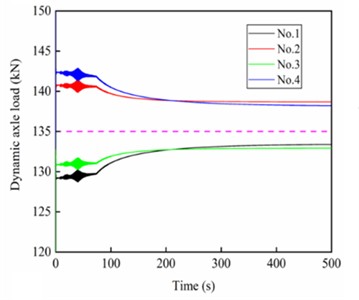
Fig. 9(e) shows the dynamic axle load of each wheelset on the motor car during the acceleration process. It can be found that as the running speed increases, the varying trend of the axle load of each wheelset is consistent with the traction characteristic of the vehicle. In addition, because the traction gearbox is mounted in an axle-hung configuration, the forces transmitted directly to the wheel axle lead to axle load transfer. As a result, the axle loads of the 1st and 3rd wheelsets gradually decrease, while those of the 2nd and 4th wheelsets increase. The underlying mechanism is that when the motor car operates on the track, the traction torque (black solid curved arrow) applied to the leading wheelset induces a counteracting torque (yellow dotted curved arrow) on the gearbox. At the same time, the motor torque (yellow solid curved arrow) is transmitted from the traction motor to the gearbox. Consequently, the gearbox exerts an upward tensile force on the wheel axle through the axle-hung bearings at installation position 1, reducing the axle load on the leading wheelset. Simultaneously, a downward force from the bogie is applied to the gearbox through the suspension rod at installation position 2, as illustrated in Fig. 9(f). For the rear wheelset, the axle load change is equal in magnitude but opposite in direction to that of the leading wheelset and is therefore not repeated here.
4.2.2. Vertical acceleration of motor bogie
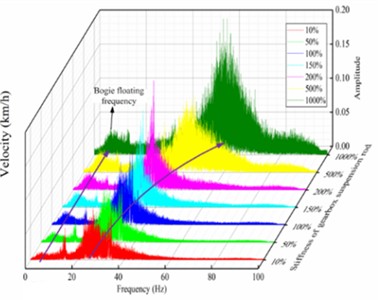
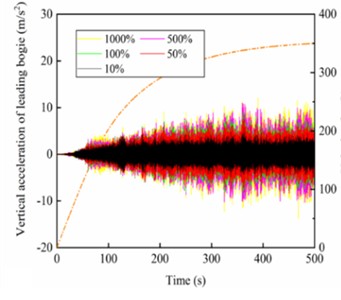
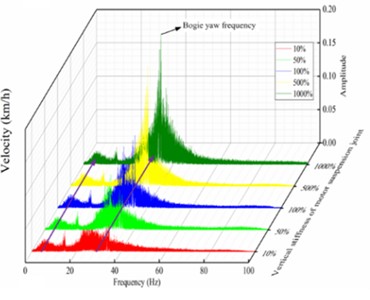
The time domain and frequency spectrum of the vertical acceleration of the leading bogie under the action of different stiffness of gearbox suspension rods and vertical stiffness of motor suspension joints are given in Fig. 10.
Fig. 10Dynamic responses for different stiffness of gearbox suspension rods: a) vertical acceleration, b) frequency spectra; and dynamic responses for different vertical stiffness of motor suspension joints: c) vertical acceleration and d) frequency spectra
a)
b)
c)
d)
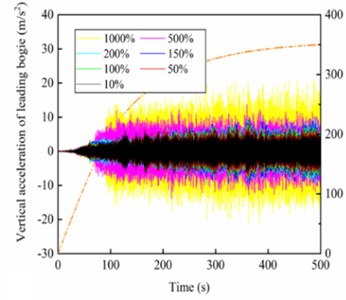
Among them, Fig. 10(a) and Fig. 10(b) are caused by the action of different stiffness of the gearbox suspension rod, while Fig. 10(c) and Fig. 10(d) are caused by the action of vertical stiffness of the motor suspension joints. In both simulation cases, the vertical acceleration of the leading bogie of the high-speed motor car gradually increases with the increase of the operating speed, and the vertical acceleration gradually remains stable after approaching the target speed. In particular, the vertical acceleration amplitude of the bogie increases progressively with the stiffness of the gearbox suspension rod, as shown in Fig. 10(a). According to the spectrum analysis, the energy of its vertical vibration also increases simultaneously, and the yaw frequency of the bogie gradually increases from 22.5 Hz to 53.8 Hz with the increased stiffness of the gearbox suspension rod, while the sinking-floating frequency remains around 5.3 Hz, as in Fig. 10(b). With the increase of the vertical stiffness of the motor suspension joints, the vertical acceleration amplitude of the bogie also increases gradually, as shown in Fig. 10(c). According to the spectrum analysis, the energy of the bogie's vertical vibration is also enhanced simultaneously, and the yaw frequency and sinking-floating frequency of the bogie do not change with the increase of the vertical stiffness of the motor suspension joints, as shown in Fig. 10(d).
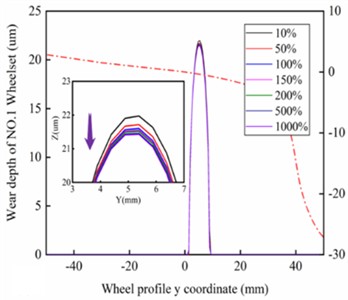
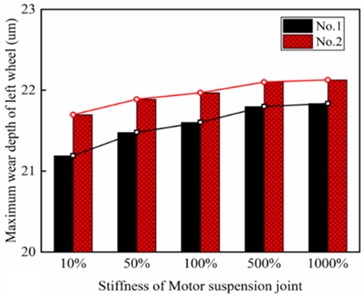
Fig. 11Wear distribution of left wheel for a) 1st and b) 2nd wheelset under different stiffness of gearbox suspension rods; and for c) 1st and d) 2nd wheelset under different vertical stiffness of motor suspension joints; Maximum wear depth of left wheel for 1st and 2nd wheelset under different stiffness of e) gearbox suspension rod and f) motor suspension joints
a)
b)
c)
d)
e)
f)
4.3. Wheel wear distribution
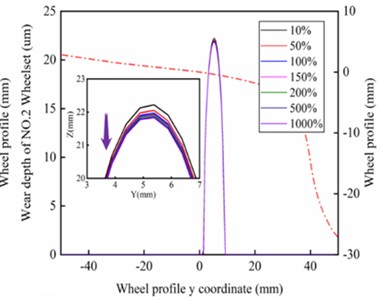
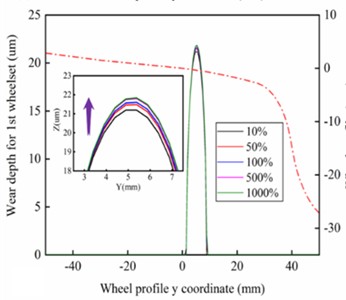
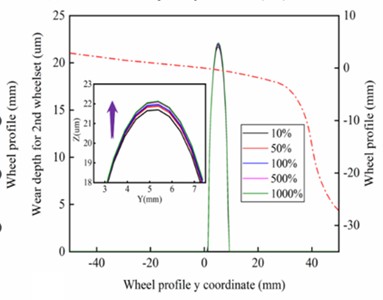
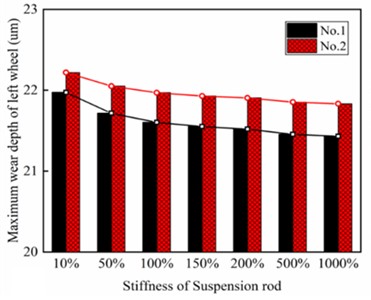
Fig. 11 shows the wear distribution of the left side wheels of the 1-position and 2-position wheel pairs after completing 100 traction processes for the high-speed locomotive. Among them, Fig. 11(a), Fig. 11(b), and Fig. 11(e) are the results influenced by the different stiffnesses of gearbox suspension rods. while Fig. 11(c), Fig. 11(d), and Fig. 11(f) are the results influenced by different vertical stiffnesses of motor suspension joints.
To exclude the influence of random factors, track excitation was not introduced when performing wheel wear prediction. According to Fig. 11(a) and Fig. 11(b), the wear area of the wheel tread is distributed near the nominal rolling circle, and the wear bandwidth is less than 10 mm. with the increasing stiffness of the gearbox suspension rod, the wear depth of the 1st wheelset gradually decreases from 22 um to 21.4 um, and the wear depth of the 2nd wheelset decreases from 22.2 um to 21.7 um, with a reduction of 2.7 % and 2.1 %, respectively. as shown in Fig. 11(e). According to Fig. 11(c) and Fig. 11(d), the wheel wear distribution is similar to the former, with the difference that the wear depth of the 1st wheelset gradually increases from 21.1 um to 21.8 um, and the wear depth of the 2nd wheelset increases from 21.7 um to 22.2 um with an increase of 3.3 % and 2.3 %, respectively, as shown in Fig. 11(f). As the number of railway train stops increases and track excitation is introduced, the maximum wear depth of the wheel increases or decreases even more. This indicates that it is of practical value to use wheel wear as a constraint condition to optimize the drive system in the design phase of high-speed vehicles, and that special attention also needs to be paid to the effect of wheel wear on the dynamic responses of the drive system in the operation and maintenance phase. It is worth noting that the wear depth of the 1st wheelset is smaller than that of the 2nd wheelset under both working cases, which is due to the reduction of the dynamic wheel/rail contact force of the leading wheelset and the increase of the dynamic wheel/rail contact force of the trailing wheelset caused by the axle load transfer phenomenon. According to the foregoing, as the stiffness of the gearbox suspension rod increases, the absolute value of the longitudinal creepage of the wheel gradually decreases, and according to the Archard wear model, the wear volume of the wheel is positively related to the normal force and sliding distance within the contact patch, therefore, the wear depth of the wheel decreases. Similarly, as the vertical stiffness of the motor suspension joints increases, the absolute value of the longitudinal creepage of the wheel gradually increases, and so the wear depth of the wheel also increases.
5. Conclusions
A detailed nonlinear multibody system considering the detailed helical gear transmission is developed to investigate the discrepancies in the dynamics response of high-speed railway vehicles when the drive system is considered and not considered. The wheel wear prediction model integrating the Archard wear model and the vehicle dynamics system is then further constructed based on the wheel tread update strategy at the target speed. Finally, the effects of the stiffness of the gearbox suspension rod and vertical stiffness of the motor suspension joints on the dynamic responses and wheel wear of the high-speed motor car are simulated during the traction acceleration process, respectively. The main conclusions can be drawn from this work, as follow:
1) Owing to the time-varying meshing stiffness of the gear transmission, the dynamic responses and wheel wear of motor cars with and without gear transmission differ markedly. This demonstrates that the internal excitation induced by the gear transmission cannot be overlooked in dynamic simulation and wheel wear prediction.
2) In the two kinds of simulation cases, with the increase of running speed, the vertical acceleration of the leading bogie of the high-speed motor car increases gradually. In particular, with the increase of the stiffness of the suspension rod of the gearbox, the vertical acceleration amplitude of the bogie gradually increases, and the yaw frequency of the bogie gradually increases from 22.5 Hz to 53.8 Hz, while the sinking-floating frequency is maintained at about 5.3 Hz. With the increase of the vertical stiffness of the motor suspension joints, the energy of the vertical vibration of the bogie is also synchronously enhanced, but the yaw frequency and the sinking-floating frequency of the bogie are not changed.
3) With the increase of the stiffness of the gearbox suspension rod, the gearbox suspension force gradually increases, which not only suppresses the nodding motion of the gearbox but also reduces the absolute value of the longitudinal creepage of the wheel, resulting in the reduction of the wheel wear depth. And as the vertical stiffness of motor suspension joints increases, the vertical displacement of the motor gradually decreases, while the absolute value of the longitudinal creepage of the wheel gradually increases, leading to the subsequent increase in the wear depth of the wheel.
References
-
R. Luo, B. Liu, and S. Qu, “A fast simulation algorithm for the wheel profile wear of high-speed trains considering stochastic parameters,” Wear, Vol. 480-481, p. 203942, Sep. 2021, https://doi.org/10.1016/j.wear.2021.203942
-
S. Chang, Y.-S. Pyun, and A. Amanov, “Wear enhancement of wheel-rail interaction by ultrasonic nanocrystalline surface modification technique,” Materials, Vol. 10, No. 2, p. 188, Feb. 2017, https://doi.org/10.3390/ma10020188
-
M. Hou, B. Chen, and D. Cheng, “Study on the evolution of wheel wear and its impact on vehicle dynamics of high-speed trains,” Coatings, Vol. 12, No. 9, p. 1333, Sep. 2022, https://doi.org/10.3390/coatings12091333
-
J. Auciello, M. Ignesti, M. Malvezzi, E. Meli, and A. Rindi, “Development and validation of a wear model for the analysis of the wheel profile evolution in railway vehicles,” Vehicle System Dynamics, Vol. 50, No. 11, pp. 1707–1734, Nov. 2012, https://doi.org/10.1080/00423114.2012.695021
-
J. F. Aceituno, P. Wang, L. Wang, and A. A. Shabana, “Influence of rail flexibility in a wheel/rail wear prediction model,” Proceedings of the Institution of Mechanical Engineers, Part F: Journal of Rail and Rapid Transit, Vol. 231, No. 1, pp. 57–74, Aug. 2016, https://doi.org/10.1177/0954409715618426
-
N. Bosso and N. Zampieri, “Numerical stability of co-simulation approaches to evaluate wheel profile evolution due to wear,” International Journal of Rail Transportation, Vol. 8, No. 2, pp. 159–179, Apr. 2020, https://doi.org/10.1080/23248378.2019.1672588
-
R. Luo et al., “Influence of wheel/rail parameters on wheel profile wear of high-speed train,” (in Chinese), Journal of Traffic and Transportation Engineering, Vol. 9, No. 6, pp. 47–53, 2009, https://doi.org/10.19818/j.cnki.1671-1637.2009.06.010
-
R. Luo, H. Shi, W. Teng, and C. Song, “Prediction of wheel profile wear and vehicle dynamics evolution considering stochastic parameters for high-speed train,” Wear, Vol. 392-393, pp. 126–138, Dec. 2017, https://doi.org/10.1016/j.wear.2017.09.019
-
L. Cui, “Vibration characteristic analysis of driving system for high-speed trains,” (in Chinese), Southwest Jiaotong university, China, 2014.
-
J. Wei, Q. Sun, and W. Sun, “Dynamic analysis and effects of nonlinear factors of a gear transmission system for high speed locomotive,” (in Chinese), Journal of Vibration and Shock, Vol. 31, No. 17, pp. 38–50, 2012, https://doi.org/10.13465/j.cnki.jvs.2012.17.019
-
K. Xu, “Research on driving system dynamis for high speed motor car with bogie frame suspended motor,” (in Chinese), Southwest Jiaotong university, China, 2019.
-
H. Sang, J. Zeng, F. Gan, J. Mu, and Y. Qi, “A study of wheel wear on a high-speed railway motor car,” Proceedings of the Institution of Mechanical Engineers, Part F: Journal of Rail and Rapid Transit, Vol. 237, No. 1, pp. 80–92, Apr. 2022, https://doi.org/10.1177/09544097221096467
-
H. Sang, J. Zeng, Y. Qi, J. Mu, and F. Gan, “Study on wheel wear mechanism of high-speed train in accelerating conditions,” Wear, Vol. 516-517, p. 204597, Mar. 2023, https://doi.org/10.1016/j.wear.2022.204597
-
Y. Qi and H. Dai, “Influence of motor harmonic torque on wheel wear in high-speed trains,” Proceedings of the Institution of Mechanical Engineers, Part F: Journal of Rail and Rapid Transit, Vol. 234, No. 1, pp. 32–42, Feb. 2019, https://doi.org/10.1177/0954409719830808
-
S. Alfi, L. Mazzola, and S. Bruni, “Effect of motor connection on the critical speed of high-speed railway vehicles,” Vehicle System Dynamics, Vol. 46, No. sup1, pp. 201–214, Sep. 2008, https://doi.org/10.1080/00423110801935814
-
Z. Chen, W. Zhai, and K. Wang, “A locomotive-track coupled vertical dynamics model with gear transmissions,” Vehicle System Dynamics, Vol. 55, No. 2, pp. 244–267, Nov. 2016, https://doi.org/10.1080/00423114.2016.1254260
-
Y. Yang, J. J. Ding, and F. Li, “Research on wheel wear under locomotive traction condition,” (in Chinese), Journal of Traffic and Transportation Engineering, Vol. 17, No. 5, pp. 81–89, 2017.
-
Z. Wang, R. Wang, D. Crosbee, P. Allen, Y. Ye, and W. Zhang, “Wheel wear analysis of motor and unpowered car of a high-speed train,” Wear, Vol. 444-445, p. 203136, Mar. 2020, https://doi.org/10.1016/j.wear.2019.203136
-
Y. Wu, S. Liu, D. Wu, and W. Wang, “Multibody system dynamics modelling and simulation of a high-speed train for its suspension optimization,” Vibroengineering Procedia, Vol. 50, pp. 70–76, Sep. 2023, https://doi.org/10.21595/vp.2023.23289
-
Z. Chen and Y. Shao, “Dynamic simulation of spur gear with tooth root crack propagating along tooth width and crack depth,” Engineering Failure Analysis, Vol. 18, No. 8, pp. 2149–2164, Dec. 2011, https://doi.org/10.1016/j.engfailanal.2011.07.006
-
Y. Zhu, W. Wang, R. Lewis, W. Yan, S. R. Lewis, and H. Ding, “A review on wear between railway wheels and rails under environmental conditions,” Journal of Tribology, Vol. 141, No. 12, Dec. 2019, https://doi.org/10.1115/1.4044464
-
Y. Li, Z. Ren, R. Enblom, S. Stichel, and G. Li, “Wheel wear prediction on a high-speed train in China,” Vehicle System Dynamics, Vol. 58, No. 12, pp. 1839–1858, Dec. 2020, https://doi.org/10.1080/00423114.2019.1650941
About this article

This work was supported by the National Natural Science Foundation of China under Grant U2468227.
The datasets generated during and/or analyzed during the current study are available from the corresponding author on reasonable request.
Chengyu Sha: investigation, writing-original draft, writing-review and editing. Pingbo Wu: methodology, validation, funding acquisition, supervision. Jie Hu: conceptualization, project administration, formal analysis, data curation.
The authors declare that they have no conflict of interest.
