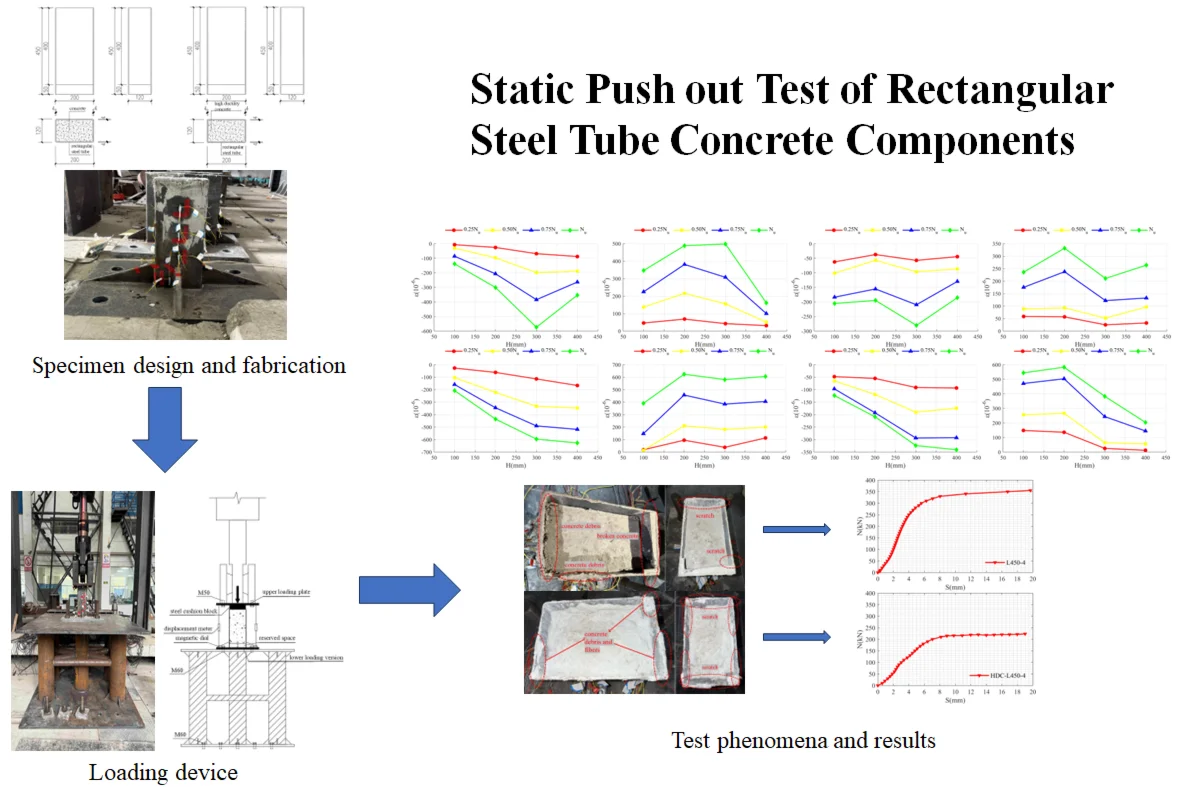
Abstract
The interface bonding behavior of concrete-filled rectangular steel tubular (CFST) members was studied by static push out test system. The influence of two types of core concrete, ordinary concrete and high ductility concrete, on the interfacial bond strength is analyzed, and the failure mechanism and strain distribution characteristics are revealed. The test results show that the ultimate bond strength of high ductility concrete (HDC) specimens is 36 % lower than that of ordinary concrete, but it has more uniform strain distribution characteristics. The research results provide a theoretical basis for the interface design of composite structures.
Highlights
- High-ductility concrete (HDC) reduces interfacial bond strength by about 36% compared to ordinary concrete, mainly due to fiber debonding and weaker mechanical interlock at the steel-concrete interface.
- HDC specimens show significantly more uniform strain distribution (standard deviation reduced by 22%) and better composite action with the steel tube, despite their lower bond strength.
- Steel tubes exhibit stronger confinement on HDC, which improves the cooperative behavior of the composite member and demonstrates a favorable balance between bond strength and structural ductility.
1. Introduction
As an efficient composite structure system [1], the core advantage of rectangular concrete filled steel tube is to achieve the dual goals of bearing capacity improvement and durability guarantee through the cooperative work of steel tube and concrete [2]. However, as a key factor affecting the overall performance of composite structures, the interface bonding performance directly determines the load transfer efficiency and structural stability [3]. Through the static push out test of concrete-filled rectangular steel tube, this study systematically analyzes the influence of HDC on the interface bonding performance, reveals the failure mode, load slip curve and steel tube strain distribution characteristics, and provides a theoretical basis for the refined design of composite structures. The test method adopts the push out test, which reserves a 50 mm gap when the steel tube is poured with concrete. During the test, the bottom of the steel tube is facing upward, and the hydraulic actuator applies axial thrust to the steel cushion block on the concrete surface, and synchronously collects the load slip curve and the strain distribution data of the steel tube. This test method can directly obtain the interfacial bond slip characteristics.
2. Experimental design
2.1. Specimen design and fabrication
The strength of the test piece and the test equipment are considered in the design of the test piece. As shown in Fig. 1, the thickness of the outer steel pipe is 4 mm (marked as t), the short side of the steel pipe is 120 mm, the long side is 200 mm, the corresponding width thickness ratio is 50, the outer arc radius at the corner is 8 mm (2 t), and the height of the test piece is 450 mm, except for the loading plate. The overall test piece is shown in Fig. 1, and the lower end of the test piece is reinforced with a 12 mm thick stiffener. Due to the height of the experimental equipment, it is necessary to erect a pedestal with a total height of 1.16 m, a steel column diameter of 300 mm and a wall thickness of 15 mm. In order to prevent buckling, the steel columns are connected by circular steel tubes with a diameter of 100 mm and a wall thickness of 10 mm. The upper and lower base plates are made of 40 mm thick steel plates, and the upper and lower ends are reinforced with 12 mm thick stiffeners. The lower base plate is connected with the channel by two rows of bolts with a diameter of 60 mm, with a spacing of 300 mm. The pedestal is shown in Fig. 2. Q235 steel is used as steel pipe in this test, and C30 concrete and high ductility concrete are used as core concrete. The test results for the material properties of the samples are listed in Tables 1 and 2.
Table 1Test results for the mechanical properties of Q235 steel
Thick (mm) | Yield strength (MPa) | Tensile strength (MPa) | Modulus of elasticity (GPa) | Elongation (%) |
4 | 298 | 431 | 209 | 30.1 |
Table 2Test results for properties of ordinary C30 concrete and HDC
Type | Standard value of (MPa) | Standard value of (MPa) | Test value of (MPa) | Test value of (MPa) |
C30 | 30.0 | 20.1 | 32.9 | 24.2 |
HDC | 50.0 | 38.7 | 50.4 | 42.3 |
Fig. 1Specimens of rectangular concrete-filled steel tube push-out test. Photo taken by Yiping Wang in March 2025 at the Engineering Laboratory, Sichuan College of Architectural Technology, Deyang, Sichuan, China
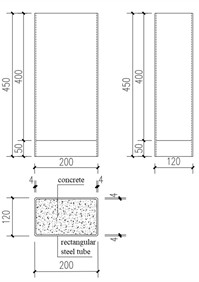
a) L450-4
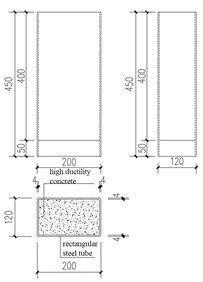
b) HDC-L450-4
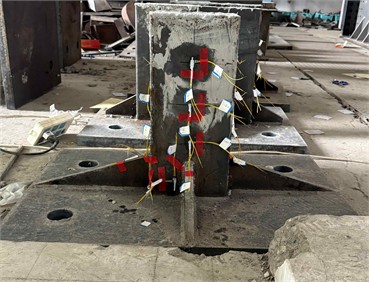
c) The physical object
2.2. Loading device and strain gauge arrangement
The test was carried out on a 100 ton MTS servo hydraulic actuator. Maintain a 50 mm gap at the lower end of the test piece and fix it with the pedestal and align it in the middle, and lay a wet fine sand layer on the concrete surface of the loading end to adjust the contact surface. A steel cushion block with an overall width slightly less than the core concrete is placed on the top, with a gap of 2-3 mm from the edge of the steel pipe and in the middle. Two 15 kn preloading cycles shall be conducted before formal loading to ensure the fit. Graded monotonic loading is adopted: at the initial stage, it is graded according to 1/10 of the ultimate load, and each level holds the load for 2-3 minutes; After the occurrence of nonlinear sliding, it is changed to 1/20 limit load slow continuous loading until the bond fails or reaches the limit load. Strain data is collected through TZT3826E acquisition box. The schematic diagram of the loading device and the arrangement of the strain gauge for the test are shown in Fig. 2.
3. Test phenomena and results
3.1. Failure mode of specimen
The loading process of the two specimens is consistent: when the initial load increases, there is no obvious relative displacement between the rigid pad at the loading end and the steel tube wall, and the concrete displacement is only slight; When the load increases further, there is a slight “thump” sound, and the chemical bonding force begins to damage. The mechanical bonding force and friction bonding force generated by the concave and convex surface are dominant (mainly mechanical bonding force), and the two ends of the steel pipe and concrete appear obvious relative sliding. With the increase of load, the relative slip develops from both ends to the middle (judged by the movement of the rigid cushion block). At this time, the chemical bond force only exists in the middle of the non slip, the bond force at the slip interface is provided by the mechanical and friction bond force, and the load displacement curve maintains a linear growth; When the chemical bond force is completely destroyed and the mechanical bond force at the large sliding interface begins to destroy, the load reaches the ultimate bond strength (with loud noise); The “hissing” sliding friction sound can be heard when the load is continued, and the interface bonding force turns to friction bonding force and residual mechanical bonding force. The displacement of concrete and steel pipe continues to increase, but the load growth is slow and tends to be flat.
Fig. 2Schematic diagram of loading device and layout diagram of strain gauge measurement points on steel pipe for the test. Photo taken by Yiping Wang in March 2025 at the Engineering Laboratory, Sichuan College of Architectural Technology, Deyang, Sichuan, China
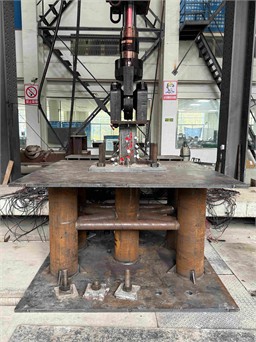
a) Physical image of loading device
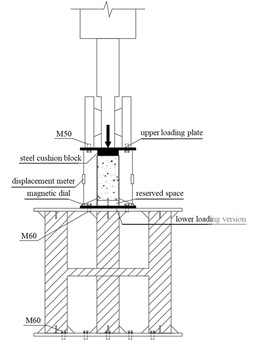
b) Schematic diagram of loading device
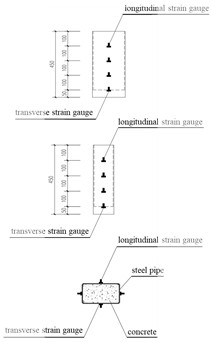
c) Strain gauge layout
Fig. 3Internal failure of the specimen. Photo taken by Yiping Wang in March 2025 at the Engineering Laboratory, Sichuan College of Architectural Technology, Deyang, Sichuan, China
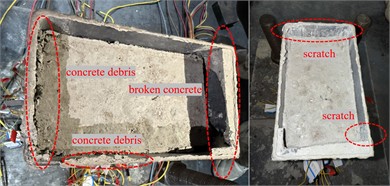
a) L450-4
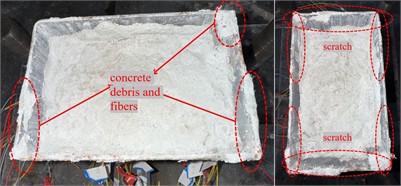
b) HDC-L450-4
After the test, remove the rigid cushion block. The internal conditions of the two test pieces are shown in Fig. 3. Residual slag and fragments in ordinary concrete specimens, residual slag and fibers in high ductility concrete specimens (due to the shear effect of the edge concrete extruded by the rigid cushion block). There are obvious scratches on both specimens: the scratches on ordinary concrete are mainly distributed on the short side and four corners; The scratches on the high ductility concrete are distributed at both ends of the short side, the long side (except the middle) and the corner, indicating that the steel tube has a larger constraint range on the high ductility concrete. There is no significant change in the axial direction of the specimen during the whole test, and there is no local instability such as bulging and buckling on the surface of the outer steel pipe.
3.2. Load-slip curve
Fig. 4 shows the load slip curves of the two test pieces obtained through the push out test. The ordinate is the test load , which is obtained through the MTS actuator operating end, and the abscissa is the slip amount , which is obtained through the displacement meter at the end of the test piece. It can be seen from Fig. 5 that the load slip curves of the two specimens are roughly similar: in the initial loading stage, the chemical bonding force between the steel tube and concrete interface is destroyed, the mechanical bonding force and friction bonding force begin to play a role, and the load slip curve shows a linear growth trend; With the enhancement of the squeezing effect between concrete and steel tube interface, the bonding performance of steel tube and concrete interface changes again, and the chemical bonding force is completely destroyed [4]. When the mechanical bonding force on the interface with relatively large sliding also begins to fail, the load reaches the ultimate bonding strength, and the load slip curve reaches the inflection point; At this time, when the load continues, the interfacial bonding force between steel tube and concrete is mainly provided by the friction bonding force between steel tube and concrete and a part of the residual mechanical bonding force, and the curve trend tends to be gentle and accompanied by a slight increase [5].
Fig. 4Load-slip curve
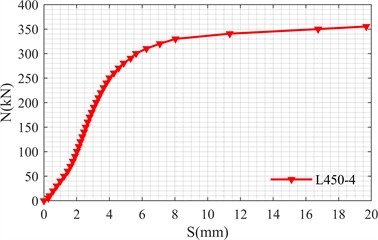
a) L450-4
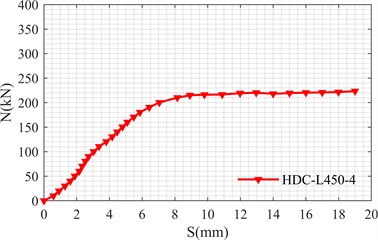
b) HDC-L450-4
3.3. Ultimate bond strength
In practice, the bonding force at the interface between rectangular steel tube and concrete is unevenly distributed. Corners and short edges are more constrained to concrete, and the bonding force at different positions is significantly different, which is difficult to calculate accurately. In order to quantitatively describe the interface ultimate bond strength, the average bond stress is usually used to characterize the overall bond performance of the specimen[6], i.e., where, represents the ultimate bond stress, is the ultimate bond force, corresponding to the inflection point of the load slip curve, and is the area of the bond interface between steel tube and concrete.
The ultimate bond stress of the two specimens is shown in Table 3. From the results, the ultimate bond stress (0.82 MPa) of concrete-filled rectangular steel tubular specimens with high ductility concrete (HDC) as the core concrete is lower than that of concrete-filled rectangular steel tubular specimens with ordinary concrete (1.29 MPa), which is reduced by about 36 %.
In terms of chemical bond strength, the fibers in HDC are easy to debond or slip at the initial stage of loading, weakening the overall chemical bond, while the direct bond between ordinary concrete slurry and steel pipe is more stable; In terms of mechanical cohesion, it is difficult for HDC to form concave convex bite without aggregate, and the fiber may form a “lubricating layer” to reduce the mechanical bite force; In terms of friction and cohesion, ordinary concrete has large hardening shrinkage, high interface contact pressure and strong friction, while HDC has low contact pressure and weak friction due to fiber shrinkage inhibition. Therefore, HDC gains ductility by sacrificing partial bond strength.
Table 3Ultimate bond stress
Test piece number | (kN) | (mm2) | (MPa) | (mm) |
L450-4 | 330.23 | 2.56×10⁵ | 1.29 | 8.03 |
HDC-L450-4 | 210.22 | 2.56×10⁵ | 0.82 | 8.15 |
3.4. Strain analysis of steel tube
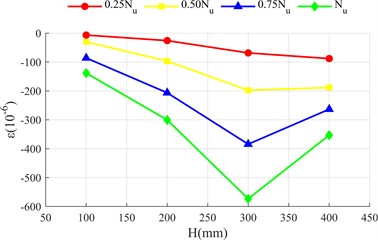
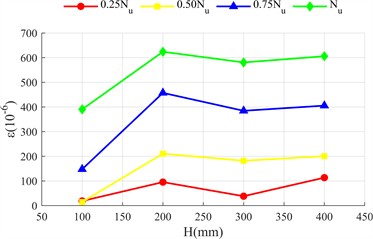
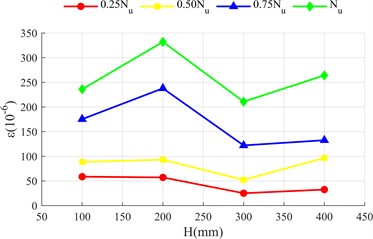
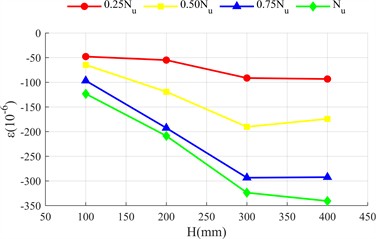
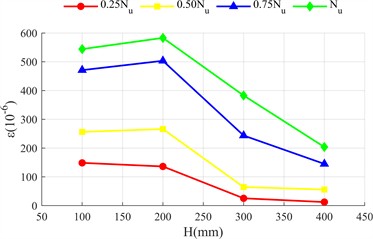
Fig. 5 shows the distribution of transverse and longitudinal strains of the long side (front view, Fig. 2(c)) and short side (side view, Fig. 2(c)) of the rectangular steel tube along the height of the test piece ( is the distance measured from the top side of the specimen as shown in Fig. 2(c)). The longitudinal strain of the two specimens is negative (compression), and the transverse strain is positive (tension), indicating that the outer side of the steel tube is always in compression and transverse tension.
The strain at the initial stage of loading does not change significantly with height; With the increase of load, the strain difference is significant: the longitudinal strain in the middle and lower part of the long side is greater than that in the upper part (greater away from the loading end), because the concrete at the loading end is the main force, the lower steel tube bears the end reaction force; The lateral strain in the middle is greater than that at both ends, because the lateral deformation is limited by the constraints at both ends, and the constraint at the middle is weak, and the lateral deformation caused by Poisson effect is more prominent. The strain distribution of the short side is similar to that of the long side, but the deformation is more significant: the bending stiffness of the short side is lower and it is easier to deform; The constraint of concrete on the inner wall of steel tube restricts the lateral expansion space of the short side, and the reaction is stronger. The lateral deformation is significantly greater. Compared with the two specimens, the strain value of high ductility concrete specimen is smaller and more evenly distributed. There are two reasons: first, the ultimate bond load of ordinary concrete is higher, the bond failure develops more slowly from both ends to the middle, and the strain of steel tube is concentrated.
Fig. 5Strain distribution diagram of steel pipe
a) Longitudinal strain on the long side of L450-4 test piece
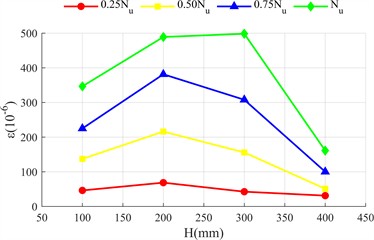
b) Transverse strain on the long side of L450-4 test piece
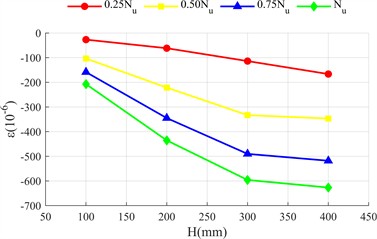
c) Longitudinal strain on the short side of L450-4 test piece
d) Longitudinal strain on the short side of L450-4 test piece
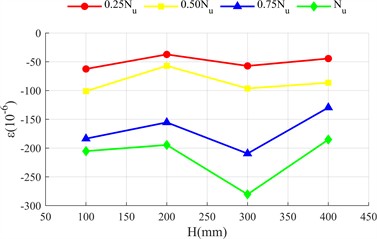
e) Longitudinal strain on the long side of HDC-L450-4 test piece
f) Transverse strain on the long side of HDC-L450-4 test piece
g) Longitudinal strain on the short side of HDC-L450-4 test piece
h) Longitudinal strain on the short side of HDC-L450-4 test piece
However, the failure of high ductility concrete develops faster and the strain distribution is more uniform. Second, the constraint range of steel tube on high ductility concrete is larger (Fig. 5), its integrity is better when the load is lower, and the steel tube and concrete have stronger synergy, so the outer steel tube should be changed evenly and the peak value is lower.
4. Conclusions
In this study, the difference of interfacial bonding properties between ordinary concrete and high ductility concrete (HDC) filled rectangular steel tube members was systematically analyzed by static push out test. The results show that the ultimate bond strength of HDC specimens is about 36 % lower than that of ordinary concrete, but the more uniform strain distribution is achieved through fiber bridging (the standard deviation is reduced by 22 %), showing the balance characteristic of “strength ductility”. The constraint effect of steel tube on HDC is more significant, and the cooperative work performance is better than that of traditional materials. The present study provides an initial comparison of the bond performance between ordinary concrete, HDC, and steel pipes using two specimens. It is recommended that future systematic experiments be conducted to investigate the effects of different high-ductility concrete mix designs, specimen dimensions, and loading conditions (such as cyclic loading) on the bond performance of high-ductility concrete. This will facilitate micro-level research into the bonding mechanisms and failure modes of high-ductility concrete, thereby advancing its application in engineering projects.
References
-
J. Wan, H. Yang, Y. Zhu, and M. Shang, “Experimental and analytical study on the dynamic response of rectangular concrete-filled steel tube under transverse impact loading,” Thin-Walled Structures, Vol. 190, p. 110925, Sep. 2023, https://doi.org/10.1016/j.tws.2023.110925
-
A. Alghossoon, S. Almarashdeh, A. Tarawneh, R.E. Al-Mazaidh, E. Saleh, and G. Almasabha, “Experimental investigation of shear behavior in rectangular concrete-filled steel tubes,” Results in Engineering, Vol. 26, p. 104974, Jun. 2025, https://doi.org/10.1016/j.rineng.2025.104974
-
V. Cao, “Behaviour of rectangular concrete-filled steel tube beams under monotonic and cyclic loadings,” Journal of Constructional Steel Research, Vol. 220, p. 108816, Sep. 2024, https://doi.org/10.1016/j.jcsr.2024.108816
-
P. P. Debnath, F. Xu, and T.-M. Chan, “Load transfer mechanism in concrete-filled steel tubular columns: Developments, challenges and opportunities,” Journal of Constructional Steel Research, Vol. 203, p. 107781, Apr. 2023, https://doi.org/10.1016/j.jcsr.2023.107781
-
Y.-J. Zhou, X. Yang, W.-W. Zou, and C.-S. Han, “Experimental testing and machine learning to predict the load-slip behavior of stud connectors in steel-UHPC composite structures,” Engineering Structures, Vol. 335, p. 120418, Jul. 2025, https://doi.org/10.1016/j.engstruct.2025.120418
-
H. G. Hasan and T. Ekmekyapar, “Bond-slip behaviour of concrete filled double skin steel tubular (CFDST) columns,” Marine Structures, Vol. 79, p. 103061, Sep. 2021, https://doi.org/10.1016/j.marstruc.2021.103061
About this article

The authors have not disclosed any funding.
The datasets generated during and/or analyzed during the current study are available from the corresponding author on reasonable request.
The authors declare that they have no conflict of interest.
