Abstract
In response to the coexisting problems of mining vibrating separators, such as strength redundancy, insufficient stiffness, and susceptibility to fatigue wear, an integrated analytical scheme encompassing dynamic characteristics and multi-objective structural optimization was developed. Based on the Lagrange equation, the dynamic model of the vibrating system was established. Subsequently, the multi-rigid body simplified model was constructed using ADAMS to determine the motion law of the centroid. The modal, harmonic response, and fatigue response characteristics of the vibrating separator box body were analyzed via the finite element method, and the simulation model was validated through hammer impact tests. The research findings indicate that the minimum fatigue life of the box body exceeds 107 cycles, satisfying the operational requirements. The regions of high deformation are mainly located on the side of the box body, junctions of crossbeams and stiffening plates, while the high-stress areas are found at geometric discontinuities such as the edges of holes and weld seams. The first order natural frequency of the box body is close to the operating frequency, thus presenting a resonance risk. With the thickness of the side plate, the diameter of the circular beam, the height, and the width of the box body defined as design variables, the objectives were set to minimize the peak stress and maximize the first-order natural frequency, subject to the constraint that the structural mass does not increase. Through Latin hypercube sampling, the Kriging model was established to represent the response surface, and the particle swarm optimization algorithm was employed for solution. As a result, two sets of optimal solutions were obtained. The results demonstrate that, without increasing the mass, these two optimization solutions can respectively reduce the peak stress by 13.6 % and 12.9 %, and increase the first-order natural frequency by 19.7 % and 23.2 %. The research can solve the problem of the disconnection between dynamic design and static design, thereby ensuring the vibration coordination and comprehensively improving its mechanical performance, providing theoretical and engineering references for the optimization of mining vibrating separators.
Highlights
- An analytical framework that links dynamic characteristics with structural optimization was established, which can address the issue of disjointed traditional dynamic and static designs.
- A multi-objective collaborative optimization strategy for key parameters such as strength, stiffness, and mass was proposed, thereby overcoming the limitations of single-objective optimization.
- The Latin hypercube sampling, Kriging response surface model, and particle swarm algorithm were incorporated into the optimization plan, which can effectively enhance the optimization accuracy and efficiency.
1. Introduction
Mining vibrating separator, also called vibrating screening equipment, often encounters problems such as mismatched vibration parameters, especially when the amplitude fluctuates by about ±15 %, fatigue wear of key components such as the screen frame and vibrator, shortened average service life, and reduced separation efficiency [1, 2]. Furthermore, the core load-bearing structures suffer from excessive strength redundancy combined with insufficient rigidity [3]. In vulnerable areas, such as the weld joints of stiffening plates, local vibration-induced deformations reaching up to 2.5 mm occur due to inadequate structural rigidity. These deformations significantly increase the risk of equipment failure and severely hinder production continuity and economic efficiency. Against this backdrop, it is necessary to analyze the dynamic characteristics of mining vibrating screens and optimize their structure, aiming to enhance structural strength and rigidity while reducing unnecessary mass. This work is crucial for improving the equipment's adaptability to complex feed materials, extending its service life, and reducing operational and maintenance costs.
Many scholars have conducted extensive and in-depth research on the performance optimization of vibrating separators. In terms of dynamic characteristics, Kumar [4] used the discrete element method (DEM) to simulate the movement trajectory of materials on the vibrating screen surface, analyzed the influence of excitation frequency and amplitude on the screening efficiency of materials, and proposed a strategy to improve screening accuracy by dynamically adjusting excitation parameters, providing a new perspective for the optimization of equipment dynamic performance. The Smith team [5] established a vibration separation system model based on multi-body dynamics (MBD), considering material damping and screen surface elasticity, and explored the vibration response of the system under different working conditions, identifying resonance risk areas and providing key references for structural vibration resistance design. In the aspect of structural optimization, Sarkar [6] adopted the topology optimization method to conduct lightweight design of the vibrating screen frame structure, achieving a 12 % weight reduction while ensuring static strength, but did not fully consider the change in structural stiffness under dynamic conditions. On the other hand, Gao and Zhao [7, 8] utilized the response surface method to optimize the installation position of the exciter and the tension force of the screen mesh, effectively enhancing the uniformity of the screen surface amplitude, but paid insufficient attention to the coordinated optimization of the overall structure's strength and stiffness. Although certain achievements have been made in existing research, there are still significant deficiencies in addressing the core demand for the collaborative optimization. For example, the dynamic characteristics are disconnected from structural design. Most structural optimizations are based on static loads and do not take into account the dynamic loads during actual equipment operation, such as material impact loads and vibration inertial forces, resulting in insufficient stiffness or excessive strength under dynamic conditions [9-11]. Besides, current research mostly focuses on single objective such as lightweighting or strength enhancement, which is not beneficial to the enhancement of comprehensive performance. There, this paper presents a research scheme featuring coupling characteristics. The innovations are primarily manifested in the following aspects:
(1) An analytical framework that links dynamic characteristics with structural optimization was established, which can address the issue of disjointed traditional dynamic and static designs.
(2) A multi-objective collaborative optimization strategy for key parameters such as strength, stiffness, and mass was proposed, thereby overcoming the limitations of single-objective optimization.
(3) The Latin hypercube sampling, Kriging response surface model, and particle swarm algorithm were incorporated into the optimization plan, which can effectively enhance the optimization accuracy and efficiency.
2. Analysis of dynamic characteristics
2.1. Establishment of the dynamic model
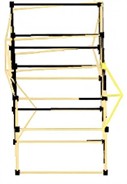
The structure and composition of the vibrating separator are shown in Fig. 1(a), and it mainly operates relying on a vibration source. The centrifugal inertial force generated by the rotation of the eccentric mass can serve as the key excitation force, causing the screening and separation box to vibrate. The screening and separation box is the core component for achieving material screening and separation. It is used to hold the materials to be screened, and through vibration, the materials are separated according to properties such as particle size. The supporting springs function to support the screening and separation box as well as provide buffering and vibration damping. They ensure the stable vibration of the screening box and reduce the transmission of vibration to the base. The base provides the installation foundation and support for the entire vibrating screen, guarantees the stability of the equipment during operation, and bears the load of the equipment and materials. The vibration source supplies vibration power to make the screening and separation box vibrate, and vibration is realized through the centrifugal force generated by rotating components, among other means.
Fig. 1Schematic diagram of structural and mechanical analysis
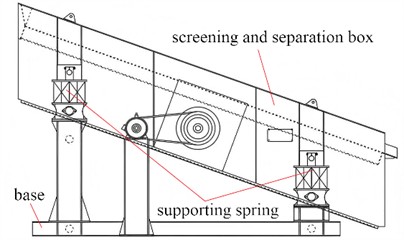
a) The composition of the vibrating separator
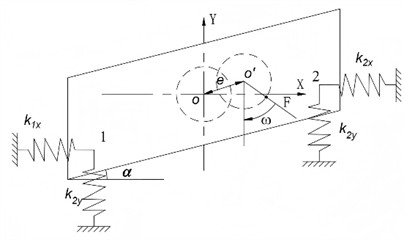
b) Mechanical model
The overall dynamic model of the vibrating separator is established as shown in Fig. 1(b). In order to effectively obtain the fundamental coupling relationship between excitation and response of the vibration separator, under transient conditions, the dynamic model is approximately simplified to an ideal undamped state, reducing the nonlinearity of the motion equation, which makes it easier to derive the analytical solution and clearly presents the dominant laws of core forces such as inertial force and elastic force. Relevant physical quantities of the vibrating separator are defined as follows: eccentricity , rotational angular velocity , equivalent mass of the vibrating screen system , equivalent stiffness in each direction , , , vibration direction angle , and force action angle . According to Lagrange’s equation of motion, combined with the constraint characteristics of the rigid body, the motion equation of the vibration separator in the system can be established as follows:
where represents the moment of inertia about the center of mass, and are the components of the center of mass coordinates, and is the rotation angle, and is the distance from the spring support point to the center of mass, and is the excitation force.
Due to damping and the transient response, after a period of operation, they will gradually weaken until reaching zero. Therefore, only the steady – state solution of the forced vibration remains for the motion of the machine body:
From this, the displacement amplitudes , , and can be derived as:
where and are the amplitudes of the rotation angles in two directions of the screen body.
2.2. Multi-rigid body dynamics analysis
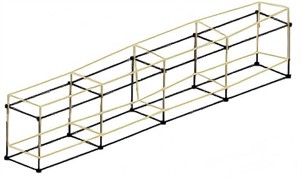
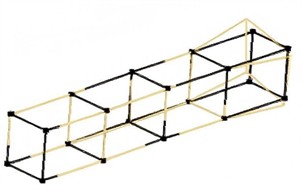
For the vibration separator model with complex structure, if the simulation model is to be established completely according to the actual structure, it will not only be difficult and time-consuming to model, but also increase the requirements for computer hardware performance, which greatly reduces the simulation calculation speed and affects work efficiency [12, 13]. The simplified model can significantly reduce the number of degrees of freedom by removing non-critical geometric features, merging components, or using equivalent stiffness or mass substitution, making the simulation analysis faster and more efficient, especially suitable for iterative calculations and parameter optimization of multi-body dynamics. Due to the large size of the screen mesh, with numerous and dense mesh holes, it is simplified into an equivalent plate with the same mass, length, width and thickness. The partial fillets, chamfers and threaded connections are also simplified. Certain components and structural features of the vibrating screen have a negligible impact on the simulation results, including oil holes, exciter guards, screen fixing devices, motors, transmission components, all of which need to be removed. In addition, microscopic features such as part surface textures are ignored, focusing on retaining the macroscopic structure that affects the overall stiffness and mass distribution. The simplified model file, saved in Parasolid format, was imported into ADAMS. This format was selected for its excellent compatibility with multi-body dynamics simulation software, which ensures the complete retention of the model’s original geometric features and topological relationships during import. In ADAMS/View, gravity was applied to the simulation environment to replicate the gravitational load that the vibration separator bears in actual operating conditions. Given the absence of relative motion between the key components of the vibration separator in practical work, Boolean operations were employed to achieve integral connection of the components, as shown in Fig. 2, thereby ensuring the structural integrity of the simulation model and avoiding false relative displacement during calculation. Subsequently, the density parameter of each component was assigned based on its actual material properties. This step is essential to accurately calculate the inertial parameters (e.g., mass, moment of inertia) of the model, which directly affect the dynamic response results of the simulation. Finally, combined with the actual operating conditions of the vibration separator, corresponding constraints were set in the constraint interface of ADAMS, so as to simulate the realistic motion constraints of the system and lay a foundation for the subsequent dynamic simulation analysis. Fixed joints are set between each support base of the vibration separator and the ground, and revolute joints are set between the excitation shaft and the bearing block.
According to the working principle of the vibrating separator, it is known that the screen box is flexibly connected to the base through support springs, and the initial stiffness and damping parameters in x and y directions are shown in Table 1.
Table 1The definition of material properties
Parameters | / (N/mm) | / (N/mm) | Parameters | / N/(mm/s) | / N/(mm/s) |
Elastic stiffness | 1850 | 620 | Damping coefficient | 7.5 | 2.5 |
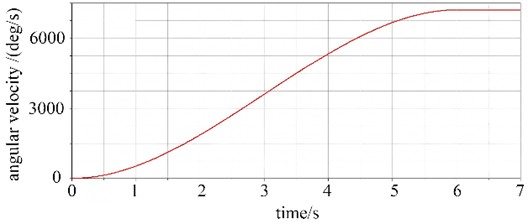
According to the rated working conditions, the motor speed is defined as 1200 r/min. In the ADAMS environment, the rotational speed characteristic of the eccentric mass is set as step(0,0,6,7200d), as shown in Fig. 3. In this function, the first two parameters are the step start time (0 s) and the initial angular velocity (0°/s), while the last two parameters are the step end time (6 s) and the rated working angular velocity (7200°/s). The simulation time is set to 7 seconds and the simulation steps to 10,000. After the simulation calculation is completed, the displacement, velocity and acceleration curves and data of the vibration separator can be exported through the ADAMS post-processing module, and these data can be processed accordingly.
Fig. 2Multi-rigid body dynamics model of the vibrating separator
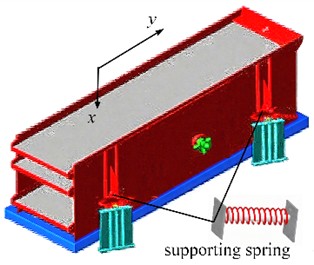
Fig. 3Speed characteristics
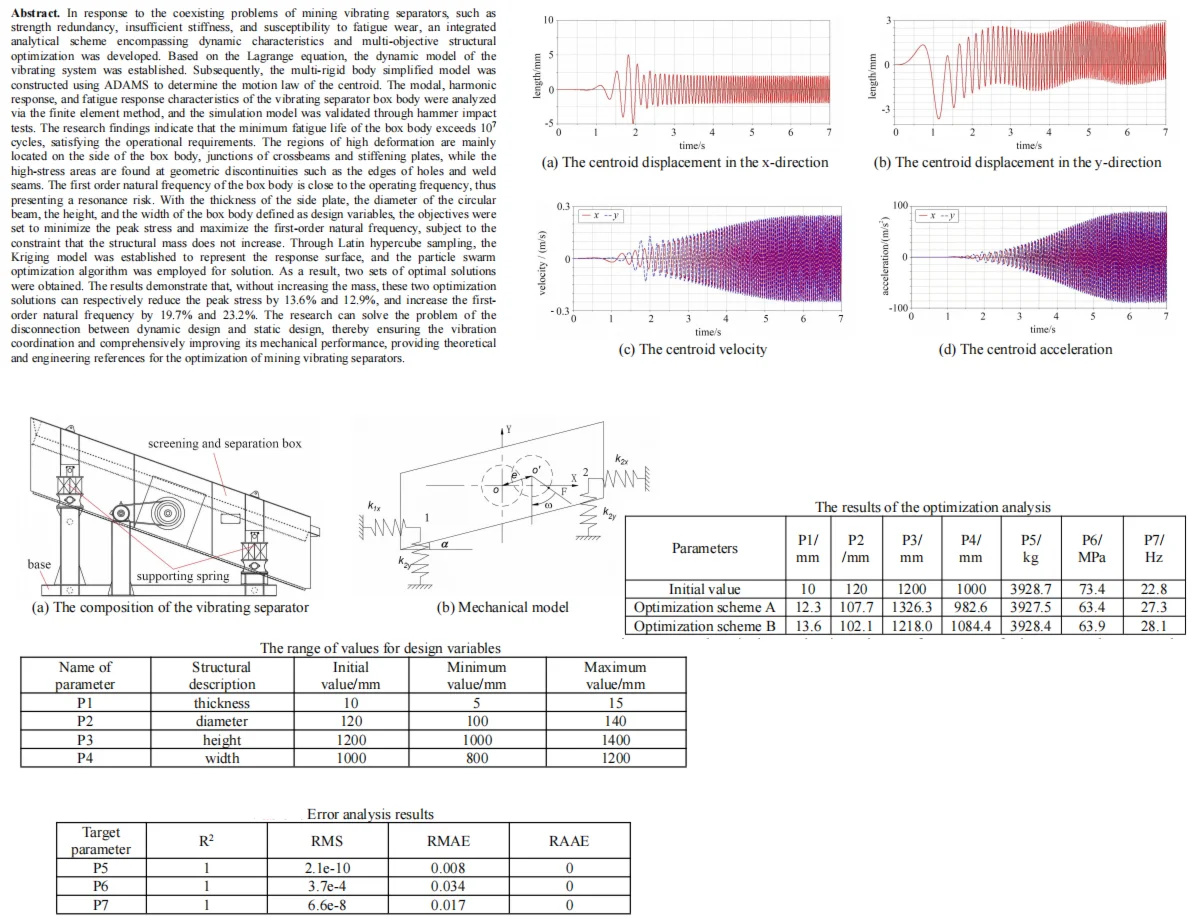
Through simulation analysis, the kinematic curves of the centroid of the vibration separator are presented in Fig. 4. It can be observed that the centroid displacement remains stable in the initial stage. Within 1-2 seconds, it fluctuates rapidly to reach a large amplitude and then approaches stable harmonic vibration. In -direction, there is a distinct harmonic vibration with a non-zero equilibrium position, accompanied by the superposition of static and dynamic deformations. Both the velocity and acceleration curves of the centroid exhibit a progression from initial stability to enhanced dynamic response, ultimately entering a phase of stable periodic fluctuations. This relatively smooth start-up process is beneficial for mitigating the impact on the equipment’s structure and connecting components at the moment of start-up, thereby reducing the risk of equipment damage during start-up operations. The amplitudes of velocity and acceleration serve as indicators of the vibration intensity of the vibration separator. In the vertical () direction, the velocity amplitude ranges from 0.2 to 0.3 m/s, while in the inclined () direction, it lies between –0.2 and 0.2 m/s. The stable velocity fluctuations suggest that during the stable operating phase, the vibration separator can generate vibrations continuously and regularly. This ensures the uniformity and continuity of material screening, which is conducive to enhancing the screening efficiency.
In the vertical () direction, the acceleration amplitude spans from –80 to 80 m/s2, and in the inclined () direction, it ranges from –60 to 60 m/s2. The stable acceleration ensures that the vibration separator can exert a consistent and continuous force on the materials during operation. This is instrumental in facilitating better material stratification and screening, thereby improving the screening quality. Larger velocity and acceleration amplitudes signify that the vibration separator can provide a more intense vibration. This is beneficial for enhancing the processing capabilities of viscous materials and strengthening the loosening and stratification effects of the materials. However, it also imposes higher demands on the strength and stiffness of the equipment structure. Conversely, if the amplitudes are too small, it may result in inefficient screening and difficulties in material passing through the sieve.
Fig. 4The kinematics curve of the centroid
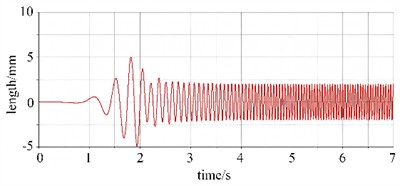
a) The centroid displacement in the x-direction
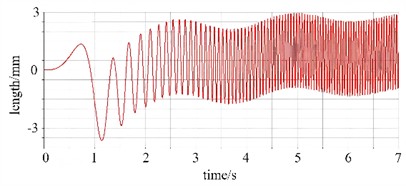
b) The centroid displacement in the y-direction
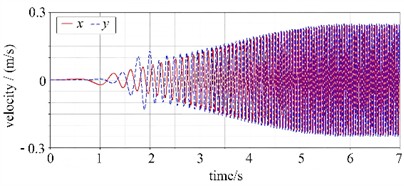
c) The centroid velocity
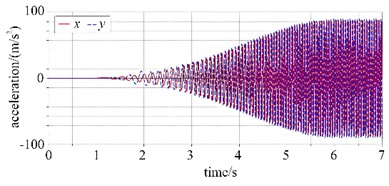
d) The centroid acceleration
2.3. Modal and harmonic response analysis
Modal analysis of the vibrating separator is an important means to study the dynamic characteristics of the vibrating separator. During the operation of the vibrating separator, components such as the motor will generate excitation at a certain frequency. Through modal analysis, the natural frequency of the vibrating separator can be determined [14]. In the design stage, structural parameters of the vibrating separator, such as the size of the screening box, material, and arrangement of stiffeners, can be adjusted accordingly, so that the natural frequency of the vibrating separator avoids the external excitation frequencies that may be encountered during operation, preventing the occurrence of resonance. Resonance will cause a sharp increase in the amplitude of the vibrating separator, leading to the structure being subjected to excessive stress, which may then cause structural damage and shorten the service life of the equipment. The vibrating separator is discretized into a finite number of elements. By establishing the stiffness matrix, mass matrix, and damping matrix of the elements, and then assembling them to form the overall system matrix. According to the boundary conditions and material properties of the vibrating separator, the eigenvalue problem of the system can be solved, so as to obtain the natural frequency and mode shape of the vibrating separator.
The screen box body is made of Q345 low alloy high strength steel, which can withstand the impact of materials and the alternating stress caused by its own vibration during operation. During the vibration process, the screen box will be subjected to frequent impacts. Good toughness can prevent the screen box from brittle fracture under impact loads. In addition, the material of the screen box needs to have a high fatigue strength to ensure that it does not fail due to fatigue during long-term use. After appropriate heat treatment, the mechanical performance parameters of this alloy steel are shown in Table 2. It has a high fatigue strength and is suitable for vibrating screens that work at high frequencies and for long periods.
Table 2The definition of material properties
Property | Density | Tensile strength | Yield strength | Elongation | Elastic modulus | Poisson’s ratio |
Value | 7.85 g/cm3 | 650 MPa | 420 MPa | 25 % | 220 GPa | 0.28 |
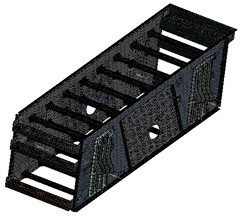
The connection methods involved in the box of the vibrating separator mainly include welding and bolt connection, and there is no relative motion between parts. Therefore, the Bonded constraint is adopted to limit the relative motion between parts. As shown in Fig. 5, simulated springs are used to apply spring boundary constraints in three directions to the 4 spring supports of the vibrating screen. A mass point is applied at the position of the vibrator of the vibrating separator to replace the function of the simplified eccentric vibrator on the vibrating separator, thus ensuring the accuracy of the analysis results. In the process of finite element mesh generation, common strategies include the sweeping method, hexahedron - dominant method, and so on. For the research object in this study, the sweeping method is adopted to perform mesh generation for beam - like parts with regular geometric shapes and topological structures. By virtue of its adaptability to regular geometries, the efficiency and quality of mesh generation are ensured. For parts with complex geometric features and diverse topological relationships, such as discharge ports and feed ports, the hexahedron - dominant method is selected. Utilizing this method's ability to optimize the proportion of hexahedral meshes when dealing with complex structures, a balance between mesh quality and modeling efficiency is achieved. In addition, for key parts such as spring supports that bear relatively large loads, further mesh refinement is required. By increasing the local mesh density, the mechanical responses in stress-strain concentration regions can be accurately captured, ensuring the reliability of the analysis results. After completing the mesh generation using the above - mentioned strategies, the resulting mesh contains 765,326 nodes and 388,711 elements, and the specific distribution is shown in the Fig. 6.
Fig. 5Boundary condition setting
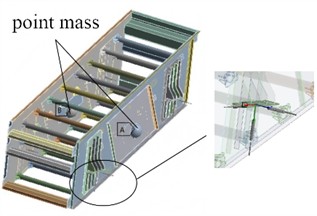
Fig. 6The division of the finite element mesh
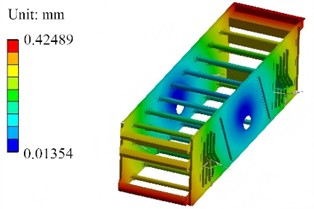
Modal analysis was performed on the vibration separator box to obtain its first four-order modal shapes and natural frequencies. The results are presented in Fig. 7, with the natural frequencies of each order being 22.82 Hz, 23.35 Hz, 24.89 Hz, and 32.23 Hz in sequence. The first-order mode shape exhibits the overall bending deformation characteristic of the box. The high deformation regions are mainly concentrated in the middle part of the box and some side plate positions. The second-order mode shape is still dominated by overall deformation, yet there exist differences in the deformation distribution compared with the first-order. The position and range of the high-deformation regions have changed, reflecting the unique vibration mode of the structure at this frequency. The overall deformation trend of the third-order mode shape is further adjusted, and the distribution of high-deformation regions changes again, which reflects the difference in structural stiffness under different vibration modes. This – order natural frequency is still in the low-frequency range and, together with the first two orders, forms the core part of the low-frequency vibration characteristics of the box, which exerts an important influence on the vibration behavior of the equipment during low-frequency operation processes such as startup and shutdown. The fourth-order natural frequency is significantly higher than those of the first three orders, and the localization feature of the mode shape is enhanced. It is no longer a simple overall deformation, and more complex vibration patterns emerge in some areas, such as local torsional deformation or large-amplitude vibration in local regions. This indicates that as the frequency increases, the structural vibration gradually transitions from being dominated by the whole to being dominated by local parts, and the stress concentration risk in the local regions with high deformation needs to be assessed. Furthermore, based on the modal analysis, it can be known that since the lowest natural frequency is relatively close to the working frequency of 20 Hz, it is necessary to optimize the structure.
Fig. 7Simulation results of the first four-order modal shapes
a) The first order (22.82 Hz)
b) The second order (23.35 Hz)
c) The third order (24.89 Hz)
d) The fourth order (32.23 Hz)
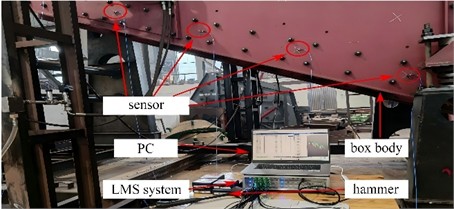
To verify the accuracy of the modal simulation results of the vibration separation box, an experimental test was carried out, and the setup is shown in Fig. 8. In this experimental system, acceleration sensors were arranged at specific positions on the box body to capture vibration response signals. The LMS system, as the core data acquisition and processing unit, was responsible for collecting and analyzing the signals from the sensors. A hammer was used to apply impact excitation to the box body, simulating the external excitation conditions that the box body might encounter during actual operation. The PC was used to control the LMS system and display the final test results. The modal parameters obtained from this experimental test are shown in Fig. 9 and Table 3.
Fig. 8Experimental verification scheme for modal. The photo was taken by the author on August 2, 2025, at a mining vibrating screen manufacturing enterprise in Qingdao City
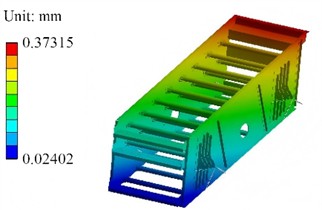
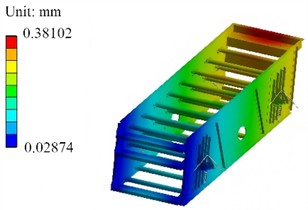
It can be seen that the maximum displacement of the first-order mode is located at the center, while that of the second and third orders is on the right side, and that of the fourth order is distributed on both sides. Based on the test results of the modal experiment, by comparing the vibration mode characteristics and the deviation of natural frequencies at different orders, it can be known that the deformation distributions are basically consistent, and the maximum deviation of natural frequencies is only 6.8 %, which can verify that the simulation model has high reliability. This also indicates that the modal simulation model accurately reflects the dynamic characteristics of the vibration separation box and can provide a solid foundation for subsequent structural optimization and vibration control design.
Fig. 9Test results of the first four – order modal shapes
a) The first order
b) The second order
c) The third order

d) The fourth order
Table 3Comparison of natural frequencies
Order | The first order | The second order | The third order | The fourth order |
Simulation results / Hz | 22.82 | 23.35 | 24.89 | 32.23 |
Test results / Hz | 24.18 | 25.06 | 26.02 | 34.40 |
Deviation / % | 5.6 | 6.8 | 4.3 | 6.3 |
In accordance with the requirements of mining enterprises, the discrete data of excitation vibration are defined as presented in Table 4. The frequency range below 5 Hz mainly corresponds to the low-frequency vibrations and excitations during the start-up and shutdown phases of the vibrating separator. It is essential to ensure that the structure exhibits a certain anti-vibration margin in the low-frequency range. The PSD (Power Spectral Density) values in the 5-15 Hz frequency range are relatively high, primarily due to factors such as material impact and the continuous excitation of the vibrator. This frequency range is the core of the vibration response. Therefore, special attention should be paid to the deformation and stress of the structure within this frequency range. As the frequency increases, the vibration energy attenuates to some extent. However, it is still influenced by factors such as high-frequency vibration harmonics of equipment and high-frequency collisions of materials, resulting in a decrease in the PSD values.
Table 4Excitation vibration data
Frequency / Hz | 1 | 5 | 10 | 15 | 18 | 30 |
PSD value / (g2/Hz) | 0.02 | 0.08 | 0.15 | 0.18 | 0.08 | 0.05 |
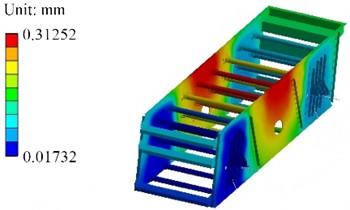
Based on the modal vibration modes and PSD input data, the results of the harmonic response analysis can be obtained in Fig. 10. It can be observed that the regions with relatively large deformations are concentrated on the sides of the vibration separator box body, as well as at the junctions of some cross - beams and stiffening plates. Prolonged operation may lead to a situation where the stiffness is relatively insufficient [16]. This suggests that these locations are more significantly influenced by vibration under harmonic response excitation. It also can be known that, unlike the modal analysis of vibration without excitation, Fig. 10(a) can show the deformation response result under external load. Although the overall structure is symmetrical, due to the active vibration source being distributed on the right side, the structural deformation at this position is significantly higher than that at the locations far from the vibration source. It should be noted that the calculated displacement results are not deterministic instantaneous displacement values, but rather response statistics based on probability and statistics. Their essential physical meaning refers to the effective values of displacement responses of the structure under random excitation loads, which reflect the average energy level of random displacements.
The stress concentration areas are distributed at the geometric discontinuities of the structure, such as near holes and welds, as shown in Fig. 10(b). Even if the deformation at these locations is not substantial, the risk of fatigue cracking may still exist due to stress concentration. For equipment such as vibrating separators that are subjected to long-term dynamic loads, taking into account risks such as resonance, the safety factor is typically set at 3.5. That is to say, the allowable stress is 120 MPa, which is relatively close to the maximum stress. To further guarantee that the stress level of the structure under this harmonic response meets the requirements, it is essential to carry out an optimization design of the structure, namely to reduce the maximum stress.
Fig. 10Response spectrum analysis results
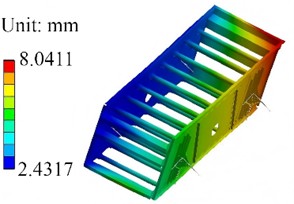
a) Deformation contour plot
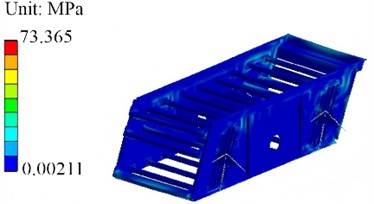
b) Stress contour plot
2.4. Fatigue response analysis
Based on the results of the harmonic response analysis and in conjunction with the S-N curve of the material, the fatigue analysis results are presented in Fig. 11. The fatigue damage value is a dimensionless quantity computed according to the Miner linear damage accumulation theory [17]. The nearer the value is to 1, the closer the damage is to failure. In this case, the overall damage value is significantly less than 1, indicating that although the structure is currently influenced by cyclic loads, the fatigue damage has not yet presented a threat to its normal operation. The numerical value of the fatigue life represents the upper limit of the number of cyclic loads that each component of the structure can endure under the current harmonic response load. As per the analysis results, the lowest fatigue life can reach over 107 cycles, which far exceeds the number of usage cycles of conventional industrial vibrating separators. Therefore, it meets the requirements for fatigue response.
Fig. 11Fatigue analysis results
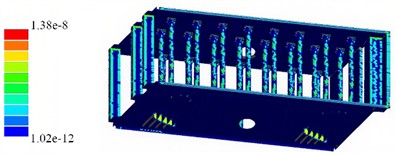
a) Fatigue damage
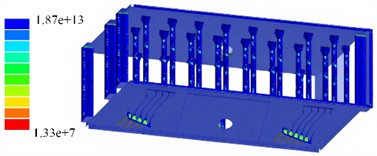
b) Fatigue life/s
3. Multi objective optimization of mechanical structure
3.1. Definition of design variables and optimization objectives
In the optimization design of the vibration separator, the optimization objectives are defined as minimizing the peak stress and maximizing the first order natural frequency. The constraint condition is that the mass should not be increased. Variables such as the side plate thickness (P1), circular beam diameter (P2), box body height (P3), and box body width (P4) are critical as they directly alter the structural stiffness and force distribution of the vibration separator. Thus, these variables are defined as design variables, as depicted in Fig. 12 and Table 5. There exists a crucial influencing relationship between the design variables and the optimization objectives. For example, increasing the side plate thickness and the circular beam diameter can enhance the structure’s resistance to deformation, thereby reducing the peak stress. The design variables are intricately associated with both the structural stiffness and mass distribution [17]. By increasing the stiffness and adjusting the mass distribution, they can exert an impact on the first-order natural frequency, facilitating its maximization.
The variations in these four design variables directly act on the mass of the vibration separator. Generally, an increase in thickness, diameter, box body height, or width will lead to an increase in mass. Nevertheless, through a rational optimization of the variable combination, the mass can be controlled to remain within the original value during the adjustment process, thereby satisfying the constraint requirements. P1, P2, P3, and P4 correspond to the dimensions of different key components. They possess a certain degree of independence and can separately reflect the influence of different structural components on the optimization objectives and constraint conditions. Moreover, they are highly representative, encompassing the dimensional parameters of the main structural dimensions of the vibration separator. As such, they can comprehensively describe its structural characteristics and effectively propel the optimization process forward. To facilitate the representation of the optimization objectives, the mass is defined as P5, the peak stress is defined as P6, and the first order natural frequency is defined as P7.
Fig. 12Definition of design variables
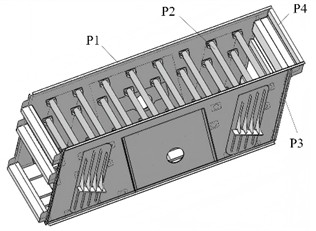
Table 5The range of values for design variables
Name of parameter | Structural description | Initial value / mm | Minimum value / mm | Maximum value / mm |
P1 | Thickness | 10 | 5 | 15 |
P2 | Diameter | 120 | 100 | 140 |
P3 | Height | 1200 | 1000 | 1400 |
P4 | Width | 1000 | 800 | 1200 |
3.2. Construction of response surface function
For the structural optimization of the vibrating separator, the response surface function is a crucial factor determining the internal relationship between the design variables and the optimization objectives [18, 19]. To ensure the accuracy of the surrogate model, the Latin hypercube design method is employed to obtain discrete data. Part of the sample data sets are presented in Table 6. This sample design approach can address the issues of efficiency and accuracy in scenarios involving multiple variables and interferences. Moreover, the interference only affects the overall level of the response value and does not alter the relationship between the independent variables and the response. The Latin hypercube design can cover all parameter levels and effectively control the interference, significantly reducing the time cost of finite element simulation.
Table 6Discrete design samples
No. | P1 / mm | P2 / mm | P3 / mm | P4 / mm | P5 / kg | P6 / MPa | P7 / Hz |
1 | 7.2 | 118 | 1050 | 920 | 4142.6 | 68.9 | 21.7 |
2 | 12.8 | 105 | 1320 | 1150 | 3848.7 | 79.8 | 24.8 |
3 | 5.5 | 135 | 1200 | 880 | 4011.9 | 74.4 | 22.6 |
4 | 14.3 | 122 | 1080 | 1050 | 4294.2 | 67.2 | 20.1 |
... | ... | ... | ... | ... | ... | ... | ... |
30 | 13.9 | 120 | 1100 | 870 | 3895.6 | 82.1 | 25.2 |
Among the common response surface models, the Polynomial Response Surface Method (PRSM) relies on linear or quadratic polynomial fitting. It is applicable only to weakly nonlinear problems. For the strong coupling relationships between parameters, stress, and frequency in the structural optimization of vibrating separators, PRSM exhibits a large fitting deviation. The Radial Basis Function (RBF) can handle nonlinear issues. However, it is highly sensitive to sample distribution. In the optimization of vibrating separators, due to uneven coverage of the variable space, RBF is prone to prediction fluctuations. Support Vector Regression (SVR) necessitates intricate parameter tuning, and it is challenging to ensure its accuracy with small sample sizes. In comparison, the Kriging model stands out with its strong nonlinear fitting capabilities. By means of the variogram, it can precisely capture the complex mapping relationships between multiple variables and optimization objectives of vibrating separators, resulting in lower prediction errors. The Kriging model demonstrates excellent adaptability to small samples. It can significantly reduce the cost of finite element simulations and circumvent the distribution sensitivity problem associated with RBF. The Kriging model is a surrogate model grounded in the theory of spatial interpolation. The design variables form a multi-dimensional space, and the optimization objective represents the response value within this space. Based on the Kriging model, a nonlinear mapping relationship between design variables and optimization objectives, namely the response surface function, is established (as depicted in Fig. 13). This function is utilized to achieve high-precision predictions for regions that have not been sampled.
Table 7Error analysis results
Target parameter | RMS | RMAE | RAAE | |
P5 | 1 | 2.1e-10 | 0.008 | 0 |
P6 | 1 | 3.7e-4 | 0.034 | 0 |
P7 | 1 | 6.6e-8 | 0.017 | 0 |
To validate the accuracy of the Kriging model, several error analysis metrics were employed, namely the coefficient of determination (), root mean square error (RMS), mean absolute error (RMAE), and mean absolute relative error (RAAE), as presented in Table 7. For each optimization objective, the value of is equal to 1. This implies that the model can effectively account for the variations in the target parameters. The mapping relationship has been fully captured by the model, leaving no unexplained random fluctuations, thus achieving an ideal state of fitting. The RMS is at an extremely low order of magnitude. This indicates that the mean of the squared deviations between the model’s predicted values and the results of finite element simulations is minimal. Numerically, the prediction accuracy meets the requirements of engineering optimization. The maximum value of RMAE is merely 0.034, which represents a negligible absolute deviation. This suggests that there are no proportional errors in the model's predicted values.
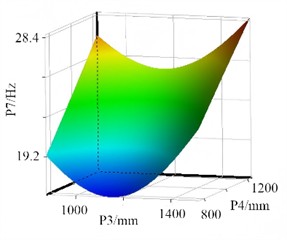
Fig. 13The response surface models
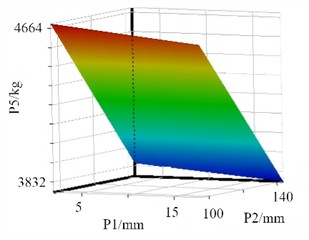
a) The response surface of P1 and P2 for P5
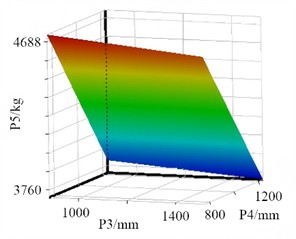
b) The response surface of P3 and P4 for P5
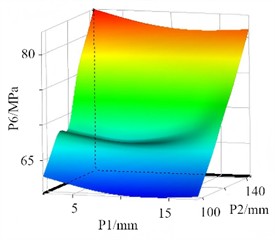
c) The response surface of P1 and P2 for P6
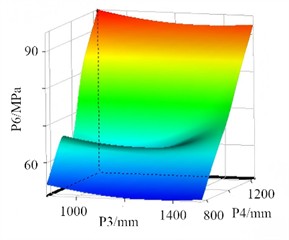
d) The response surface of P3 and P4 for P6
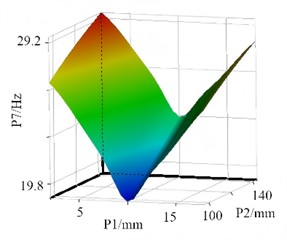
e) The response surface of P1 and P2 for P7
f) The response surface of P1 and P2 for P7
3.3. Analysis and discussion of optimization results
In the structural optimization of vibrating separators, the optimization mathematical model is the core logical framework that links design variables, constraint conditions, and optimization objectives. It realizes the goal of seeking the optimal structural solution within the scope of compliance through quantitative representation. The optimization mathematical model is constructed as follows:
where is the initial mass, and represent the minimum and maximum values of the ranges for each design variable.
When it comes to solving design variables, common algorithms include the genetic algorithm, simulated annealing algorithm, gradient descent method, and particle swarm optimization (PSO) algorithm. Considering the characteristics of the optimization mathematical model of the vibrating separator, comparatively, the PSO algorithm exhibits simplicity, high efficiency, and robustness. It better meets the demands of multi-variable, highly non-linear, and high-efficiency scenarios. This algorithm can directly control the variable range by means of position boundaries. It demonstrates strong adaptability to non-linear mappings and can stably yield feasible solutions.
Based on the optimized mathematical model, in the structural optimization of the vibrating separator, the side plate thickness (P1), the diameter of the circular beam (P2), the height of the box body (P3), and the width of the box body (P4) are regarded as design variables. The constraint condition is that the mass (P5) should not increase. The optimization objectives are to minimize the peak stress (P6) and maximize the first - order natural frequency (P7). Utilizing the particle swarm optimization algorithm, the core parameters of optimized schemes A and B were ultimately selected, as presented in Table 8. Evidently from the table, both optimized schemes strictly satisfy the constraint of non - increasing mass. The mass of scheme A is 3927.5 kg, representing a 0.03 % reduction compared to the initial value. The mass of scheme B is 3928.4 kg, showing only a 0.01 % reduction relative to the initial value. This successfully achieves a synergy between the improvement of structural performance and mass control. For schemes A and B, P6 decreases to 63.4 MPa and 63.9 MPa respectively. Compared to the initial value, the reduction rates are 13.6 % and 12.9 % respectively. This effectively enhances the structural fatigue resistance and reduces the risk of cracking during the service life. Regarding the optimization of the natural frequency, P7 of schemes A and B increases to 27.3 Hz and 28.1 Hz respectively. Compared to the initial value, the growth rates are 19.7 % and 23.2 % respectively. This makes the natural frequency of the vibrating separator deviate further from the typical operating frequency range (20 Hz), significantly weakening the resonance effect.
Table 8The results of the optimization analysis
Parameters | P1 / mm | P2 / mm | P3 / mm | P4 / mm | P5 / kg | P6 / MPa | P7 / Hz |
Initial value | 10 | 120 | 1200 | 1000 | 3928.7 | 73.4 | 22.8 |
Optimization scheme A | 12.3 | 107.7 | 1326.3 | 982.6 | 3927.5 | 63.4 | 27.3 |
Optimization scheme B | 13.6 | 102.1 | 1218.0 | 1084.4 | 3928.4 | 63.9 | 28.1 |
When comprehensively evaluating the performance of the two schemes, scheme B demonstrates a more prominent advantage in terms of increasing the natural frequency, resulting in a better resonance avoidance effect. Although scheme A has a slight edge in stress control, the stress values of both schemes meet the allowable stress requirements of the material.
4. Conclusions
1) Through the analysis of dynamic characteristics, the core problems of the mining vibrating separator were clearly identified. Research findings indicate that the system enters a stable harmonic vibration state 1-2 seconds after startup. The vertical velocity amplitude ranges from 0.2 to 0.3 m/s, and the acceleration amplitude is between –80 and 80 m/s2. This can ensure the screening efficiency, however, it places high demands on the structural strength and stiffness. Modal analysis shows that the first-order natural frequency (22.82 Hz) is close to the operating frequency (20 Hz), presenting a resonance risk. Harmonic response analysis reveals that there are significant deformations at the connections of the box side, crossbeam, and stiffening plates, and stress concentrations occur at geometric discontinuities such as hole edges and welds. Although the current fatigue life (exceeding 107 cycles) meets the requirements, it is necessary to reduce stress and stay away from the resonance frequency through optimization.
2) Research shows that the established optimization method system is highly reliable and practical. Latin hypercube sampling can reduces the cost of finite element simulation. The Kriging model can accurately capture the coupling relationship between variables and objectives. The particle swarm algorithm can efficiently solve multi-objective models. The modal simulation model was validated via hammer-impact tests. The results indicated that the maximum deviation of the natural frequency was less than 6.8 %. This finding further authenticated the reliability of dynamic analysis and optimization, thereby laying a solid foundation for subsequent design work.
3) Through multi-objective optimization research, two different dimension reconstruction schemes were screened out. The research shows that both Scheme A and Scheme B meet the mass constraint. Compared with the initial value (73.4 MPa), the peak stress of Scheme A and Scheme B is reduced by 13.6 % (63.4 MPa) and 12.9 % (63.9 MPa) respectively, enhancing the structural fatigue resistance ability. Compared with the initial value (22.8 Hz), the first order natural frequency of Scheme A and Scheme B is increased by 19.7 % (27.3 Hz) and 23.2 % (28.1 Hz) respectively, weakening the resonance effect. Scheme A is slightly superior in stress control and is suitable for scenarios with strict requirements for low stress. Scheme B has more prominent advantages in increasing the natural frequency and avoiding resonance, making it suitable for working conditions with significant resonance risks.
References
-
Y. Guo, Y. Fang, X. Li, D. Jin, and H. Liu, “Simulation of screening characterization of double-deck vibrating screen of slurry TBM tunnelling using integrated CFD-DEM-FEM,” Tunnelling and Underground Space Technology, Vol. 158, No. 1, p. 106399, Apr. 2025, https://doi.org/10.1016/j.tust.2025.106399
-
S. M. Arifuzzaman, K. Dong, and A. Yu, “Process model of vibrating screen based on DEM and physics-informed machine learning,” Powder Technology, Vol. 410, No. 9, p. 117869, Sep. 2022, https://doi.org/10.1016/j.powtec.2022.117869
-
R. N. Ferreira, J. C. Falleiros, P. R. Zampieri, J. V. Ferreira, and M. L. Bittencourt, “Experimental and numerical fatigue evaluation of lightweight crankshafts,” Results in Engineering, Vol. 23, p. 102730, Sep. 2024, https://doi.org/10.1016/j.rineng.2024.102730
-
S. Zhou, L. Meng, Y. Du, and Z. Wang, “Dynamic analysis of a new type of linear vibrating screen with adjustable vibration direction angle,” Vibroengineering Procedia, Vol. 58, pp. 8–13, May 2025, https://doi.org/10.21595/vp.2025.24791
-
V. Franchuk, O. Antsiferov, and A. Shkut, “Dynamics of a vibrating screen with two motor-vibrators,” in IOP Conference Series: Earth and Environmental Science, Vol. 1348, No. 1, p. 012063, May 2024, https://doi.org/10.1088/1755-1315/1348/1/012063
-
X. Sun, Y. Sui, Y. Zheng, L. Wang, and H. Zhu, “Finite element analysis and optimization design of large vibrating screen based on equivalent static load method,” Engineering Research Express, Vol. 6, No. 1, p. 015528, Mar. 2024, https://doi.org/10.1088/2631-8695/ad3520
-
Z. Li, J. Liang, H. Zhou, S. Zheng, and X. Tong, “Study on the screening performance and parameter optimization of linear vibrating screen under the influence of sieve plate airflow,” Particulate Science and Technology, Vol. 42, No. 7, pp. 1098–1114, Oct. 2024, https://doi.org/10.1080/02726351.2024.2347838
-
S. Gong et al., “Dynamic analysis and optimization of the coupling system of vibrating flip-flow screen and material group,” Symmetry, Vol. 16, No. 7, p. 913, Jul. 2024, https://doi.org/10.3390/sym16070913
-
W. Yu Wen and T. Jia Hui, “Dynamic analysis of elliptical vibrating screen based on disc motor,” Australian Journal of Mechanical Engineering, Vol. 21, No. 2, pp. 418–427, Mar. 2023, https://doi.org/10.1080/14484846.2020.1851867
-
Z. Liao, Q.-H. Wang, H. Xie, J.-R. Li, X. Zhou, and P. Hua, “Optimization of robot posture and workpiece setup in robotic milling with stiffness threshold,” IEEE/ASME Transactions on Mechatronics, Vol. 27, No. 1, pp. 582–593, Feb. 2022, https://doi.org/10.1109/tmech.2021.3068599
-
J. Lu, B. Li, W. Ge, C. Tan, and B. Sun, “Analysis and experimental study on servo dynamic stiffness of electromagnetic linear actuator,” Mechanical Systems and Signal Processing, Vol. 169, No. 15, p. 108587, Apr. 2022, https://doi.org/10.1016/j.ymssp.2021.108587
-
H. K. Celik, I. Akinci, N. Caglayan, and A. E. W. Rennie, “Structural strength analysis of a rotary drum mower in transportation position,” Applied Sciences, Vol. 13, No. 20, p. 11338, Oct. 2023, https://doi.org/10.3390/app132011338
-
J. Wang, C. Xu, Y. Xu, X. Qi, Z. Liu, and H. Tang, “Vibration analysis and parameter optimization of the longitudinal axial flow threshing cylinder,” Symmetry, Vol. 13, No. 4, p. 571, Mar. 2021, https://doi.org/10.3390/sym13040571
-
S. Vulovic, M. Zivkovic, A. Pavlovic, R. Vujanac, and M. Topalovic, “Strength analysis of eight-wheel bogie of bucket wheel excavator,” Metals, Vol. 13, No. 3, p. 466, Feb. 2023, https://doi.org/10.3390/met13030466
-
H. D. Chalak, A. M. Zenkour, and A. Garg, “Free vibration and modal stress analysis of FG-CNTRC beams under hygrothermal conditions using zigzag theory,” Mechanics Based Design of Structures and Machines, Vol. 51, No. 8, pp. 4709–4730, Aug. 2023, https://doi.org/10.1080/15397734.2021.1977659
-
B. A. Nitalikar, D. R. Kulkarni, and Z. A. Patel, “Structural and finite element analysis of steering yoke of an automobile,” International Journal of Engineering and Management Research, Vol. 10, No. 5, pp. 168–175, 2020, https://doi.org/10.1007/10.31033/ijemr.10.5.13
-
P. Purwanto, N. F. Qaidahiyani, M. S. Ikbal, and D. Djamaluddin, “Shear strength analysis of rock due to the effect of surface roughness based on laboratory testing and numerical modeling,” Materials Science Forum, Vol. 1091, No. 1, pp. 81–92, Jun. 2023, https://doi.org/10.4028/p-q863a9
-
D. Perfetto, C. Pezzella, V. Fierro, N. Rezazadeh, A. Polverino, and G. Lamanna, “FE modelling techniques for the simulation of guided waves in plates with variable thickness,” Procedia Structural Integrity, Vol. 52, No. 1, pp. 418–423, Jan. 2024, https://doi.org/10.1016/j.prostr.2023.12.042
-
R. Talebitooti, M. Zarastvand, and H. Darvishgohari, “Multi-objective optimization approach on diffuse sound transmission through poroelastic composite sandwich structure,” Journal of Sandwich Structures and Materials, Vol. 23, No. 4, pp. 1221–1252, Jun. 2019, https://doi.org/10.1177/1099636219854748
About this article

The paper is supported by provincial scientific research projects (62874155).
The datasets generated during and/or analyzed during the current study are available from the corresponding author on reasonable request.
The authors declare that they have no conflict of interest.
