Abstract
Permafrost in the Qinghai-Tibet Plateau is highly susceptible due to thawing and degradation under the climate warming and extreme warming events, which can trigger surface subsidence and uplift phenomena. This study investigates the vertical surface deformation along the Qinghai-Tibet Engineering Corridor (QTEC) based on the dataset derived from interferometric synthetic aperture radar (InSAR) processing of the ascending and descending Sentinel-1 datasets. Using the geographical detector method, 24 potential factors influencing deformation was selected, including climatic, topographic, soil, hydrological, vegetation index, and cryospheric indicators to explore the driving mechanisms according to the q-value of factor detection processing. Results indicate that climatic factors (mean annual temperature and precipitation) and permafrost-related parameters (surface frost number, freezing index, thawing index) are the primary drivers of vertical deformation, with the q-value greater than 0.095. Topographic parameters (latitude, elevation, topographic relief, slope, longitude) also significantly influence deformation with the -value between 0.054 and 0.086, followed by the east-west deformation rate and soil organic matter content with the -value at 0.052, while other factors with the q-value less than 0.05. This study elucidates the intrinsic mechanisms driving surface subsidence and uplift along the QTEC, providing a theoretical foundation for the construction of future infrastructure projects and the maintenance of existing engineering facilities in permafrost regions.
Highlights
- What's the driving force for the permafrost section in QTEC?
- How do the influencing factors interact with each other?
- How to obtain vertical deformation based on InSAR?
- GeoDetector analysis for deformation raster dataset in permafrost zones.
- The driving mechanism of environmental factors on surface deformation.
1. Introduction
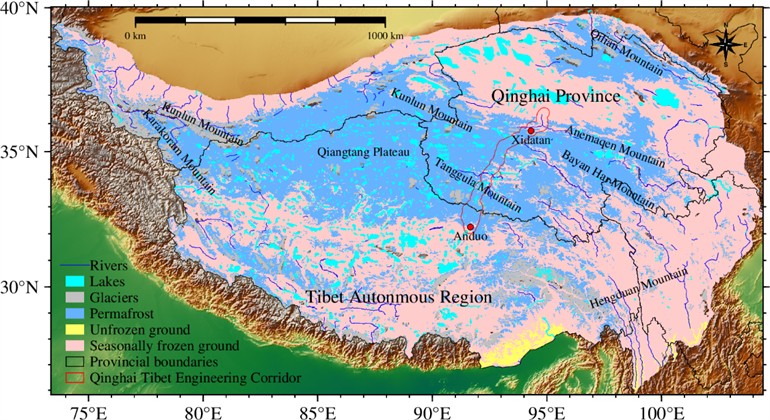
The permafrost on the Qinghai-Tibet Plateau (QTP) is developed and with a large area approximately 1.06×10⁶ km2, accounting for 40 % of the entire plateau (Fig. 1). Under the influence of climate warming and extreme warming events, permafrost degradation is severe and many negative phenomena have emerged [1]. Specifically, it is mainly manifested in the increase of ground temperature, thawing of permafrost, thickening of the active layer, decrease in continuity, discontinuities in the profile, formation of local thawed zones or expansion, deepening, or penetration of thawed zones, as well as a shortening of the freezing period, prolongation of the thawing period, signs of areal shrinkage, and a trend of thinning permafrost [2-4]. The thawing and freezing of permafrost lead to irregular or uneven subsidence and uplift of the ground surface, which poses a significant threat to infrastructure within the engineering corridors [5], such as the Qinghai-Tibet Highway, Qinghai-Tibet Railway, direct current transmission line and towers, and buildings. In addition, with the impact of geological disasters such as earthquakes [6-7], it makes the resilience of the QTP more fragile. This presents a great challenge to the local residents’ economic income, social sustainability, climate adaptation, ecological frame, and human well-being.
Fig. 1Geographic location of the Qinghai-Tibet engineering corridor
Interferometric synthetic aperture radar (InSAR), as an emerging spatial mapping technology with the advantages of all-day, all-weather, high measurement accuracy (millimeter to centimeter level), large range, and fast speed, has been gradually applied to monitor the surface deformation of permafrost zone [8-9]. In addition, long time series deformation monitoring in the permafrost region based on time-series InSAR analysis has become increasingly common. By combining ascending and descending orbit data with InSAR deformation monitoring results, accurate surface subsidence and uplift results can be obtained [5].
Driving mechanisms of deformation in permafrost regions is a complex process influenced by a multitude of factors [8]. The majority of existing research relies on correlation and partial correlation analyses [10]. While the linear correlation between two variables can be conveniently determined by these methods, significant limitations exist. Specifically, only the combined effect of multiple variables can be reflected, which makes it difficult to reveal the spatial patterns of surface deformation. Moreover, correlation and partial correlation analyses are not suitable for categorical variables [11].
Geographical detector is a spatial analysis of variance tool designed to assess the relative importance of different factors controlling geographic phenomena, which is suitable for both categorical and continuous variables [12-14]. It is capable of analyzing interactions between multiple factors, accommodating not only multiplicative relationships but also other types of associations [11]. Additionally, it is immune to multicollinearity among independent variables, and it a good way to reveal the driving mechanisms between environmental factors and ground deformation [15].
In this research, the vertical deformation rate, derived from time-series InSAR monitoring, is employed as an index to characterize surface subsidence and uplift in the permafrost region of the engineering corridor. Meanwhile, the contribution of 24 potential influencing factors to surface deformation is quantified using the geographical detector method. The primary objectives of this research are to elucidate the intrinsic mechanisms driving surface subsidence and uplift within the QTEC, and to provide a theoretical foundation for the construction of new engineering projects and the maintenance of existing infrastructure. Additionally, the findings of this study lay the groundwork for future applications of machine learning or deep learning approaches, with the -values obtained from geographical detector analysis serving as a reference for selecting feature values.
2. Data and method
2.1. Ground deformation dataset
The deformation data utilized in this study are sourced from the research conducted by Du et al. [5], which included the velocity and time-series cumulative deformation, and are accessible through the National Tibetan Plateau Science Data Center at the unique website https://cstr.cn/18406.11.Cryos.tpdc.300400. This dataset utilizes the LiCSAR product (https://comet.nerc.ac.uk/COMET-LiCS-portal/) in conjunction with the LiCSBAS toolkit (https://github.com/comet-licsar/LiCSBAS) to generate long time-series observations of line-of-sight (LOS) deformation of both ascending and descending dataset, which fully covers the entire permafrost section of the project corridor [5, 15], as the flowchart shown in Fig. 2.
Fig. 2Flowchart of the deformation production
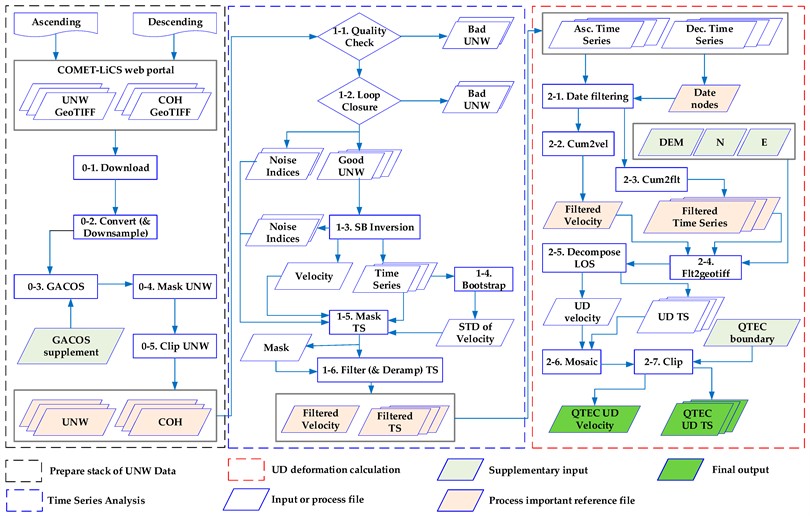
The data were filtered based on the acquisition dates of the SAR imagery and subsequently combined with the geometric parameters of the SAR satellites to derive vertical and east-west deformation results, with the north-south deformation being neglected or assume it is zero, based on the Eq. (1) [5]:
where , , , , , , and represents the LOS monitoring results of InSAR for ascending orbit, LOS monitoring results of InSAR for descending orbit, incidence angle of ascending orbit SAR radar, incidence angle of descending orbit SAR radar, azimuth angle of ascending orbit SAR radar, azimuth angle of descending orbit SAR radar, vertical deformation information, and east-west deformation information, respectively.
Table 1Geographical location and detailed information of site observation points.
Name | Longitude | Latitude | UD | Ascending LOS | Descending LOS | EW |
OP1 | 94°03.081′ | 35°37.020′ | –0.769 | –3.331 | 1.795 | 3.508 |
OP2 | 93°57.795′ | 35°33.109′ | 1.046 | –2.941 | 4.818 | 6.158 |
OP3 | 93°43.561′ | 35°30.132′ | –7.807 | –8.141 | –1.896 | 3.847 |
OP4 | 93°34.098′ | 35°24.548′ | –3.664 | –7.398 | 2.993 | 8.629 |
OP5 | 93°26.776′ | 35°21.839′ | –8.299 | –10.236 | –1.760 | 6.370 |
OP6 | 93°26.678′ | 35°21.819′ | –8.516 | –10.558 | –1.690 | 6.904 |
OP7 | 93°06.678′ | 35°12.258′ | –2.244 | –3.813 | 1.442 | 4.369 |
OP8 | 93°02.521′ | 35°08.303′ | –3.599 | –4.759 | –1.312 | 2.381 |
OP9 | 92°53.914′ | 34°40.346′ | –0.419 | –0.476 | 2.700 | 0.307 |
OP10 | 92°44.608′ | 34°34.532′ | –6.525 | –5.204 | –4.624 | 1.129 |
OP11 | 92°43.568′ | 34°28.656′ | –2.019 | –2.704 | 0.163 | 3.110 |
OP12 | 92°25.838′ | 34°12.968′ | –0.999 | 2.308 | –2.960 | –3.629 |
OP13 | 92°20.386′ | 34°00.675′ | –6.992 | –4.581 | –6.343 | –1.342 |
OP14 | 92°14.064′ | 33°46.399′ | –6.570 | –4.333 | –5.852 | –1.108 |
OP15 | 91°56.752′ | 33°23.874′ | –1.828 | –2.628 | 9.093 | 2.316 |
OP16 | 91°45.164′ | 33°04.292′ | –2.527 | 1.334 | –4.150 | –3.506 |
Note: OP is the observation point; UD is the vertical direction (up and down); EW is the east and west direction (east and west); LOS is the line of sight (line of sight), and the deformation rate is in mm/yr | ||||||
Fig. 3Vertical deformation velocity along the QTEC
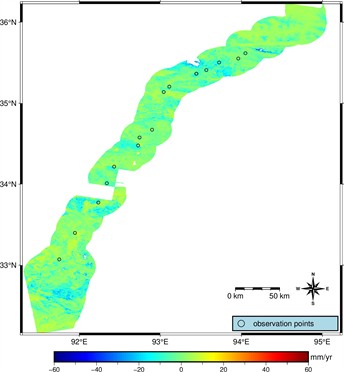
Validation against the long-time field monitoring datasets (16 observation points in total, detailed information can be seen in Table 1 and the spatial distribution can be seen in Fig. 3) revealed that the vertical deformation results exhibit errors predominantly within 10 mm, with a maximum deviation of no more than 30 mm. In contrast, the errors associated with single ascending or descending orbits results exceed 30 mm [15]. For the purposes of this study, the vertical deformation rate data from this dataset are selected to characterize the surface uplift and subsidence along the QTEC, and the vertical deformation velocity is shown in Fig. 3 (from references [5, 15]).
2.2. Environmental factors
The surface deformation in permafrost regions is mainly composed of seasonal deformation and linear deformation [5, 8-9]. Seasonal deformation is mainly controlled by soil consolidation changes caused by differences in total water content and soil properties within the active layer [9-11]. However, it is difficult to estimate the total underground water content (underground ice) on a large scale, but there are numerous proxy indicators related to it for standing for, such as terrain factors, vegetation cover, precipitation, etc. [11]. In addition, the linear deformation related to permafrost mainly depends on the thawing and outflow of underground ice during the thawing period [9], as well as the degree of freezing of underground ice during the freezing period. The related proxy indicators include temperature, precipitation, solar radiation, soil moisture, etc.
Fig. 4Topography-related factors for deformation; a)-f) are elevation, slope, aspect, topographic relief, topographic moisture index, and equivalent latitude index, in that order
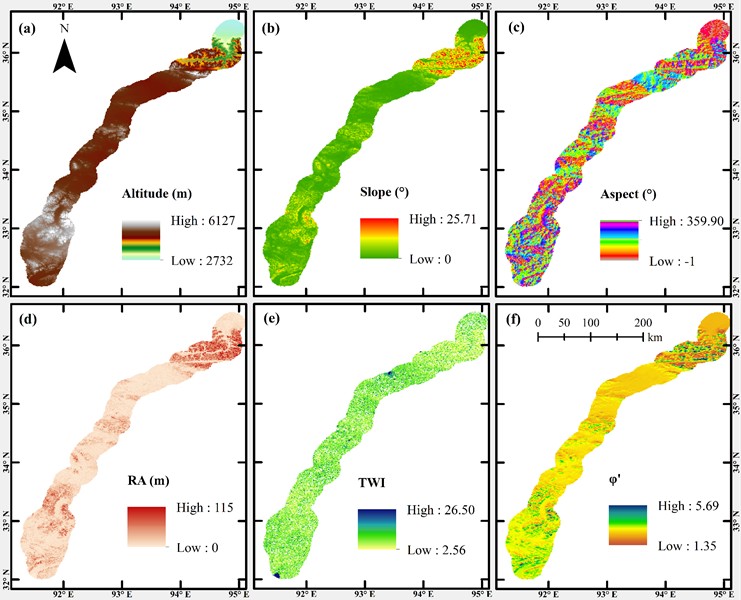
Fig. 5a) River density and b) road network density per unit raster area
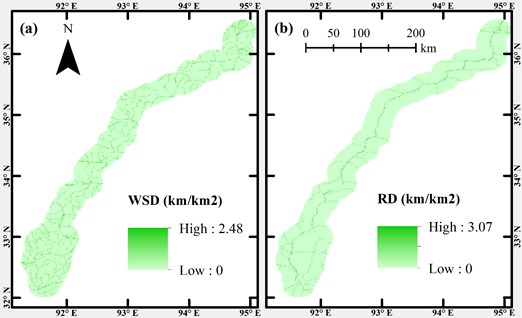
Fig. 6Soil-related influencing factors; a) soil sand content; b) soil bulk weight; c) soil porosity; d) soil organic matter content
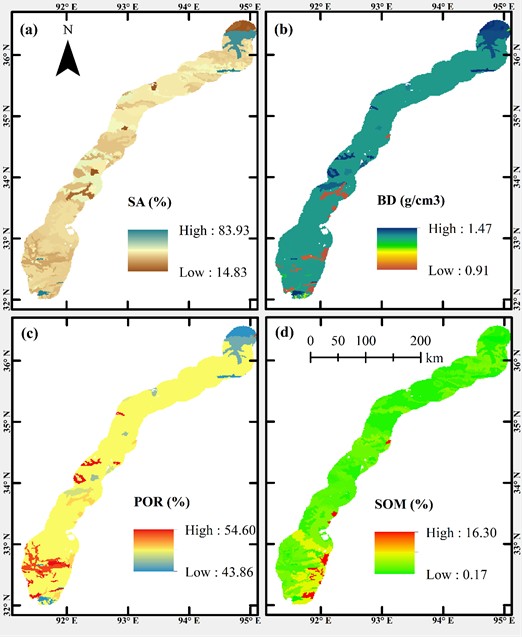
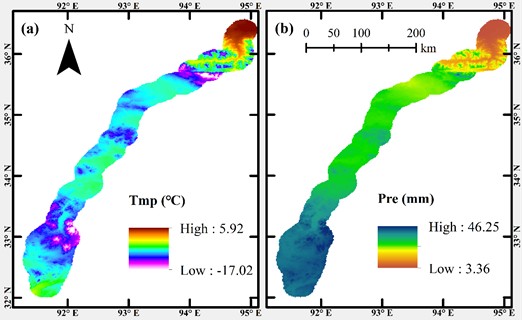
Fig. 7a) Annual average temperature and b) annual average precipitation of meteorological elements
Therefore, in this study, a total of 23 potential factors related to surface deformation were selected, encompassing both natural and anthropogenic variables, more details are shown in Figs. 4-9. These factors include: longitude, latitude, altitude, slope, aspect, rise and fall of terrain (RA), terrain wetness index (TWI), river network density (WSD) [16], road density (RD), soil sand content (SA), soil bulk density (BD), soil porosity (POR), soil organic matter (SOM) [17-18], mean annual temperature (Tmp), mean annual precipitation (Pre), equivalent latitude (), mean annual maximum NDVI (MNDVI), mean annual NDVI (NDVI), mean maximum NDVI in the growing season (GrMNDVI), mean NDVI in the growing season (GrNDVI) [19], freezing index (DDF), thawing index (DDT), and surface freezing number (SFN) [20]. Additionally, since the east-west deformation information was derived simultaneously with the vertical deformation information, the east-west deformation rate (EW) was included as the 24th explanatory factor [21] to further analyze its correlation with vertical uplift and subsidence displacements. Detailed information and processing methods for each dataset can be found in reference [5, 15].
Fig. 8Surface vegetation parameters: a) monthly maximum synthetic NDVI multi-year average; b) monthly mean synthetic NDVI multi-year average; c) monthly maximum NDVI multi-year average during the growing season (May-September each year); d) monthly mean NDVI multi-year average during the growing season
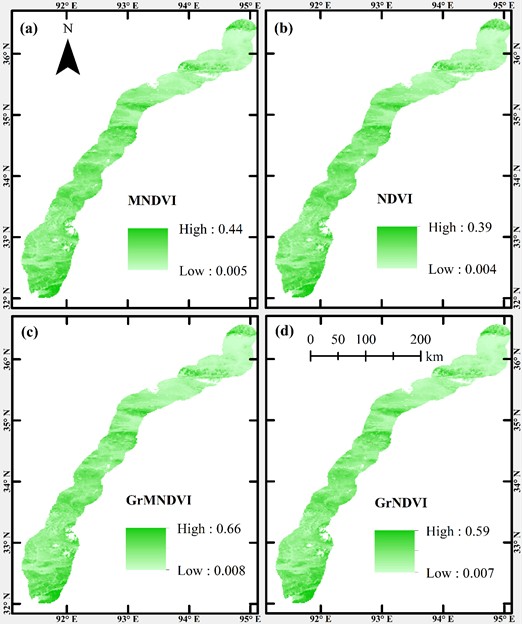
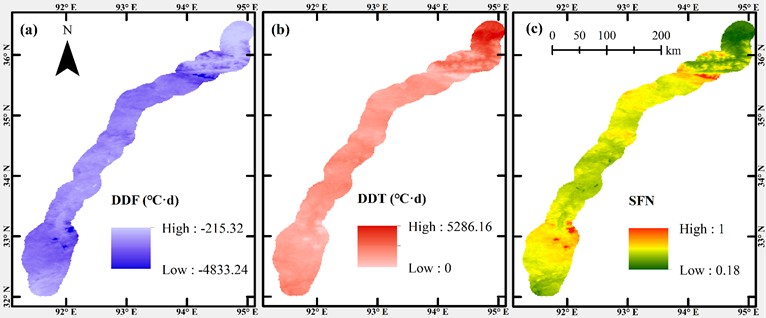
Fig. 9Frozen soil characteristics parameters: a) freezing index; b) melting index; c) surface freezing number
2.3. Geographical detector
GeoDetectors represent a novel statistical approach designed to detect spatial heterogeneity and identify the underlying driving factors, without the need for linear assumptions. The fundamental concept is to divide the study area into subregions. If the sum of the variances within these subregions is less than the total variance of the entire region, spatial differentiation is deemed to exist; otherwise, it is considered absent [12]. The GeoDetector framework comprises four detectors: the factor detector, the interaction detector, the risk zone detector, and the ecological detector [12, 21]. In this study, the factor detector and the interaction detector are employed to investigate the environmental factors driving surface deformation.
Factor detection can be used to detect the spatial variability of observation on the one hand, and on the other hand, to detect to what extent a certain influence factor explains the spatial variability of attribute , measured by the -value. The -statistic is determined by the local and global variance and is calculated using the following formula [12, 13, 21]:
where and are the number and overall variance of observations within the entire study area, and and are the number and overall variance with different layers, respectively, of observations within the th () subregion of the variable . The number of observations and the overall variance in the subregion.
Interaction detection is employed to identify interactions between different factor variables and , to evaluate whether the explanatory power for the dependent variable is enhanced or diminished under their joint influence, or to determine which factors have independent effects on [12]. This is achieved by sequentially calculating the q-values: and when the factors act individually, and when they act in combination. The interaction type is then determined by comparing the magnitudes of , , and [12, 15]. Thus, interaction detection not only yields the -value of the interaction but also identifies the type of interaction between the variables. The detailed 5 possible interaction categories are in Table 2.
Table 2Interactions between the two variables
Relationship | Interaction |
Nonlinear attenuation: the interaction of two variables nonlinearly attenuates | |
Single-factor nonlinear attenuation: the effect of a single variable is attenuated by interaction | |
Bivariate enhancement: univariate effects enhance bivariate effects through interactions | |
Independent: the effects of the variables are independent of each other, with no interactions | |
Nonlinear enhancement: nonlinear enhancement of the effects of variables |
3. Results and analysis
3.1. Driven by a single environmental factor
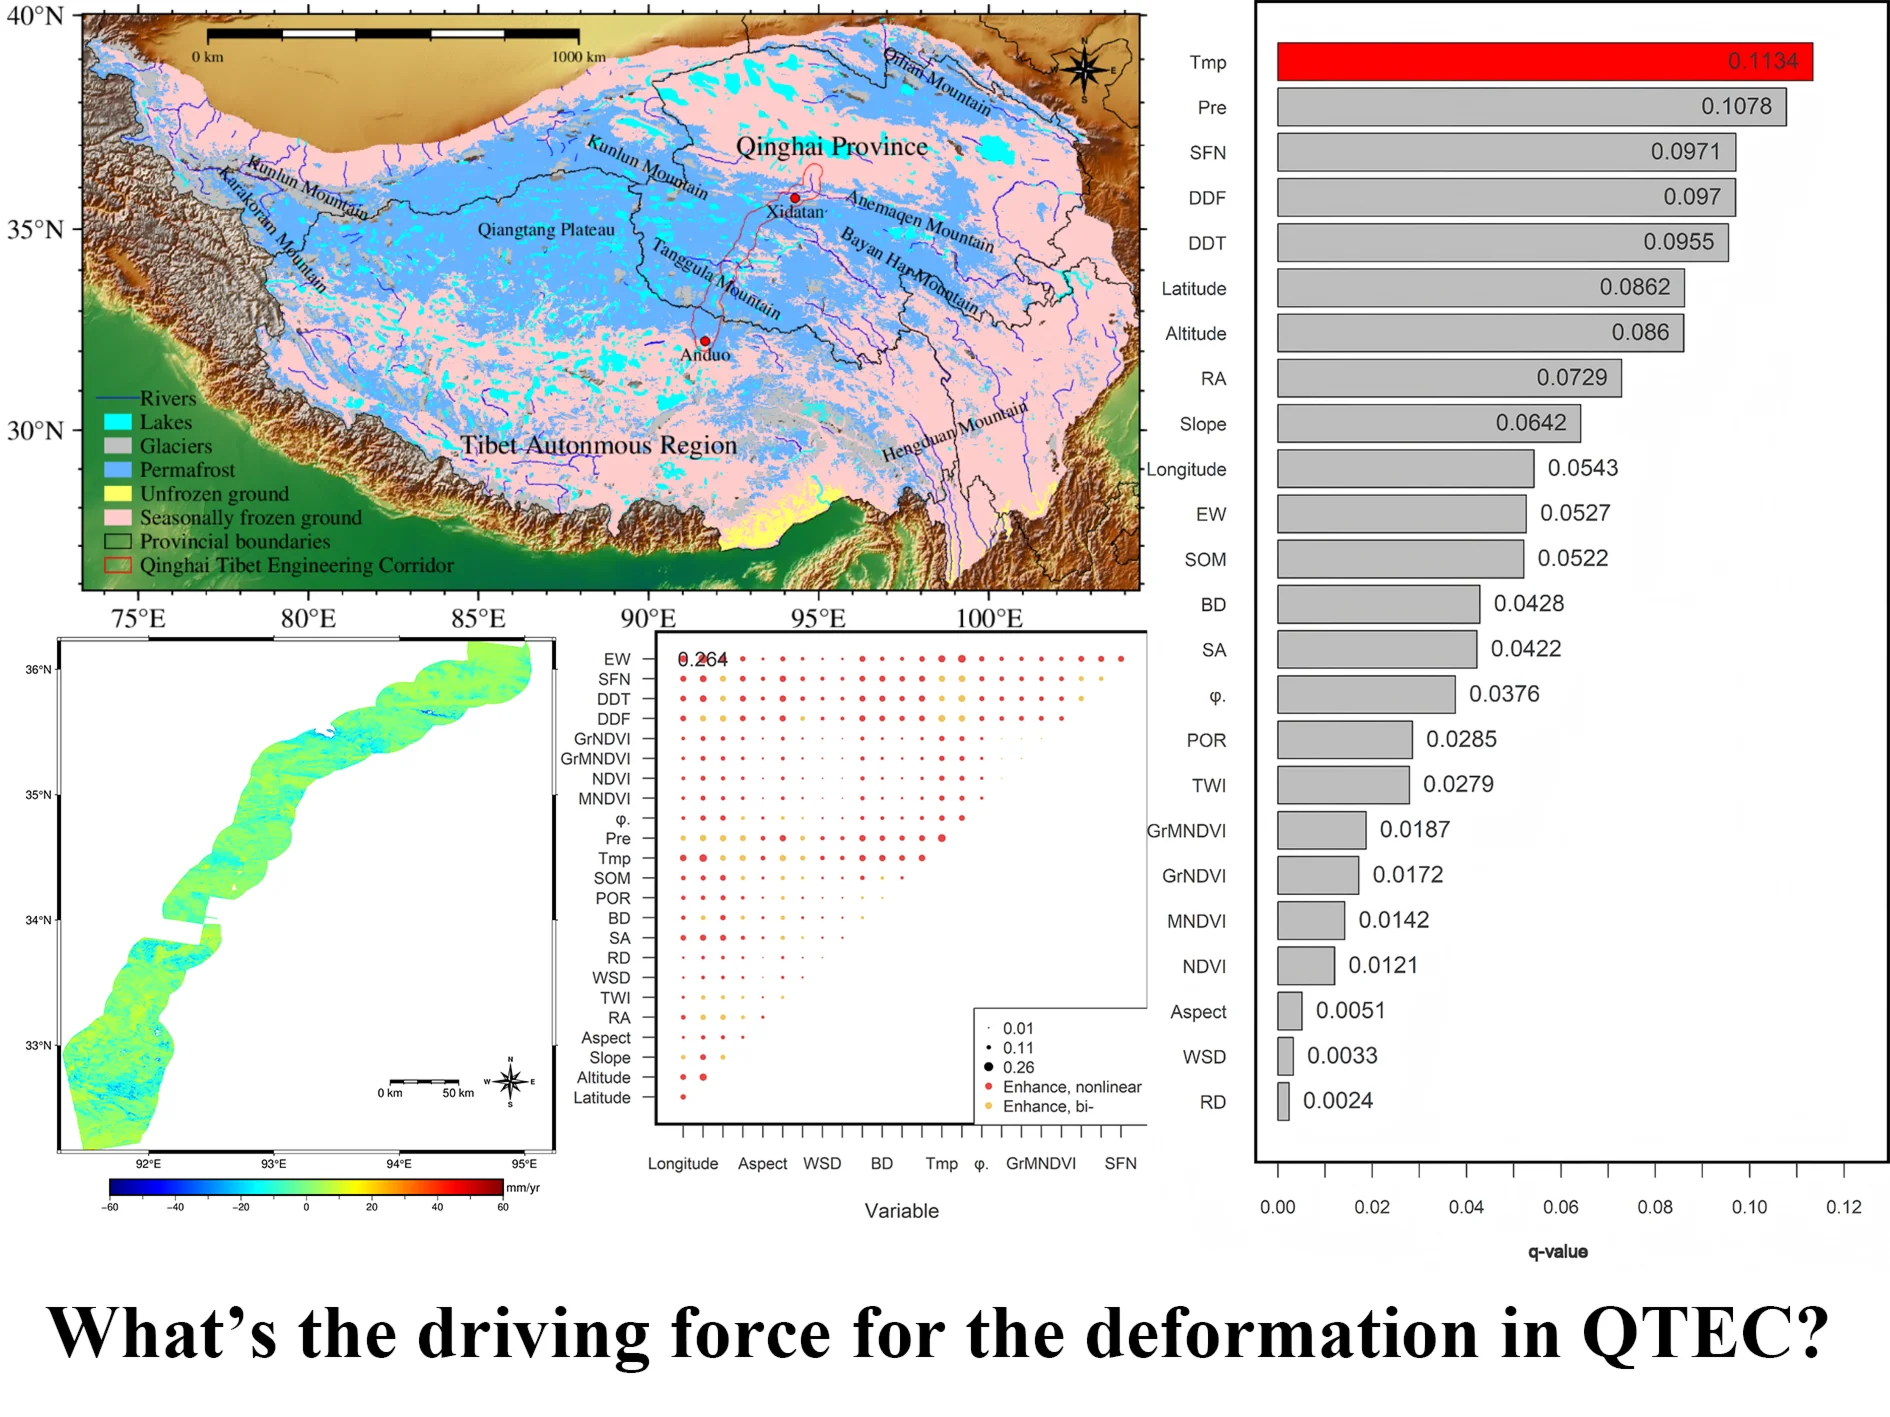
Based on the GeoDetector divergence and factor detection results (Fig. 10), all 24 influence factor indicators analyzed passed the significance test (0.05), indicating that the distributions of topography, soils, climate, vegetation, permafrost, streams, and roads all have some explanatory power for the vertically oriented deformation rates. Among these factors, the mean annual temperature exhibited the highest -value at 0.113, while road density had the lowest -value at less than 0.003.
Specifically, indicators with q-values greater than 0.1 include mean annual temperature (0.1134) and precipitation (0.1078), but the difference is not significant, it is the main factor affecting surface deformation; q-values between 0.09 and 0.1 are permafrost parameters, i.e., surface freezing numbers (0.0971), freezing index (0.097), and thawing index (0.0955); -values of latitude (0.0862) and elevation (0.086) range between 0.08 to 0.09; -values in the range of greater than 0.05 and less than 0.08 included terrain relief (0.0729), slope (0.0642), longitude (0.0543), east-west deformation (0.0527), and soil organic matter content (0.0522). The q-values of the other 12 influence factors were less than 0.05, specifically soil bulk weight (0.0428), soil sand content (0.0422), equivalent latitude (0.0376), soil porosity (0.0285), topographic moisture index (0.0279), maximum NDVI during the growing season (0.0187), average NDVI during the growing season (0.0172), and average annual maximum NDVI (0.0142), average annual NDVI (0.0121), slope orientation (0.0051), river network density (0.0033), and road density (0.0024).
Fig. 10The results of factor detection
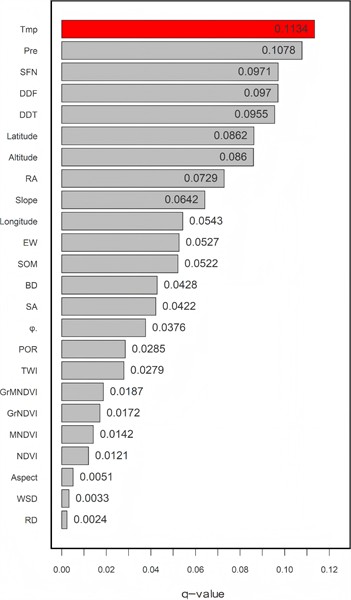
The results reveal that among various factors, surface subsidence or uplift in the permafrost region of the QTEC is mainly controlled by annual average temperature and rainfall; The frozen soil parameters such as surface freezing number, freezing index, and thawing index are secondary; Terrain factors such as latitude, altitude, terrain undulation, slope, and longitude also have a strong impact on vertical surface deformation; The content of soil organic matter and the east-west deformation of the surface also have a certain impact on the vertical deformation rate; However, the impact of other influencing factors on vertical surface deformation is relatively weak. The explanatory power of a single factor for vertical surface deformation is not significant.
Although there are many factors that affect the -value of factor detection, such as the appropriateness of factor selection, the accuracy of surface deformation results, and the segmentation method of continuous influencing factors. This article has taken into account these influencing factors in its handling. In terms of selecting influencing factors, we mainly based on previous research results [8-10, 22] and actual field investigations, while considering the availability of data comprehensively. After comprehensive analysis, we selected 24 influencing factors for this article.
According to Table 1, the verification of the accuracy of InSAR surface deformation is mainly based on actual observation results, which also show that the results of two-dimensional deformation calculation based on ascending and descending orbits are generally better than those of single ascending or descending orbit results [15, 23]. Although additional striping may occur during the two-dimensional deformation calculation process, it is found through tracing that it is caused by the descending orbit LiCSAR covering the engineering corridor. If InSAR processing is carried out based on the original Sentinel-1 data, this problem should be well solved. However, the relative importance between the influencing factors has little impact.
For the selection of discontinuous methods for continuous factors, including the equal, natural, quantile, geometric, and SD (standard deviation) methods [21]. Based on the R language GD package, we use automatic optimization algorithms for automatic segmentation, and the results obtained are currently the best. For more details, please refer to reference [15].
3.2. Interactions between environmental factors
The pairwise interactions between each influencing factor on the vertical deformation rate were further analyzed using the interaction detection feature of GeoDetectors. The results (Fig. 11) demonstrate that the explanatory power of the influencing factors on surface deformation is enhanced when considered in combination, with most interactions classified as either nonlinearly enhanced or two-factor enhanced. This indicates that the combined effect of these factors on the rate of vertical deformation is stronger than their individual contributions. This phenomenon reflects the typical characteristics of vertical surface deformation in permafrost regions from a mechanistic perspective: surface deformation is not driven by a single environmental factor, but is the result of the combined effects of multiple climate processes, terrain conditions, and permafrost thermal states.
Fig. 11Results of interaction detector
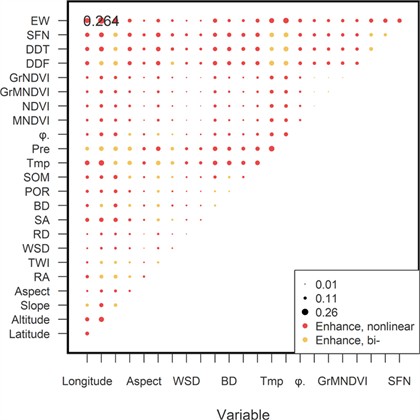
Among the interactions analyzed, the q-value of the interaction between latitude and east-west deformation rate reached 0.264. Additionally, several other pairwise interactions exhibited significant nonlinear enhancement, with q-values also reaching 0.26. These enhanced interaction q-values are more than double those of individual influencing factors, such as temperature and precipitation, temperature and latitude, freezing index and latitude, and others. Bilinear enhancement was observed in interactions such as precipitation and latitude, precipitation and elevation, surface freezing number and air temperature, surface freezing number and precipitation, and thawing index and precipitation, with interaction q-values reaching 0.2.
Concretely, the pairwise interactions involving east-west deformation rates and topographic or climatic parameters are predominantly characterized by nonlinear enhancements. In contrast, interactions between climatic parameters and either topographic or permafrost-related parameters are largely dominated by bilinear enhancements. Additionally, the pairwise interactions among other parameters exhibit a mix of both bilinear and nonlinear enhancements, with the combined explanatory power of these interactions consistently exceeding that of individual factors.
The interaction between climate parameters (such as temperature, precipitation, DDF, DDT) and terrain parameters (such as latitude, altitude) often manifests as a dual factor enhancement, due to their relatively stable linear coupling relationship in controlling surface energy balance and hydrothermal migration [9]. Terrain factors determine background conditions such as solar radiation, temperature gradients, and snow distribution, while climate factors reflect the spatiotemporal input intensity of external heat and moisture [24]. When two types of factors work together, their superposition effect can more clearly distinguish the thermal conditions and hydrothermal processes in different regions, thereby enhancing the explanatory power of spatial differences in surface deformation.
In contrast, there is generally a more significant nonlinear enhancement between the east-west deformation rate and climate or terrain parameters, with the interaction q-value usually increasing by more than one times. Horizontal deformation itself is the result of multiple internal processes such as regional structural components, changes in active layer thickness, and adjustments in underground ice structure, rather than a simple reflection of external environmental factors [11]. When horizontal deformation is superimposed with climate or terrain factors, it will amplify the sudden changes in freeze-thaw cycles, hydrothermal migration, or stress adjustment in space, resulting in a typical “1 + 1 > 2” nonlinear response [12]. Especially in different latitudes or heat zones, such interactive combinations often trigger threshold effects [25], significantly differentiating the spatial distribution of vertical deformation and reflecting significant nonlinear enhancement features.
In addition, some climate parameters and frozen soil parameters (such as DDF, DDT and SFN) also exhibit the characteristics of dual factor enhancement and nonlinear enhancement, indicating that the thermal state of frozen soil has a phased and threshold type response to external climate disturbances [9]. When the temperature rises to a certain range, precipitation exceeds a certain threshold, or the thawing index increases to a critical level, the coupling process of water and heat will sharply strengthen, leading to rapid changes in the underground ice structure and causing strong spatial differences in vertical deformation. This further explains why the interaction of most factors can significantly exceed the explanatory power of a single factor.
4. Conclusions
1) Surface deformation is mainly controlled by climatic factors (average annual temperature and precipitation) and permafrost-related parameters (surface freezing number, freezing index and thawing index); and to a lesser extent by topographic parameters such as latitude and longitude, elevation, topographic relief, slope and longitude.
2) Maximum NDVI explained the most surface deformation among the four types of NDVI, soil organic matter content had a greater relationship with surface lift conditions, and slope orientation, river network density, and road density had little effect for overall surface lift conditions.
3) Interactions between east-west deformation rates and other influences show a fine-grained nonlinear enhancement of surface deformation; combinations of permafrost parameters, climatic and topographic factors with other factors show strong nonlinear and bilinear enhancement of surface deformation.
4) The vertical deformation of QTEC exhibits significant multi factor coupled driving characteristics. There is a complex coupling and feedback mechanism between climate, terrain, hydrothermal processes, and changes in permafrost structure, which enables the interaction and combination of different factors to more effectively characterize the spatial pattern of surface deformation than a single factor.
References
-
D. Zou et al., “A new map of permafrost distribution on the Tibetan Plateau,” The Cryosphere, Vol. 11, No. 6, pp. 2527–2542, Nov. 2017, https://doi.org/10.5194/tc-11-2527-2017
-
R. Li et al., “Characteristic, changes and impacts of permafrost on Qinghai-Tibet Plateau,” Chinese Science Bulletin, Vol. 64, No. 27, pp. 2783–2795, Sep. 2019, https://doi.org/10.1360/tb-2019-0191
-
A. Sharkhuu et al., “Permafrost monitoring in the Hovsgol mountain region, Mongolia,” Journal of Geophysical Research: Earth Surface, Vol. 112, No. F2, Jun. 2007, https://doi.org/10.1029/2006jf000543
-
Wang S. et al., “Permafrost degradation on the Qinghai-Tibet Plateau and its environmental impacts,” Permafrost and Periglacial Processes, Vol. 11, pp. 43–53, 2000.
-
Q. Du et al., “Preliminary study on InSAR-based uplift or subsidence monitoring and stability evaluation of ground surface in the permafrost zone of the Qinghai-Tibet engineering corridor, China,” Remote Sensing, Vol. 15, No. 15, p. 3728, Jul. 2023, https://doi.org/10.3390/rs15153728
-
Z.-K. Huang, N.-C. Zeng, D.-M. Zhang, S. Argyroudis, and S.-A. Mitoulis, “Resilience models for tunnel recovery after earthquakes,” Engineering, Vol. 54, pp. 320–345, Nov. 2025, https://doi.org/10.1016/j.eng.2025.06.028
-
J. Niu, S. Zhang, L. Zhang, J. Zhang, and X. Jiang, “Seismic response and failure mode of a shallow overburden slope reinforced with an ecological frame beam structure,” Ecological Engineering, Vol. 222, p. 107795, Jan. 2026, https://doi.org/10.1016/j.ecoleng.2025.107795
-
S. B. Liu et al., “Application of InSAR technology to monitor deformation in permafrost areas,” (in Chinese), Journal of Glaciology and Geocryology, Vol. 43, pp. 964–975, 2021, https://doi.org/10.7522/j.issn.1000-0240.2021.0033
-
S. Liu et al., “Ground surface deformation in permafrost region on the Qinghai-Tibet Plateau: A review,” Earth-Science Reviews, Vol. 265, p. 105109, Jun. 2025, https://doi.org/10.1016/j.earscirev.2025.105109
-
T. Zhao et al., “Correlation between ground surface deformation and influential factors in permafrost regions,” (in Chinese), Journal of Harbin Institute of Technology, Vol. 53, pp. 145–153, 2021, https://doi.org/10.11918/202006098
-
J. Chen et al., “Magnitudes and patterns of large-scale permafrost ground deformation revealed by Sentinel-1 InSAR on the central Qinghai-Tibet Plateau,” Remote Sensing of Environment, Vol. 268, p. 112778, Jan. 2022, https://doi.org/10.1016/j.rse.2021.112778
-
J. F. Wang and C. D. Xu, “Geodetector: Principle and prospective,” (in Chinese), Acta Geographica Sinica, Vol. 72, pp. 116–134, 2017, https://doi.org/10.11821/dlxb201701010
-
Y. Li, W. Fan, X. Yuan, and J. Li, “Spatial distribution characteristics and influencing factors of traditional villages based on geodetector: Jiarong Tibetan in Western Sichuan, China,” Scientific Reports, Vol. 14, No. 1, May 2024, https://doi.org/10.1038/s41598-024-62666-z
-
H. Tao and J. Zhou, “Study on the geographic distribution and influencing factors of Dai settlements in Yunnan based on geodetector,” Springer Science and Business Media LLC, Scientific Reports, Apr. 2024, https://doi.org/10.1038/s41598-024-59449-x
-
Q. S. Du, “InSAR-based study for surface deformation monitoring and stability evaluation in permafrost areas of Qinghai-Tibet Engineering Corridor in the Qinghai-Tibet Plateau, China,” Northwest Institute of Eco-Environment and Resources, Chinese Academy of Sciences, Beijing, China, 2023.
-
Q. S. Du et al., “Research on the river extraction based on the DEM data in the Central West Tianshan Mountains,” (in Chinese), China Rural Water and Hydropower, Vol. 10, pp. 29–33, 2020, https://doi.org/10.3969/j.issn.1007-2284.2020.10.006
-
G. Shi et al., “A China dataset of soil properties for land surface modelling (version 2, CSDLv2),” Earth System Science Data, Vol. 17, No. 2, pp. 517–543, Feb. 2025, https://doi.org/10.5194/essd-17-517-2025
-
G. Shi, W. Shangguan, Y. Zhang, Q. Li, C. Wang, and L. Li, “Reducing location error of legacy soil profiles leads to improvement in digital soil mapping,” Geoderma, Vol. 447, p. 116912, Jul. 2024, https://doi.org/10.1016/j.geoderma.2024.116912
-
R. Cao, Z. Xu, Y. Chen, J. Chen, and M. Shen, “Reconstructing high-spatiotemporal-resolution (30 m and 8-Days) NDVI time-series data for the Qinghai-Tibetan Plateau from 2000-2020,” Remote Sensing, Vol. 14, No. 15, p. 3648, Jul. 2022, https://doi.org/10.3390/rs14153648
-
Y. Yao, K. Wu, R. Yang, H. Zhang, W. Yang, and C. Li, “Effects of surface temperature and Weber number on the dynamic and freezing behavior of impacting water droplets on a superhydrophobic ultra-cold surface,” Applied Thermal Engineering, Vol. 236, p. 121705, Jan. 2024, https://doi.org/10.1016/j.applthermaleng.2023.121705
-
Y. Song, J. Wang, Y. Ge, and C. Xu, “An optimal parameters-based geographical detector model enhances geographic characteristics of explanatory variables for spatial heterogeneity analysis: cases with different types of spatial data,” GIScience and Remote Sensing, Vol. 57, No. 5, pp. 593–610, Jul. 2020, https://doi.org/10.1080/15481603.2020.1760434
-
R. Li, M. Zhang, W. Pei, A. Melnikov, Z. Zhang, and G. Li, “Risk evaluation of thaw settlement using machine learning models for the Wudaoliang-Tuotuohe region, Qinghai-Tibet Plateau,” Catena, Vol. 220, p. 106700, Jan. 2023, https://doi.org/10.1016/j.catena.2022.106700
-
C. Fan et al., “Time-Series models for ground subsidence and heave over permafrost in InSAR Processing: A comprehensive assessment and new improvement,” ISPRS Journal of Photogrammetry and Remote Sensing, Vol. 222, pp. 167–185, Apr. 2025, https://doi.org/10.1016/j.isprsjprs.2025.02.019
-
M. Chai, N. Li, F. Liu, Y. Gao, Y. Mu, and W. Ma, “A calculation model for ground surface temperature in high-altitude regions of the Qinghai-Tibet Plateau, China,” Remote Sensing, Vol. 14, No. 20, p. 5219, Oct. 2022, https://doi.org/10.3390/rs14205219
-
F. Ji et al., “Thresholds in land-atmosphere interactions on the Qinghai-Tibet Plateau: impacts of permafrost degradation via vegetation changes,” Journal of Hydrology, Vol. 662, p. 133912, Dec. 2025, https://doi.org/10.1016/j.jhydrol.2025.133912
About this article

Thanks for the funding of the Science and Technology Program of Xizang Autonomous Region (Grant No. XZ202401ZY0040), Research Project of the Qinghai Provincial Key Laboratory of Tibet Plateau Highway Construction and Maintenance Technology (Grant No. 2024-JY-D-03), the Research Project of the State Key Laboratory of Frozen Soils Engineering (Grant No. SKLFSE-ZQ202303); the Science and Technology Program of Gansu Province (Grant No. 23ZDFA017); and the Program of the Gansu Province Science and Technology Foundation for Youths (25JRRA515).
The datasets generated during and/or analyzed during the current study are available from the corresponding author on reasonable request.
Qinsong Du was responsible for the data processing, design and writing of the entire article, and Fei Wang and Shunshun Qi responsible for the revised of the manuscript. Anhua Xu and Huimin Luo provide the funding support.
The authors declare that they have no conflict of interest.
