Abstract
The Fergana Valley is one of the most densely populated and traffic-intensive regions of Uzbekistan, where road safety remains a critical concern. This study develops a comprehensive zoning approach based on traffic safety levels by integrating statistical accident data, roadway characteristics, climatic conditions, and traffic flow parameters. A multilevel analysis was conducted to evaluate the influence of road geometry, pavement condition, traffic density, heavy-vehicle intensity, and environmental factors on accident frequency and severity. The methodology includes the calculation of a composite safety indicator incorporating relative accident rate, combined influence factor, and road-climate criteria. Measurement procedures, uncertainty estimation, and confidence intervals were applied to ensure the reliability of the collected data. The resulting zoning scheme divides the region into distinct safety categories, providing a practical framework for traffic management, infrastructure planning, and targeted accident-reduction measures. The findings highlight key risk factors and demonstrate the importance of region-specific safety zoning for improving transport operation efficiency and reducing accident risks.
Highlights
- Traffic flow parameters, including speed, intensity and density, have a direct impact on road traffic safety in the Fergana Valley.
- A safety coefficient based on traffic speed, accident rate, road conditions and climatic factors was used to assess traffic safety levels.
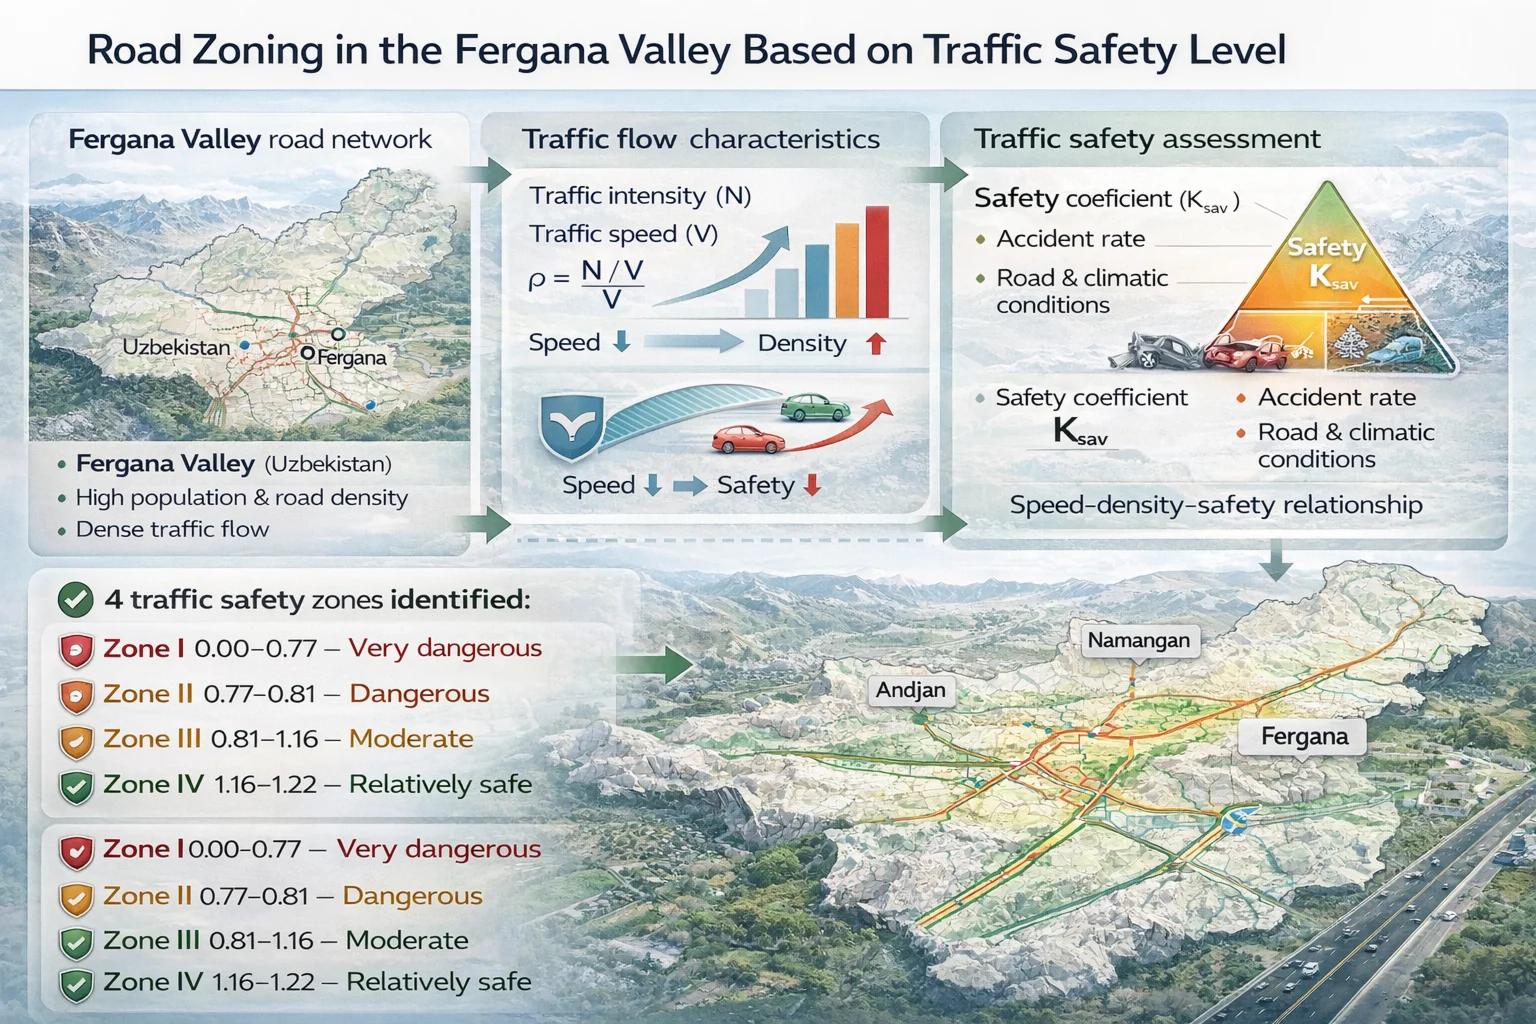
- The Fergana Valley road network was divided into four zones according to the level of traffic safety.
- The proposed zoning method allows identification of hazardous road sections and supports targeted traffic safety improvement measures.
- Traffic safety zoning improves decision-making for road maintenance, traffic management and transport planning.
1. Introduction
Road traffic safety remains one of the most critical challenges in Uzbekistan, particularly in densely populated regions such as the Fergana Valley. The rapid growth in the number of vehicles and traffic intensity has led to an increase in accidents and higher risk levels across the regional road network [1]. Previous studies indicate that roadway geometry, pavement condition, traffic speed, heavy-vehicle intensity, and climatic factors have a significant influence on crash occurrence [2-5], [7], [10].
Local research in Uzbekistan has highlighted the importance of pavement smoothness, traffic composition, and terrain in determining regional safety conditions [3], [4]. International studies similarly confirm strong correlations between pavement roughness, surface friction, and accident frequency, as well as the role of heavy trucks in reducing safety on interurban highways [11], [15].
Modern approaches to transport safety emphasize the need for statistical modeling, uncertainty estimation, and multi-factor analysis to ensure reliable interpretation of accident trends and influencing parameters [8], [9], [13]. Despite this, no integrated safety-based zoning model has been developed for the Fergana Valley that combines accident statistics, traffic flow characteristics, road-climate indicators, and infrastructure conditions into a unified framework.
To address this gap, the present study proposes a comprehensive road zoning methodology based on a Composite Safety Indicator (CSI) that incorporates accident rates, road-climate conditions, traffic density, and flow composition. The resulting zoning scheme supports evidence-based decision-making for transport planning and enhances the prioritization of safety interventions in the Fergana Valley.
2. Materials and methods
The study analyzes traffic safety conditions across the Fergana Valley based on traffic flow characteristics, road type, pavement condition, accident statistics, and climatic influences. The methodology integrates statistical analysis, experimental traffic-flow measurements, and a composite safety indicator for zoning.
2.1. Data sources
The analysis uses official statistical records on vehicle ownership, traffic accidents, and road network characteristics from regional authorities and national datasets [1-5]. Additional data on traffic flow, pavement condition, and climatic parameters were collected on major highways, including A373, 4R112, 4R115, 4R126, and 4R140.
2.2. Traffic flow measurements
Traffic flow characteristics – speed, intensity, and density – were measured using the “Trassa” mobile road laboratory. The system recorded vehicle classification, hourly flow intensity, and mean operating speed. Measurements were conducted on both two- and four-lane roads under typical daytime traffic conditions. Flow density was calculated as:
where is traffic intensity (veh/h) and is traffic speed (km/h).
2.3. Pavement and roadway conditions
Pavement condition, geometric features, lighting, pedestrian infrastructure, and roadside safety elements were assessed according to national standards. The factors most strongly associated with accident probability were identified by comparing road condition data with historical accident patterns.
2.4. Accident data and classification
Traffic accidents from the last ten years were categorized by type, cause, time of occurrence, and road category. The distribution of accident types and their underlying causes was used to determine the most hazardous sections and contributing factors.
2.5. Statistical analysis
All experimental measurements were repeated three times to ensure consistency. Standard deviation (SD) and expanded uncertainty (, 2 for 95 % coverage) were computed. Regression analysis was used to evaluate the relationship between traffic speed, flow density, and safety coefficient. Confidence intervals (95 %) were applied to validate trend stability.
In total, 48 measurement points were collected for two-lane roads and 52 points for four-lane roads. Outliers were removed using a 1.5·IQR criterion. The average standard deviation of repeated measurements was 1.7 % for speed, 2.3 % for density, and 2.0 % for the safety coefficient. The regression analysis was performed using a linear model, and the reliability of the fitted trends was validated through R², residual distribution, and confidence intervals.
2.6. Composite safety indicator (CSI)
To evaluate road safety levels, a Composite Safety Indicator was developed by integrating the relative accident rate, traffic-flow characteristics, road condition, and climatic factors. The indicator enables ranking of districts from highest to lowest safety performance and forms the basis for zoning.
3. Results and discussion
3.1. Vehicle distribution and road network characteristics
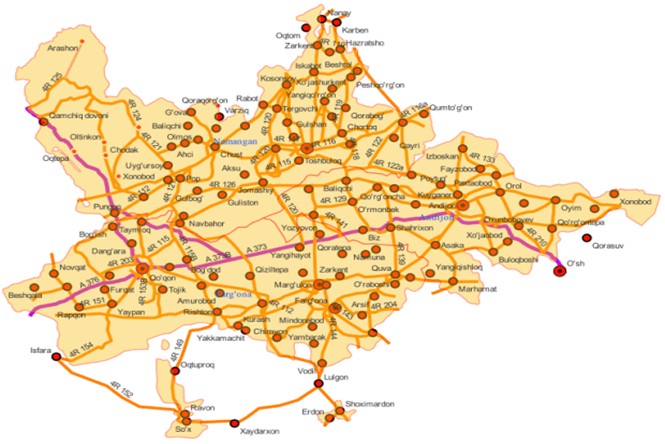
The Fergana Valley contains 995,821 vehicles, of which passenger cars represent 86.4 % and trucks 11.4 % (Table 1). Variations in vehicle concentration per kilometer of road indicate uneven transport loading, with the regional average reaching 21.05 vehicles/km. Figs. 1 and 2 illustrate the geographical layout and vehicle distribution, showing that districts with higher density experience greater exposure to traffic risk, consistent with international findings on crash probability and network load [7], [11], [15].
Table 1Vehicles owned by individuals in the Fergana Valley
Region | Passenger cars | Trucks | Specialized vehicles | Bus | Motorcycle | Overall |
Fergana | 319721 | 41463 | 437 | 4089 | 5197 | 370907 |
Andijan | 264884 | 33344 | 111 | 1633 | 4040 | 304212 |
Namangan | 275904 | 37843 | 118 | 2489 | 4348 | 320702 |
Overall | 860509 | 112650 | 866 | 8811 | 13585 | 995821 |
Fig. 1Road network map of the Fergana Valley
3.2. Accident trends and risk patterns
In 2022-2023, Uzbekistan recorded about 10,000 traffic accidents annually, with 31-35 % occurring in the Fergana Valley (Fig. 3). This confirms the region’s classification as a high-risk (“red zone”) area.
Analysis over the last decade shows that pedestrian collisions (44.9 %), vehicle collisions (31.2 %), and bicycle collisions (11.5 %) dominate crash types (Fig. 4). The predominance of pedestrian crashes reflects insufficient lighting, missing fences, and high mixed-traffic interaction, aligning with global studies [12].
Fig. 2Analysis of the distribution of vehicles and road network density by regions of the Fergana Valley
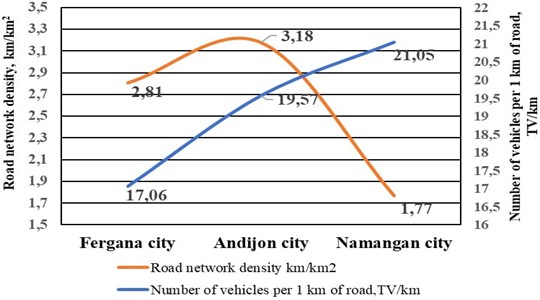
Fig. 3Distribution of traffic accidents across regions of the Republic in 2023 and their comparative analysis with 2022
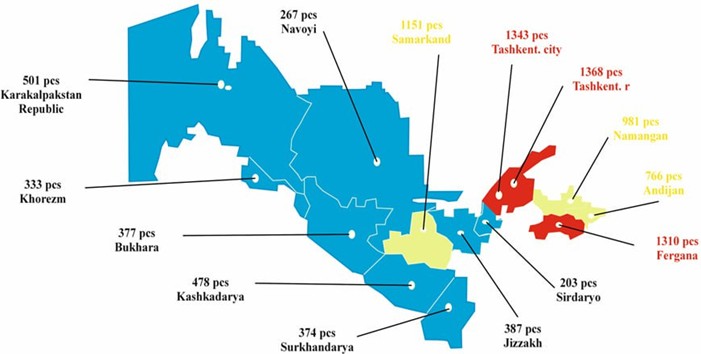
Fig. 4Distribution of road traffic accidents per 1 km of road in the Fergana Valley by types

3.3. Causes of accidents
Key contributing factors include:
1) 14 % – absence of median barriers.
2) 10 % – insufficient pedestrian barriers.
3) 9 % – inadequate lighting.
4) 14 % – speeding.
5) 17 % – failure to yield to pedestrians.
6) 8 % – dangerous overtaking.
Accidents occur most frequently on national and urban roads, while A373 and 4R112 show the highest accident density, making them the primary study corridors.
3.4. Traffic flow measurements
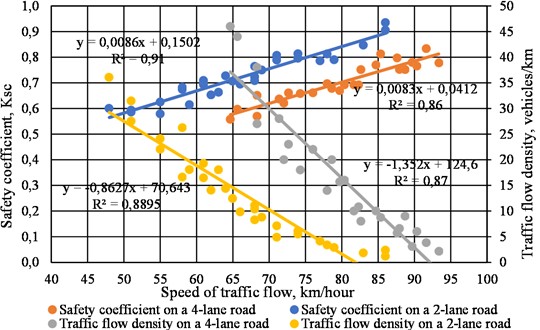
Traffic-flow analysis using the “Trassa” mobile laboratory revealed an inverse relationship between speed and density on two- and four-lane roads. The measured speed–density curves (see Fig. 5) show that increasing density reduces maneuvering space and elevates psychological load on drivers, leading to higher accident likelihood. Heavy vehicles contribute disproportionately to flow saturation, which agrees with earlier research on pavement and safety degradation under truck loads [6], [15].
3.5. Speed-density-safety relationship
Fig. 5 shows the integrated dependence between traffic speed, traffic flow density, and the safety coefficient (Ksc) for two-lane and four-lane roads.
The regression trends confirm that:
1) A 10 km/h decrease in traffic speed leads to an increase in density by +8.6 veh/km (2-lane) and +13.5 veh/km (4-lane).
2) A 10 km/h increase in traffic speed causes the safety coefficient to rise by +0.09 (2-lane) and +0.08 (4-lane).
These results indicate that speed stabilization helps prevent density escalation and significantly improves the operational safety level, especially under mixed-traffic conditions.
A detailed explanation of the unusually linear distribution of data points is provided below to address measurement reliability and model validity.
Fig. 5Integrated relationship between traffic speed, traffic flow density (left Y-axis) and safety coefficient Ksc (right Y-axis) on two-lane and four-lane roads. Linear regression lines are shown together with 95 % confidence intervals
3.6. Explanation and validation of linear trends
The observed linearity of the speed-density and speed-safety coefficient relationships in the range of 40-100 km/h is primarily due to the controlled measurement conditions. All measurements were performed on straight, uniform road segments, during daytime, under dry pavement and stable weather, and with nearly constant traffic composition. Under such stabilized traffic conditions, fluctuations in headway, braking behavior, and lateral maneuvering are significantly reduced, which results in quasi-linear trends that resemble the sub-critical region of the classical fundamental diagram.
To verify the stability of the measurements, each point was recorded three times and the standard deviation values remained within 1.7-2.5 %. Regression diagnostics showed high coefficients of determination ( 0.86-0.91), and residual analysis did not reveal clustering or heteroscedasticity. These results confirm that the fitted linear models are statistically sound for the selected measurement interval.
However, it must be emphasized that such linearity may not fully characterize congested traffic, peak-hour conditions, or non-uniform flow influenced by intersections, weather changes, or high truck intensity. Therefore, the presented linear relationships apply specifically to controlled measurement conditions.
3.7. Composite safety indicator (CSI) and zoning
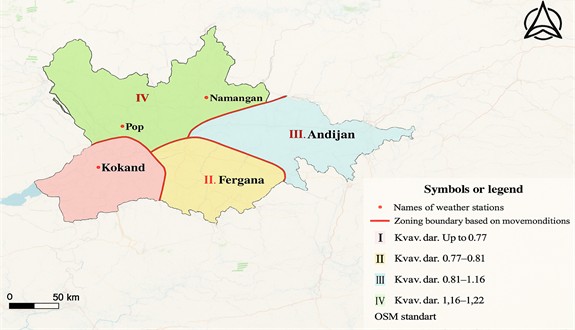
A Composite Safety Indicator was developed by integrating accident rate, traffic-flow parameters, road condition, and climatic influences. Districts were ranked “from largest to smallest” CSI value to identify zoning boundaries. The results indicate four safety zones:
1) Zone I (0.00–0.77): Kokand.
2) Zone II (0.77–0.81): Fergana.
3) Zone III (0.81–1.16): Andijan.
4) Zone IV (1.16–1.22): Namangan, Pop.
Fig. 6 presents the zoning map.
Fig. 6Road zoning map based on the level of road traffic safety
This classification allows decision-makers to prioritize investments in safety infrastructure and identify high-risk corridors requiring immediate intervention.
3.8. Practical implications and limitations
The study shows that accident risk in the region is driven by a combination of traffic load, insufficient infrastructure, and climate-induced factors. Improving lighting, installing barriers, regulating heavy-vehicle movement, and enhancing pavement quality are critical measures for raising road-safety levels.
The proposed CSI-based zoning methodology may be adapted for other regions with similar transport environments.
This classification clearly identifies areas requiring urgent safety interventions and supports the prioritization of infrastructure improvements.
The linear speed-density-safety relationships obtained in this study reflect controlled daytime traffic and may not directly apply to saturated, peak-hour, nighttime, or weather-affected conditions. Future research will expand the dataset using real-time monitoring and include non-linear traffic states to ensure broader applicability of the model.
4. Conclusions
The study evaluated the current state of traffic safety in the Fergana Valley by integrating accident statistics, traffic flow characteristics, pavement condition, and climatic influences into a unified analytical framework. The results showed that traffic density, heavy-vehicle intensity, insufficient road infrastructure, and unfavorable road–climate conditions significantly contribute to accident occurrence and severity in the region. Pedestrian-related accidents were found to be the most dominant category, highlighting deficiencies in pedestrian infrastructure and traffic management.
A composite safety indicator (CSI) was introduced to quantify the combined impact of geometric, operational, and environmental factors on road safety. Based on this indicator, the territories of the Fergana Valley were divided into four safety zones. The results revealed that Kokand represents the highest-risk zone, followed by Fergana and Andijan, while Namangan and Pop exhibit comparatively safer traffic conditions. This zoning approach provides a scientifically grounded basis for prioritizing road safety interventions.
The findings demonstrate that improving pavement quality, regulating traffic flow, enhancing lighting, installing protective barriers, and managing heavy-vehicle movements are essential for reducing accident risk across the region. The proposed zoning methodology can be used by road authorities for targeted planning of maintenance, reconstruction, and traffic management strategies. Furthermore, the approach may serve as a model for road-safety-based zoning in other regions of Uzbekistan and similar transport environments.
References
-
“Socio-economic situation of the Republic of Uzbekistan,” (in Uzbek), State Committee of the Republic of Uzbekistan on Statistics, 2023.
-
A. X. Uroqov and D. V. Tashev, “Linear zoning of automobile roads,” (in Uzbek), Scientific Technical Journal of FerPI, Vol. 3, pp. 171–175, 2019.
-
A. X. O. ‘Roqov and D. V. Tashev, “Study of traffic safety conditions on automobile roads of the Fergana Valley,” (in Uzbek), Scientific Technical Journal of FerPI, Vol. 1, pp. 14–19, 2021.
-
A. X. O. ’Roqov and D. V. Tashev, “Research of traffic safety conditions on the roads of the Ferghana Valley,” ACADEMICIA: An International Multidisciplinary Research Journal, Vol. 10, No. 6, p. 1575, Jan. 2020, https://doi.org/10.5958/2249-7137.2020.00774.0
-
A. Urakov, D. Tashev, Z. Xametov, and R. Soataliev, “Road maintenance and climate zoning of the territory of the Republic of Uzbekistan,” Lecture Notes in Networks and Systems, Vol. 402, pp. 1213–1224, Mar. 2022, https://doi.org/10.1007/978-3-030-96380-4_133
-
A. K. Urokov, R. R. Soataliyev, S. R. Khalimova, and I. B. Xoshimov, “Impact of trucks in the traffic flow on pavement condition index (PCI),” Lecture Notes in Networks and Systems, Vol. 1547, pp. 3–9, Oct. 2025, https://doi.org/10.1007/978-3-031-99028-1_1
-
A. Abdel-Aty and A. Haleem, “Crash injury severity analysis using geometry and traffic variables,” Accident Analysis and Prevention, Vol. 45, pp. 610–619, 2012.
-
S. Hashim, “Modeling traffic accident frequency using Bayesian methods,” Transportation Research Record, Vol. 2514, pp. 1–9, 2015.
-
R. Elvik, “The predictive validity of empirical Bayes estimates of road safety,” Accident Analysis and Prevention, Vol. 40, No. 6, pp. 1964–1969, Nov. 2008, https://doi.org/10.1016/j.aap.2008.07.007
-
H. Li, Y. Wang, and M. Zhang, “Impact of pavement roughness on traffic safety: A systematic review,” International Journal of Pavement Engineering, Vol. 22, No. 11, pp. 1324–1335, 2021.
-
A. Behnood and G. Olek, “Pavement surface friction and accident rates: A global review,” Construction and Building Materials, Vol. 225, pp. 1072–1085, 2019.
-
R. Tay, “Speed, speed variation and accident rates,” Transport Reviews, Vol. 29, No. 2, pp. 219–235, 2009.
-
G. Yannis, E. Papadimitriou, and T. Antoniou, “Multilevel analysis of correlated crash data,” Journal of Transportation Engineering, Vol. 133, No. 9, pp. 522–532, 2007.
-
A. Sharma and R. Mishra, “GIS-based road accident hotspot detection,” Safety Science, Vol. 122, pp. 104–118, 2020.
-
M. Xu, H. Liu, and P. Chen, “Impact of heavy vehicles on rural road safety,” Journal of Safety Research, Vol. 77, pp. 94–101, 2021.
-
X. Ma, J. Ding, and Y. Shao, “Climate impacts on road safety,” Sustainability, Vol. 12, No. 6, 2020.
-
D. Imamaliev, A. Urakov, M. Darabov, and R. Sayfutdinova, “Important risk factors for road accidents,” in E3S Web of Conferences, Vol. 264, p. 02025, Jun. 2021, https://doi.org/10.1051/e3sconf/202126402025
About this article

The authors have not disclosed any funding.
The datasets generated during and/or analyzed during the current study are available from the corresponding author on reasonable request.
The authors declare that they have no conflict of interest.
