Abstract
This study investigates the optimization of online compressor washing frequency for enhanced performance and profitability of industrial gas turbines. Two representative engines: an aero-derivative LM2500 and a heavy-duty V94.3A (also designated SGT5-4000F) were simulated in GasTurb software under varying washing intervals of one day and ten days. Experimental data were applied to model reductions in compressor isentropic efficiency and mass-flow capacity due to fouling. The results indicate that extending the washing interval from daily to every ten days for one year causes significant performance deterioration. For the LM2500, power output decreased from 7 % to 16 %, thermal efficiency from 2.6 % to 6 %, and heat rate rose from 2.7 % to 6.6 %. Corresponding changes for the V94.3A were smaller, confirming that the aero-derivative turbine is more sensitive to fouling than the heavy-duty unit. Economic evaluation showed that while more frequent washing increased wash fluid consumption and operational costs, it provides substantial financial benefits. Daily washing produced additional annual net profits of approximately £11.69 million for the V94.3A and £4.6 million for the LM2500 compared with ten-day intervals. Overall, the findings demonstrate that optimizing compressor washing frequency is essential to sustain turbine performance, improve fuel efficiency, and maximize profitability. Frequent online washing mitigates the adverse effects of fouling and ensures cost-effective, reliable, and energy-efficient gas-turbine operation.
Highlights
- The study demonstrates the significant influence of compressor washing frequency on both the thermodynamic performance and economic viability of industrial gas turbines.
- The results clearly indicate that extending the washing interval leads to increased compressor fouling, resulting in notable declines in power output and thermal efficiency.
- The study revealed that it is more economically beneficial to conduct online compressor washing once after every one day compared to once after every ten days.
1. Introduction
Online compressor washing is an effective means of mitigating the effects of fouling on gas turbine performance. However, compressor washing involves expenses such as procurement of wash fluid, equipment, manpower, etc. Appropriate scheduling the washing frequency is important to achieve economic and performance benefits of washing. Aretakis et al. [1] developed an economic optimization model for offline washing schedules, integrating engine performance simulation with a detailed cost module. The study showed that optimized washing could increase annual profit by over $1 million compared to no washing. The study concluded that site-specific degradation rates must be considered for effective washing scheduling. Thames et al. [2] conducted one of the earliest comprehensive field surveys on compressor washing practices. The study highlighted that online washing could extend intervals between offline washes, reducing downtime and associated revenue losses. The economic analysis showed that for a 22 MW turbine, avoiding a single offline wash could save approximately $1,000 net after accounting for online washing costs. The authors also added that online washing is most effective when used proactively to keep a clean compressor clean, rather than attempting to restore heavily fouled compressors.
Chen et al. [3] proposed an off-line washing schedule optimization method with a long short-term memory (LSTM) prediction model, to maximize the plant net profit. The study introduced an LSTM-based prediction model for optimizing off-line washing schedules to maximize net profit. By identifying compressor flow rate and efficiency degradation through gas path analysis, the authors reported that the proposed prediction method demonstrated superior accuracy over other algorithms. In addition, the study revealed that optimized washing schedule showed significant financial benefits, achieving a potential saving of 3.26 million Yuan compared to existing practices.
Martín-Aragón and Valdés [4] focused on the economic quantification of fouling. The authors developed a methodology linking compressor performance parameters such as isentropic efficiency, pressure ratio, and air mass flow with turbine heat rate and maximum power output. The authors reported that when a 250 MW gas turbine was operated at full load after 2000 delete equivalent hours, the compressor efficiency dropped by 1.57 %, air mass flow by 3.33 %, and pressure ratio by 1.63 %. The study revealed that degradations increased heat rate by 0.41 % and reduced maximum power by 4.8 %, resulting in an estimated economic cost of €800,000 at full load.
Hanachi et al. [5] focused on the economic optimization of compressor washing intervals under variable fouling rates and demand conditions. The authors developed a cost model that accounts for power deficit, fuel overconsumption, and washing expenses. The study revealed that optimal washing schedules can reduce annual costs significantly, demonstrating potential savings of 15.7 % over four years by optimizing washing intervals.
Musa et al. [6] conducted a viability analysis of online compressor washing across gas turbines of various sizes. The study highlighted that economic returns are more favorable for larger engines due to economies of scale and higher revenue loss per MW of degradation. The study also shows that using one washing system for multiple engines further improved return on investment (ROI), making the practice especially beneficial for power plants with several units. Ogbonnaya [7] demonstrated that combining hand cleaning, online washing, and offline washing resulted in significant gains in compressor efficiency, increasing overall operational efficiency from 39.2 % to 46.25 % for industrial gas turbines in Nigeria. The work emphasized that while online washing provides continuous fouling control, complete cleaning is achievable only through offline washing during shutdowns. Gülen et al. [8] presented a practical implementation of a real-time, on-line performance monitoring system applied to two GE Frame 7EA gas turbines over a five-month period. The system continuously tracks performance indicators such as compressor efficiency, heat rate, and exhaust temperature profiles, allowing operators to detect issues like compressor fouling and combustor imbalance early. The software-generated recommendations for compressor wash intervals and filter replacement schedules demonstrated clear economic benefits, saving up to $200,000 in annual lost capacity. Stalder, [9] conducted a study on three different online washing frequencies of 120, 352 and 700 operating hours two gas turbines. The author found that 120 hrs of wash frequency generated the highest performance amongst the others by minimizing the rate of power degradation. After extrapolating the operating hours to 8000, a huge sum of U.S $450,000 cost of power savings was recorded for one year, excluding cost of operation and maintenance. Similarly, Boyce and Gonzalez, [10] investigated the effects of prolonged operation without conducting an offline washing when two gas turbines were used. The first one was operated with washing twice a week with clean demineralised water while the other was operated throughout without washing. The results show a reduction of 2.5 % for the gas turbine that was operated without washing while the other engine is washed twice every week only showed a slight reduction in efficiency of about 0.2 %.
Rao and Naikan [11] proposed a condition-based maintenance (CBM) policy using a continuous-time Markov chain model. Their framework integrates periodic online washes with inspection-directed offline washes, with the aim of minimizing total operational costs per hour. By optimizing inspection intervals, wash frequencies, and threshold deterioration levels for initiating offline washes, the model demonstrated substantial gains: availability improved from 90.7 % to 97.3 %, operating costs reduced significantly, and unnecessary washes were minimized. Spüntrup et al. [12] present a Mixed Integer Linear Programming (MILP) model for scheduling compressor washing within a Resource Task Network framework. The study integrates degradation modelling and maintenance actions, demonstrating up to 3.3 % improvement in operational profit. The study emphasized the importance of combining online and offline washing. Xenos et al. [13] developed an MILP model for networks of compressors in air separation plants, integrating operational and maintenance decisions. The study compared online, offline, and combined washing strategies, showing that combined approach reduced total costs by 2.5-3.0 %. Hovland and Antoine [14] introduced a model predictive control (MPC) approach for optimizing compressor washing schedules. The results demonstrated that an MPC-based optimizer could reduce costs by up to 66 % compared to fixed-interval washing strategies, particularly during periods of high fuel prices. Schneider et al., [15] in their study of different frequencies of wash schedule to account for the most suitable one, stated that washing on daily basis reduces the drop in performance to a minimum, thereby increasing the period between off-line washes (offline wash schedule).
From the foregoing, it is evident that extensive research has been devoted to understanding the performance and economic implications of compressor washing in gas turbines. Studies have consistently demonstrated that optimized washing schedules whether offline, online, or combined yielded substantial cost savings, performance recovery, and efficiency improvements. Also, the transition from conventional preventive maintenance to intelligent, data-driven optimization approaches marks a significant advancement in maintenance strategies. Despite these developments, there remains a notable gap in the literature regarding the economic evaluation and optimization of online compressor washing frequency specifically for industrial gas turbines. This study, therefore, aims to address this gap by conducting a comprehensive techno-economic analysis to determine the optimal online washing frequency that maximizes performance and economic benefits.
2. Materials and methods
To investigate the techno-economic impact of online compressor washing frequency on the performance and profitability of industrial gas turbines, representative values of compressor flow capacity and isentropic efficiency reductions for different washing frequency schedules were adopted from the experimental study of Agbadede et al. [16]. In the study, fouled compressor blades were washed after every one day and every ten days. Since the compressor fouling conditions were obtained through an accelerated fouling process, it was assumed that the reported reductions in flow capacity and isentropic efficiency correspond approximately to one year of operation for an industrial gas turbine under typical field conditions.
Two engines derived from the GE LM2500 and Siemens V94.3A series of gas turbines were modeled to simulate the impact of different online compressor washing schedules on engine performance. The simulations were performed using GasTurb software, which enables rapid evaluation of the gas turbine thermodynamic cycles under both design and off-design conditions [17]. The V94.3A and LM2500 engine models were developed in GasTurb using publicly available data for each respective engine. The two engine models were developed by selecting single- and twin-shaft configurations separately through the software interface and subsequently incorporating design specification data obtained from open-domain sources that are similar to the proposed engine models. Certain parameters, such as component efficiencies and turbine entry temperature, were adjusted to achieve the desired engine design specifications. Figs. 1 and 2 show the selected engine configurations for the V94.3A and LM2500 respectively, while Tables 1 and 2 present the design-point specifications of the respective engines. After developing the baseline models for both engines, the experimental values of reductions in compressor flow capacity and isentropic efficiency reported by Agbadede et al. [16], representing washing frequencies of every one day and every ten days, were applied in the simulations (see Table 3).
Fig. 1Single shaft industrial gas turbine [17]
![Single shaft industrial gas turbine [17]](https://static-01.extrica.com/articles/25711/25711-img1.jpg)
Fig. 2Twin shaft industrial gas turbine engine configuration [17]
![Twin shaft industrial gas turbine engine configuration [17]](https://static-01.extrica.com/articles/25711/25711-img2.jpg)
Table 1Design specifications for engine derived from V94.3A [18]
Design parameters | Units |
Power output | 266 MW |
Thermal efficiency | 38.6 |
PR | 16.9 |
Exhaust temperature | 858 K |
Exhaust flow | 658 kg/s |
Table 2Design specifications for engine derived from LM2500 (courtesy of general electric)
Design parameters | Units |
Power output | 25 MW |
Thermal efficiency | 36 |
PR | 18 |
Exhaust temperature | 839 K |
Exhaust flow | 70.5 kg/s |
Heat rate | 9705 kJ/kWh |
Table 3Variation/reduction in isentropic efficiency and non-dimensional mass flow rate [16]
Conditions | % Variation isentropic efficiency | % Variation non-dimensional mass flow rate |
Clean | 0.0 | 0.0 |
Fouled blades washed after one day | 2.2 | 1.3 |
Fouled blades washed after 10 days | 4.0 | 1.3 |
An economic analysis module was subsequently developed in Microsoft Excel. This module incorporated the simulated engine performance data (power output and heat rate) along with financial parameters such as the capital cost of washing equipment, costs of wash fluid and manpower, and electricity prices. The cost of power loss associated with each washing frequency schedule was also included. The model was then used to estimate the overall economic benefits of compressor washing while accounting for all cost implications.
3. Results and discussion
Fig. 3 illustrates the percentage drop in power output with varying washing frequency schedules. As shown in the figure, when the washing frequency was reduced from once after every one day to once after every ten days over a one-year period, the percentage drop in power output increases from approximately 7 % to 16 % for the LM2500 engine and from about 4 % to 6 % for the V94.3A engine. Comparing the two engines, it is evident that the aero-derivative LM2500 experiences a more significant decline in power output than the heavy-duty V94.3A under the same washing conditions. The greater percentage drop in power output associated with longer washing intervals can be attributed to increased compressor fouling, which reduces the air mass flow rate. This reduction in mass flow directly lowers the engine’s power output. Moreover, infrequent washing leads to a decrease in compressor isentropic efficiency, requiring the turbine to supply more power to drive the compressor and maintain the same pressure ratio. Consequently, the net power available at the output shaft is further diminished.
Fig. 4 presents the percentage drop in thermal efficiency against washing frequency schedules for the two engines. As shown in the figure, the percentage drop in thermal efficiency increases with longer washing intervals for both engines. When the washing frequency is reduced from once after every one day to once after every ten days, the thermal efficiency decreases from approximately 2.6 % to 6 % for the LM2500 engine and from about 1.67 % to 3 % for the V94.3A engine. The ten-day washing interval therefore results in a greater efficiency loss compared to washing after every one day for both engines. The longer washing interval leads to increased compressor fouling, which in turn reduces the compressor’s isentropic efficiency. This reduction means the compressor operates less efficiently and requires more work to achieve the same level of air compression. Consequently, the engine must consume more fuel to produce a given power output, leading to an overall decrease in thermal efficiency.
Fig. 3Percentage drop in power output against wash frequency schedules for two different engines
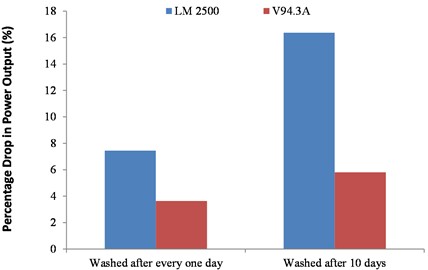
Fig. 4Percentage drop in thermal efficiency against wash frequency schedules for two different engines
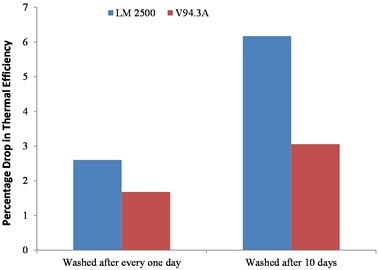
Fig. 5 illustrates that as the washing interval increases from once per day to once every ten days, the percentage increase in heat rate rises from approximately 2.7 % to 6.6 % for the LM2500 engine, and from about 1.7 % to 3.0 % for the V94.3A engine. The LM2500, being an aero-derivative engine, is generally more sensitive to compressor fouling than the heavy-duty V94.3A. This observation aligns with the trend shown in Fig. 2, since heat rate is inversely proportional to thermal efficiency meaning that a decrease in thermal efficiency results in an increase in heat rate.
The ten-day washing interval, therefore, exhibits a higher percentage increase in heat rate compared to washing once per day for both engines. Heat rate represents the amount of fuel energy required to produce a unit of electrical energy (kJ/kWh); thus, a less efficient engine must consume more fuel to generate the same power output. As washing intervals are extended, compressor fouling intensifies, causing the engine to operate less efficiently and burn additional fuel to maintain power output, thereby further increasing the heat rate.
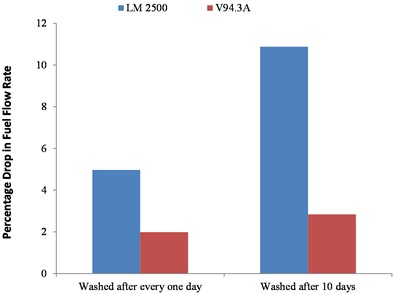
Fig. 6 shows the percentage drop in fuel flow rate with varying washing frequency schedules for the two engines. As shown in the figure, the percentage drop in fuel flow increases from approximately 4.9 % to 10.9 % for the LM2500 engine and from about 1.9 % to 2.8 % for the V94.3A engine as the washing interval is extended from once per day to once every ten days.
Under normal conditions, fuel flow is expected to increase with reduced washing frequency due to higher compressor fouling and associated efficiency losses. However, in this case, fuel flow decreases with longer washing intervals because the turbine operates under a controlled exhaust gas temperature (EGT) system, which limits fuel flow to maintain safe operating conditions.
Fig. 5Percentage increase in heat rate against wash frequency schedules for two different engines

Fig. 6Percentage drop in fuel flow rate against wash frequency schedules for two different engines
4. Estimating power loss
Assuming the gas turbine operated for 8000 hrs per year.
– Power loss LM2500:
Power loss for washing after every one day for one year, = 0.074 × 25 MW × 8000 = 14,800 MWh.
The cost of power per megawatt hour is valued at £0.2635 per kWh = £263.50 per MWh [19].
Cost of power loss = 14,800 MWh × £263.50 per MWh = £3,899,800.
Washing after every 10 days for one year:
Power loss = 0.164 × 25 MW × 8000 = 32,800 MWh.
Cost of power loss = 32,800 × £263.50 per MWh = £8,642,800.
Therefore, cost of Power loss saved for washing after every one day compared to washing after every 10 days= £8,642,800 – £3,899,800 = £4,743,000.
– Power loss for V94.3:
Power loss for washing after every one day for one year, = 0.0363 × 266 MW × 8000 = 77,246 MWh.
Therefore, cost of power loss = 77,246 MWh × £263.50 per MWh = £20,354,426.
Washing after every 10 days for one year:
Power loss = 0.0581 × 266 MW × 8000 = 123636 MWh.
Cost of power loss = 123636 × £263.50 per MWh = £32,578,296.
Therefore, the cost of power loss saved for washing after every one day, compared to washing after every 10days, is £32,578,296 – £20,354,426 = £12,223,870.
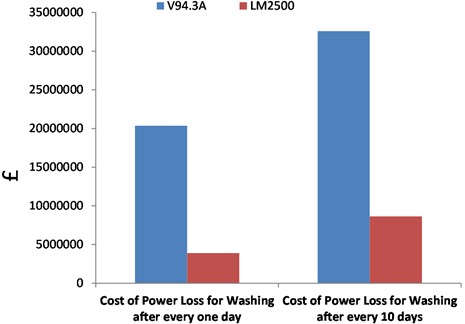
Fig. 7 shows the bar chart plot of the cost estimation of power loss for the two wash frequency Schedules, for two different engines.
Fig. 7Power loss estimation against wash frequency schedules for two different engines
5. Cost analysis of washing for V94.3A and LM 2500
The data representing the quantity of liquid required per wash for the V94.3A and LM2500 engines, as presented in Table 4, were adopted to conduct the cost analysis of washing for both engines. As shown in the table, the quantities of liquid required per wash are 300 litres for the V94.3A and 76 litres for the LM2500, respectively [20].
Table 4Quantity of liquid per wash for different engines [20]
Engine | Power (MW) | Airflow (kg/s) | Liquid per wash (l) |
TF40B | 13 | 80 | 11 [46] |
Avon | 14 | 75 | 265 [5] |
LM2500 | 25 | 68 | 76 [6] |
RB211-24G | 29.5 | 92 | 90-180 [53] |
GT 11 D5 | 66 | 200 (est.) | 172 [44] |
V94.3A | 260 | 620 | 300 [54] |
Tables 5 and 6 present the cost required for washing the V94.3A and LM2500 engines respectively.
The cost of a 25-litre container of R-MC Wash fluid was reported as £316.20 [21], corresponding to a unit cost of approximately £12.65 per litre.
Table 5Cost analysis of washing for V94.3A
Parameters | Washing after every one day | Washing after every 10 days |
Capital cost of washing equipment(annually) | £100,000 [Courtesy R-MC Power Recovery Ltd] | £100,000 [Courtesy R-MC Power Recovery Ltd] |
Cost of wash fluid + demineralised water per litre | £12.65 [21] | £12.65 [21] |
Cost of manpower | Negligible | Negligible |
Quantity of fluid for one wash | 300 litres | 300 litres |
Cost of wash fluid + demineralised water for one wash | £3,795 | £3,795 |
Cost of wash fluid + demineralised water for washing for one month | £56,925 | £11,385 |
Cost of wash fluid + demineralised water for washing for one year | £683,100 | £136,620 |
Total Cost of Washing for one year | £763,100 | £236,620 |
The difference in washing expenses between washing after every one day and washing every 10 days over the course of one year is calculated as £763,100 – £236,620 = £526,840.
Therefore, the net profit recorded by washing the V94.3A engine after every one day, compared to washing after every 10 days, is £12,223,870 – £526,840 = £11,697,030.
Table 6Cost analysis of washing for LM2500
Parameters | Washing after every one day | Washing after 10 days |
Capital cost of washing equipment(annually) | £100,000 [Courtesy R-MC Power Recovery Ltd] | £100,000 [Courtesy R-MC Power Recovery Ltd] |
Cost of wash fluid + demineralised water per litre | £12.65 [21] | £12.65 [21] |
Cost of manpower | Negligible | Negligible |
Quantity of fluid for one wash | 76 litres | 76 litres |
Cost of wash fluid + demineralised water for one wash | £961 | £961 |
Cost of wash fluid + demineralised water for washing for one month | £14,421 | £2883 |
Cost of wash fluid + demineralised water for washing for one year | £173,052 | £34,596 |
Total Cost of Washing for one year | £273,052 | £134,596 |
The difference in washing expenses between washing after every one day and washing every 10 days over the course of one year is calculated as £273,052 – £134,596 = £138,456.
Therefore, the net profit recorded by washing the LM2500 engine after every one day, compared to washing after every 10 days, is £4,743,000 – £138,456 = £4,604,544.
6. Conclusions
This study has demonstrated the significant influence of compressor washing frequency on both the thermodynamic performance and economic viability of industrial gas turbines. Using GasTurb simulations, two representative engines namely the LM2500 aero-derivative turbine and V94.3A from Siemens’ V-series were investigated to examine the effects of after every one day and ten days online washing schedules.
The results clearly indicate that extending the washing interval leads to increased compressor fouling, resulting in notable declines in power output and thermal efficiency, as well as a corresponding increase in heat rate. Specifically, the LM2500 exhibited greater sensitivity to fouling than the V94.3A, owing to its higher compressor pressure ratio and tighter design tolerances. This underscores the need for more frequent washing of aero-derivative engines to sustain optimal performance.
From an economic standpoint, frequent online washing proved highly beneficial. Although daily washing incurs higher operational costs due to greater fluid consumption and system usage, these expenses are outweighed by the substantial recovery in engine efficiency and output. The analysis revealed annual net profit gains of approximately £11.69 million for the V94.3A and £4.6 million for the LM2500 when washed daily compared with every ten days.
Overall, the findings emphasize that optimizing compressor washing frequency is critical for achieving cost-effective, energy-efficient, and reliable gas turbine operations. Implementing an appropriate washing schedule helps maintain near-design performance levels, reduces fuel consumption, minimizes power losses, and enhances overall profitability. Therefore, regular online washing should be integrated into turbine maintenance strategies as a proactive and economically justified approach to managing compressor fouling.
References
-
N. Aretakis, I. Roumeliotis, G. Doumouras, and K. Mathioudakis, “Compressor washing economic analysis and optimization for power generation,” Applied Energy, Vol. 95, pp. 77–86, Jul. 2012, https://doi.org/10.1016/j.apenergy.2012.02.016
-
J. M. Thames, J. W. Stegmaier, and J. J. Ford, “On-line compressor washing practices and benefits,” in International Gas Turbine and Aeroengine Congress and Exposition, Jun. 1989, https://doi.org/10.1115/89-gt-91
-
J. Chen, X. Tang, J. Lu, and H. Zhang, “A compressor off-line washing schedule optimization method with a LSTM deep learning model predicting the fouling trend,” Journal of Engineering for Gas Turbines and Power, Vol. 144, No. 8, Aug. 2022, https://doi.org/10.1115/1.4054748
-
J. Martín-Aragón and M. Valdés, “A method to determine the economic cost of fouling of gas turbine compressors,” Applied Thermal Engineering, Vol. 69, No. 1-2, pp. 261–266, Aug. 2014, https://doi.org/10.1016/j.applthermaleng.2013.11.051
-
H. Hanachi, J. Liu, P. Ding, I. Yong Kim, and C. K. Mechefske, “Predictive compressor wash optimization for economic operation of gas turbine,” Journal of Engineering for Gas Turbines and Power, Vol. 140, No. 12, Dec. 2018, https://doi.org/10.1115/1.4041168
-
G. Musa, U. Igie, P. Pilidis, and S. Gowon, “Economic viability of on-line compressor washing for different rated capacity,” in ASME Turbo Expo 2017: Turbomachinery Technical Conference and Exposition, Jun. 2017, https://doi.org/10.1115/gt2017-64950
-
E. A. Ogbonnaya, “Gas turbine performance optimization using compressor online water washing technique,” Engineering, Vol. 3, No. 5, pp. 500–507, Jan. 2011, https://doi.org/10.4236/eng.2011.35058
-
S. C. Gu¨Len, P. R. Griffin, and S. Paolucci, “Real-time on-line performance diagnostics of heavy-duty industrial gas turbines,” Journal of Engineering for Gas Turbines and Power, Vol. 124, No. 4, pp. 910–921, Oct. 2002, https://doi.org/10.1115/1.1413465
-
J.-P. Stalder, “Gas turbine compressor washing state of the art: field experiences1,” Journal of Engineering for Gas Turbines and Power, Vol. 123, No. 2, pp. 363–370, Apr. 2001, https://doi.org/10.1115/1.1361108
-
M. P. Boyce and F. Gonzalez, “A study of on-line and off-line turbine washing to optimize the operation of a gas turbine,” Journal of Engineering for Gas Turbines and Power, Vol. 129, No. 1, pp. 114–122, Jan. 2007, https://doi.org/10.1115/1.2181180
-
P. N. S. Rao and V. N. A. Naikan, “An optimal maintenance policy for compressor of a gas turbine power plant,” Journal of Engineering for Gas Turbines and Power, Vol. 130, No. 2, Mar. 2008, https://doi.org/10.1115/1.2795762
-
S. F. Spuntrup, G. D. Ave, L. Imsland, and I. Harjumkoski, “Optimal maintenance scheduling of washing of compressors to increase operation efficiency,” Journal of Computer Aided Chemical Engineering, Vol. 46, pp. 1321–1326, 2019.
-
D. P. Xenos, G. M. Kopanos, M. Cicciotti, and N. F. Thornhill, “Operational optimization of networks of compressors considering condition-based maintenance,” Computers and Chemical Engineering, Vol. 84, pp. 117–131, Jan. 2016, https://doi.org/10.1016/j.compchemeng.2015.08.008
-
G. Hovland and M. Antoine, “Scheduling of gas turbine compressor washing,” Intelligent Automation and Soft Computing, Vol. 12, No. 1, pp. 63–73, Jan. 2006, https://doi.org/10.1080/10798587.2006.10642916
-
E. Schneider, S. Demircioglu, S. Franco, and D. Therkorn, “Analysis of compressor on-line washing to optimize gas turbine power plant performance,” in ASME Turbo Expo 2009: Power for Land, Sea, and Air, pp. 591–599, Jan. 2009, https://doi.org/10.1115/gt2009-59356
-
R. Agbadede, B. Kainga, and I. Allison, “Industrial gas turbine compressor cleaning: the impact of washing frequency schedule on the effectiveness of online compressor washing,” Journal of The Institution of Engineers (India): Series C, Vol. 106, No. 5, pp. 1185–1195, Jul. 2025, https://doi.org/10.1007/s40032-025-01187-8
-
J. Kurzke, “GasTurb 11 – design and off-design performance of gas turbines. GasTurb User Manual,” 2007.
-
B. Becker and V. Thien, “High-efficiency gas turbines operating in intermediate duty,” in Proceedings of the International Gas Turbine Congress 2003 Tokyo (IGTC 2003), 2003.
-
“Average cost of electricity per kWh in the UK.” NimbleFins, 2026, https://www.nimblefins.co.uk/average-cost-electricity-kwh-uk
-
F. C. Mund and P. Pilidis, “Gas turbine compressor washing: historical developments, trends and main design parameters for online systems,” Journal of Engineering for Gas Turbines and Power, Vol. 128, No. 2, pp. 344–353, Apr. 2006, https://doi.org/10.1115/1.2132378
-
“R-MC G21 compressor wash fluid 25Lt drum.” Silmid, https://www.silmid.com/cleaners/specialty-cleaners/r-mc-g21-turbine-cleaner-25lt-drum/#:~:text=silmid%20p/n:%20rmcg21025l,)%20%c2%a3379.44%20(inc%20vat)
About this article

The authors have not disclosed any funding.
The authors are exceedingly grateful to Faculty of Engineering, Nigeria Maritime University, Okerenkoko, for providing all technical assistance.
The datasets generated during and/or analyzed during the current study are available from the corresponding author on reasonable request.
Roupa Agbadede: conceptualization, investigation data analysis, writing some parts of the original, and review and editing. Biweri Kainga: formal analysis, investigation, methodology, writing some sections of the original draft.
The authors declare that they have no conflict of interest.
