Abstract
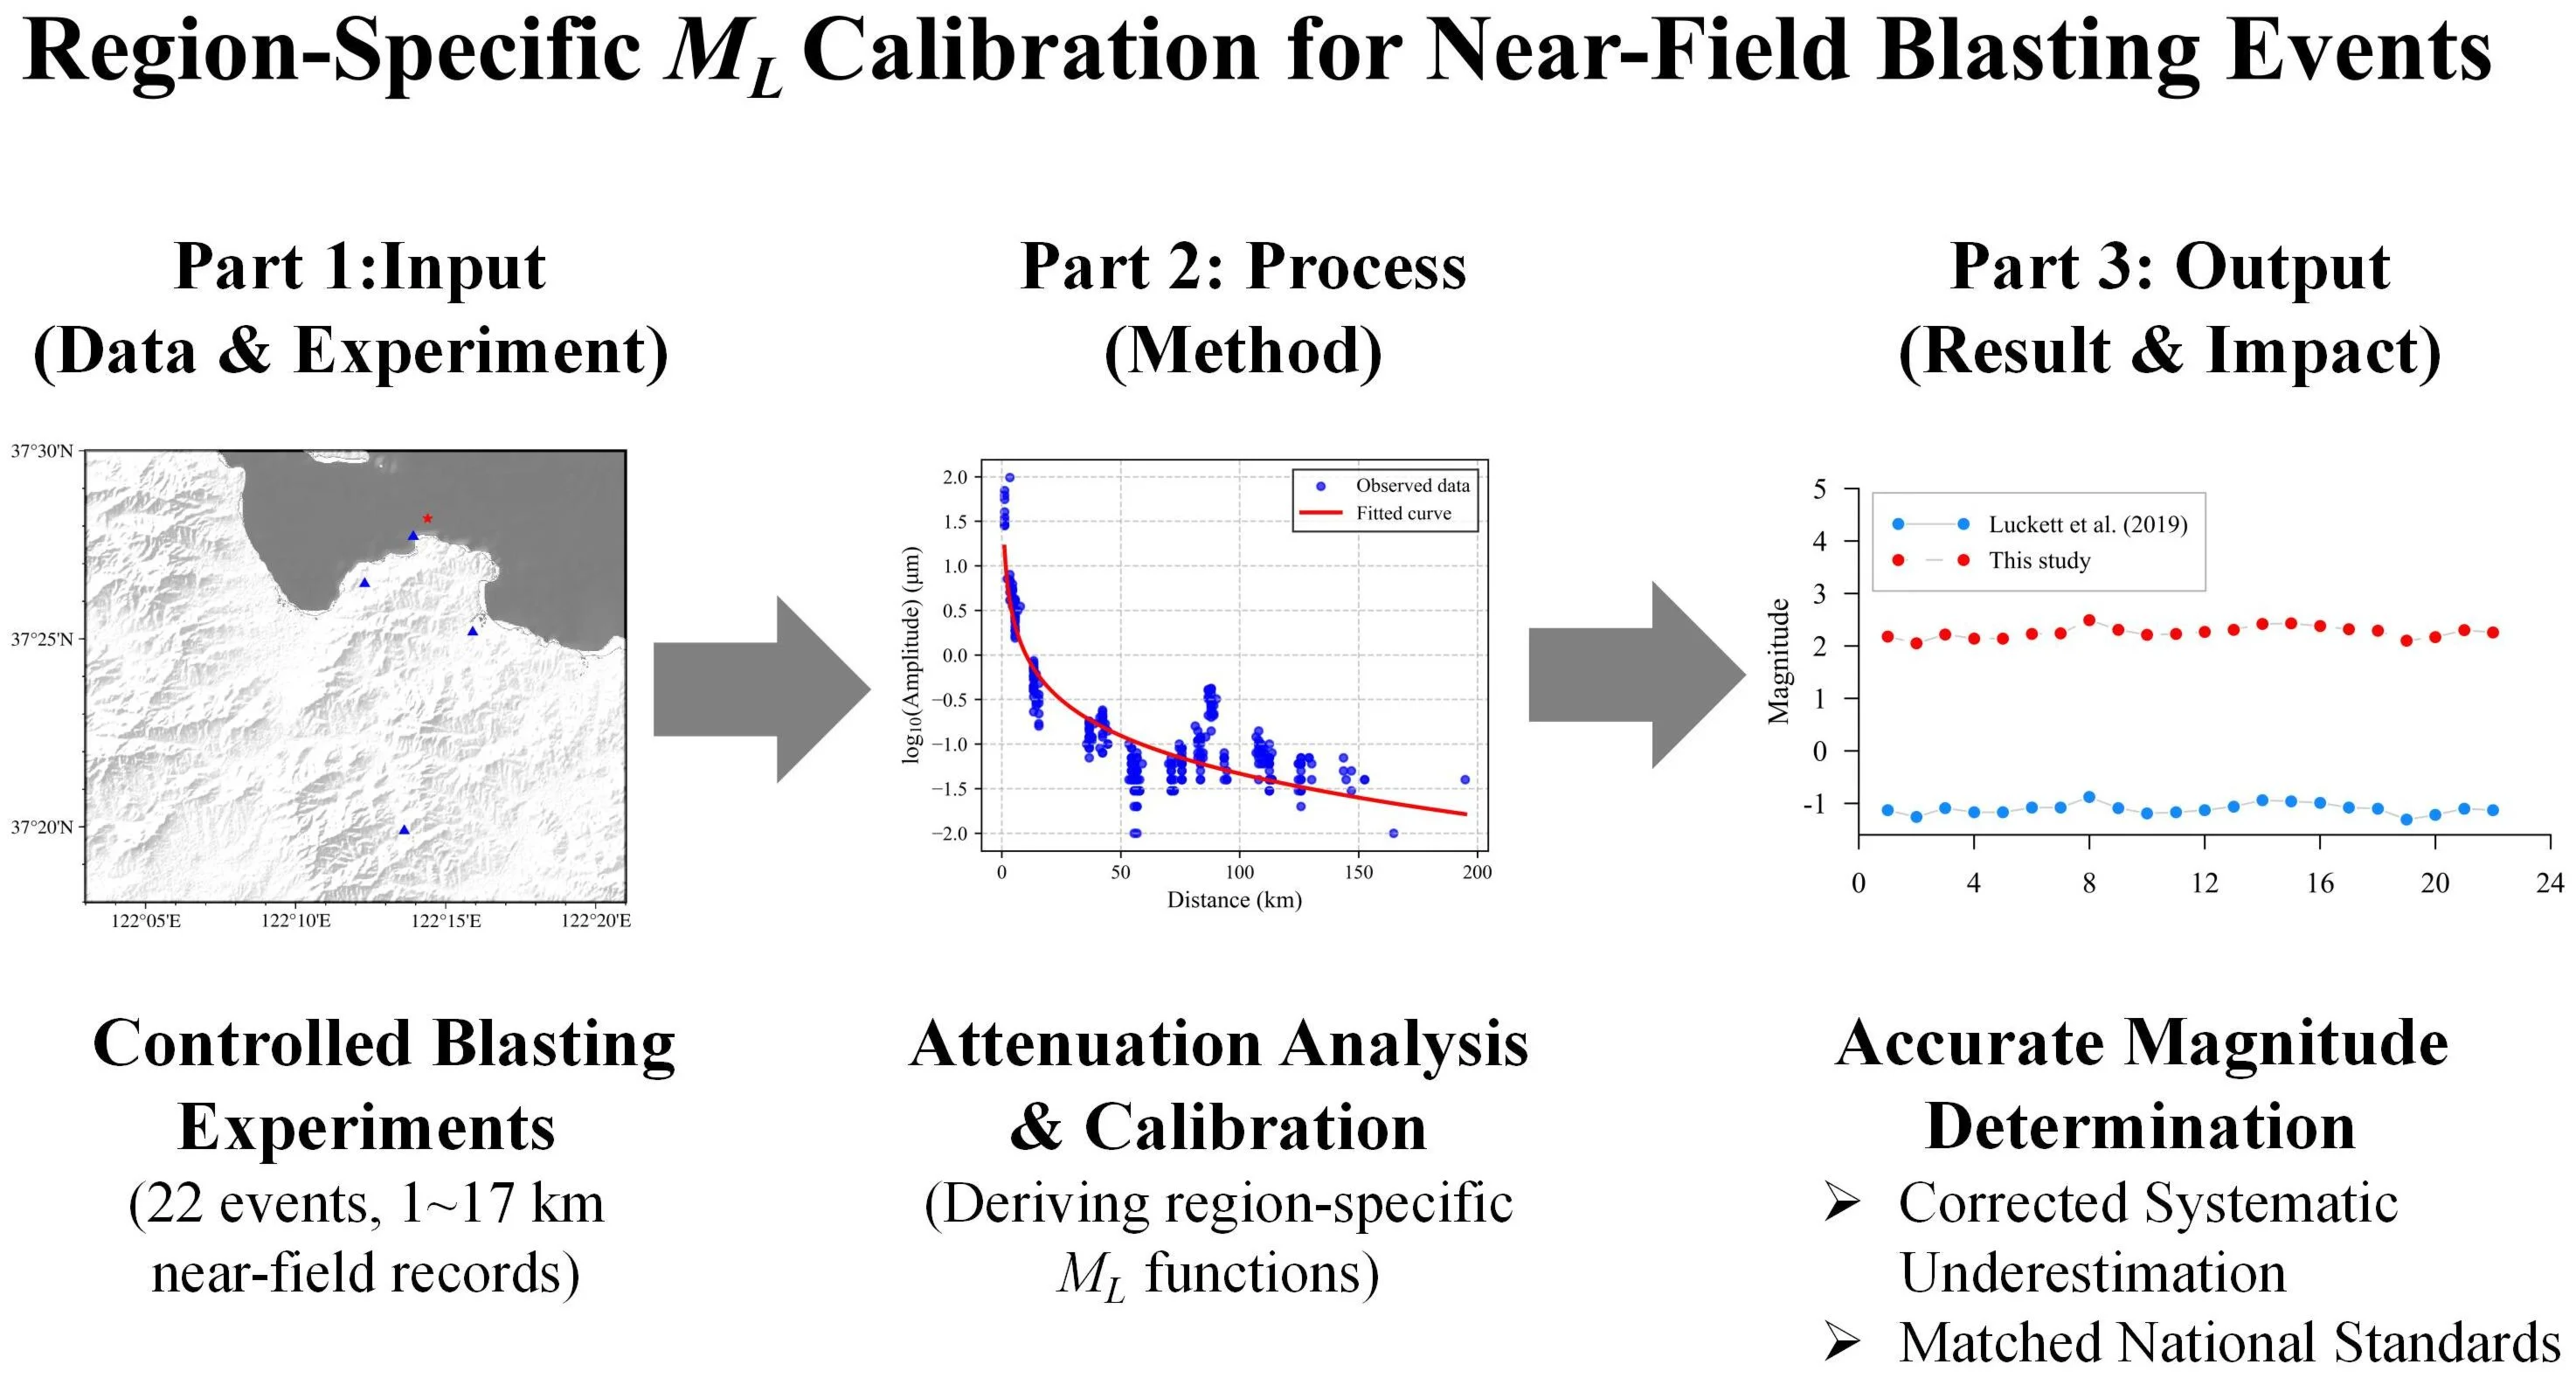
With the increasing depth and intensity of coal mining in China, non-natural seismic events occur more frequently, posing higher demands on mine safety and seismic monitoring. As a core parameter in earthquake monitoring and hazard assessment, precise determination of magnitude is essential for predicting and mitigating dynamic disasters. To address this, we conducted 22 controlled blasting experiments in the Weihai Port area of Shandong Province, using a combination of fixed and mobile seismic stations to systematically investigate the attenuation characteristics of near-field seismic waves and to establish a regional calibration function for local magnitude (ML). The calibration functions for both horizontal and vertical components were derived through least-squares fitting, from which the corresponding local magnitude determination formula was developed. Results from the 22 blasting events indicate good consistency of single-station magnitudes, with small deviations compared to the magnitudes determined by the Shandong Seismic Network, satisfying the required accuracy for magnitude estimation. Overall, this study establishes a calibration function applicable within 5 km of the Weihai blasting area, enhancing the consistency between magnitudes of blasting and natural earthquakes. The results provide a valuable reference for improving regional seismic monitoring systems and strengthening early warning capabilities for mine-related hazards.
Highlights
- Analyzed near-field seismic wave attenuation characteristics within 5 km using data from 22 controlled blasting experiments in Weihai.
- Established region-specific local magnitude calibration functions for both vertical and horizontal components to correct near-field estimations.
- Improved magnitude estimation accuracy for non-natural seismic events, providing a method fully compatible with Chinese national seismic standards.
1. Introduction
With the increasing depth and intensity of coal mining in China, the deep surrounding rock mass – shaped over millions of years of sedimentation and influenced by multiple factors such as tectonic movements, geothermal activity, magmatic intrusion, groundwater migration, and surface erosion – has created a more complex underground mining environment. While meeting the growing energy demands, coal mines are simultaneously confronted with severe challenges posed by dynamic disasters such as rock bursts [1]. These hazards pose serious threats to underground engineering structures and equipment and directly endanger the lives of mining personnel. Microseismic monitoring technology, grounded in seismological principles, detects seismic waves generated by microfracturing within coal and rock masses, enabling real-time, dynamic, and continuous evaluation of rock mass structure and stability. Owing to its wide monitoring coverage, rich information content, and high operational efficiency, this technology has become one of the core components of intelligent monitoring and early warning systems for dynamic mine disasters such as rock bursts [2]. Although intelligent monitoring technologies – such as sensor data fusion and strain sensing – have made significant progress in recent years, the precise determination of fundamental seismic parameters, particularly magnitude, remains the cornerstone for assessing mining-induced hazards [3-6].
As one of China’s major energy bases, Shandong Province faces significant challenges in monitoring non-natural seismic events induced by mining activities. According to data from the Shandong Seismic Network, a total of 3,475 natural earthquakes and 2,705 non-natural events were recorded between 2018 and April 2025, with the latter accounting for approximately 43.8 % of all detected events. Some of these non-natural events have been notably destructive: the M1.5 collapse event at Longyun Coal Mine in Heze in October 2018 resulted in 21 fatalities, while another M1.9 collapse in the same area in February 2020 caused four deaths [7, 8]. Against this background, Shandong Province has in recent years established – and continues to expand –dedicated mine-seismic monitoring networks covering major mining areas, with the goal of achieving high-resolution monitoring of near-field microseismic events. By analyzing the temporal and spatial evolution of such near-field seismic activity, potential mining-induced hazards can be effectively assessed.
Magnitude is a key parameter in microseismic monitoring systems; within similar tectonic settings, larger magnitudes generally correspond to more severe damage. Since Richter first introduced the concept of local magnitude (ML) in southern California in 1935, it has been widely adopted across many countries and regions [9]. Because attenuation characteristics vary under different geological conditions, researchers have revised the calibration function to accommodate regional differences [10-13]. In 1959, Li Shanbang introduced the original magnitude scale to China and later, in 1981, summarized calibration functions suitable for the then commonly used Type-62 (short-period) and SK-type (medium- to long-period) seismographs [14]. These calibration functions describe how seismic wave amplitudes decay with epicentral distance and are closely related to crustal structure [15]. It should be noted, however, that this function does not account for the effect of focal depth, primarily because most earthquakes in China are shallow intraplate events, for which the source depth is usually negligible compared to the epicentral distance.
Subsequently, Wang Liyan (2016) systematically analyzed data from 1,308 earthquakes recorded by 31 provincial seismic stations across China between 1973 and 2002, and recalculated the national calibration function for magnitude determination [16]. Building upon this work, Liu Ruifeng et al. (2017) formulated the national standard Specifications for Earthquake Magnitude (GB 17740-2017), providing a scientific basis for the accurate and unified determination of earthquake magnitudes in China [17]. However, this standard was initially designed for regional-scale permanent seismic networks, with a calibration function defined at a minimum epicentral distance interval of 5 km. When applied to dense seismic arrays with source–station distances of only a few hundred meters to 30 km, it fails to effectively capture near-field attenuation characteristics, leading to a significant decrease in magnitude estimation accuracy [18]. Luckett et al. (2019), using earthquake data from Central Italy and Norway, proposed a revised local magnitude calibration function that successfully corrected the systematic overestimation of magnitudes at short epicentral distances[19]. This revised formulation has since been adopted by the British Geological Survey. It is important to note, however, that mining-induced seismicity has distinct source mechanisms, wave propagation paths, and station distribution characteristics, with focal distances often less than 3 km. Direct application of large-scale calibration functions therefore introduces significant errors. Targeted optimization and localization of magnitude determination methods are thus urgently needed for mining areas. Zhang (2025), based on controlled blasting experiments conducted in the Dongtan Coal Mine, proposed separate local magnitude calibration functions for surface and underground stations, providing valuable support for the accurate estimation of near-field blasting magnitudes [20]. However, the revised calibration function in that study primarily followed the formulation proposed by Luckett (2019), resulting in generally smaller magnitude estimates that remain poorly aligned with China’s current national standard. To address this issue, this study utilizes controlled blasting data from the Weihai region of Shandong Province to systematically analyze the attenuation characteristics of near-field seismic waves and establish a regional near-field attenuation model and local magnitude (ML) calibration function. Using near-field data within 5 km, a magnitude determination method suitable for specialized local seismic arrays is proposed. The results aim to provide a more reliable technical approach for monitoring and calibrating non-natural seismic events in mining areas, while offering scientific support for improving regional seismic monitoring networks and enhancing early warning capabilities for dynamic mine disasters.
2. Data
The data used in this study were obtained from underwater trench blasting operations conducted in Weihai (122.23°E, 37.46°N). The project was carried out between 13 September and 16 October 2024, comprising a total of 22 blasting events with explosive charges ranging from 800 kg to 2000 kg. Detailed information on the blasting parameters is provided in Table 1. To acquire seismic waveform data and investigate the near-field attenuation characteristics of the blasts, four temporary seismic stations were deployed in addition to the regional permanent network. These mobile stations were installed on one side of the blasting site at epicentral distances of 1, 3, 5, and 14 km, respectively (Fig. 1). The joint observation of fixed and mobile stations provides a reliable dataset for subsequent calibration function fitting and for developing a localized method for determining the local magnitude (ML).
Table 1Blasting event information
No. | Origin time | Location | Explosive charge (kg) | Horizontal magnitude | Vertical magnitude | Magnitude |
1 | 2024-09-13 13:49:21.7 | N37.50, E122.25 | 800 | 2.18 | 2.17 | 2 |
2 | 2024-09-14 12:04:46.3 | N37.50, E122.29 | 800 | 2.05 | 2.13 | 1.9 |
3 | 2024-09-15 12:07:49.4 | N37.48, E122.24 | 900 | 2.22 | 2.21 | 2 |
4 | 2024-09-16 10:50:14.6 | N37.47, E122.23 | 900 | 2.14 | 2.13 | 2.1 |
5 | 2024-09-18 11:30:12.3 | N37.47, E122.23 | 900 | 2.14 | 2.16 | 1.9 |
6 | 2024-09-19 11:28:12.3 | N37.48, E122.24 | 800 | 2.23 | 2.23 | 2 |
7 | 2024-09-20 11:59:21.9 | N37.48, E122.24 | 900 | 2.24 | 2.20 | 2.2 |
8 | 2024-09-24 16:29:22.5 | N37.46, E122.24 | 1500 | 2.49 | 2.49 | 2.2 |
9 | 2024-09-25 13:29:20.5 | N37.47, E122.24 | 1900 | 2.31 | 2.36 | 2.2 |
10 | 2024-09-26 11:08:56.7 | N37.48, E122.24 | 900 | 2.21 | 2.20 | 2.1 |
11 | 2024-09-27 14:10:39.5 | N37.47, E122.26 | 1900 | 2.23 | 2.20 | 2.1 |
12 | 2024-10-03 14:20:16.3 | N37.48, E122.25 | 1800 | 2.27 | 2.20 | 2.1 |
13 | 2024-10-04 16:00:38.5 | N37.47, E122.24 | 1900 | 2.31 | 2.36 | 2.2 |
14 | 2024-10-05 14:00:28.9 | N37.47, E122.27 | 2000 | 2.42 | 2.43 | 2.2 |
15 | 2024-10-06 14:10:15.9 | N37.47, E122.24 | 1900 | 2.43 | 2.46 | 2.2 |
16 | 2024-10-09 12:00:26.7 | N37.48, E122.25 | 1900 | 2.38 | 2.36 | 2.2 |
17 | 2024-10-10 13:00:19.1 | N37.46, E122.24 | 1900 | 2.32 | 2.31 | 2.1 |
18 | 202410-11 13:59:58.5 | N37.46, E122.23 | 2000 | 2.29 | 2.27 | 2.1 |
19 | 2024-10-12 10:00:21.5 | N37.46, E122.24 | 1900 | 2.10 | 2.04 | 1.9 |
20 | 2024-10-12 14:00:08.0 | N37.46, E122.24 | 1900 | 2.17 | 2.11 | 1.9 |
21 | 202410-13 11:10:17.5 | N37.49, E122.26 | 1500 | 2.30 | 2.23 | 2 |
22 | 2024-10-16 17:26:20.7 | N37.47, E122.24 | 1600 | 2.26 | 2.21 | 2.2 |
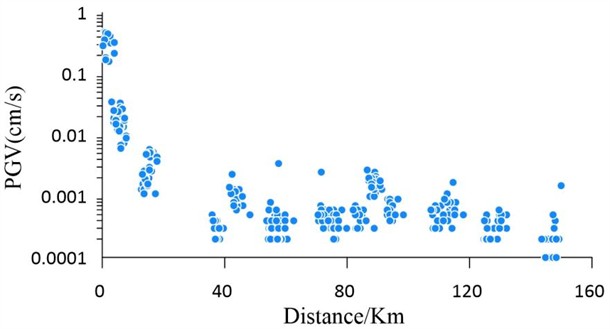
Based on observational data from 22 controlled blasting experiments conducted in the Weihai Port area of Shandong Province, the attenuation characteristics of peak horizontal velocity with respect to epicentral distance were analyzed in detail. All stations were deployed on the surface, with epicentral distances of 1, 3, 5, 14, and 17 km. After applying appropriate filtering, the average of the peak particle velocities from the three components was calculated, and the attenuation relationship between peak velocity and epicentral distance was plotted. The results indicate that the peak velocity decreases significantly with increasing distance, exhibiting rapid attenuation within 5 km of the source, followed by a markedly slower decay beyond this range. This pattern demonstrates that blasting waves experience strong near-field attenuation, consistent with the general power-law decay behavior of seismic ground motion with distance.
Fig. 1Distribution of seismic stations
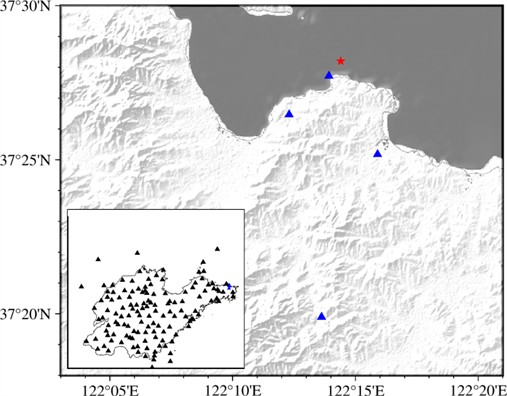
Fig. 2Attenuation of peak velocity with epicentral distance
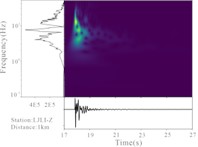
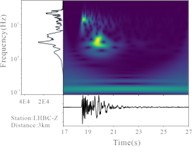
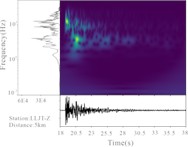
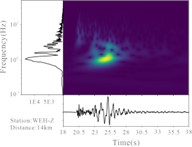
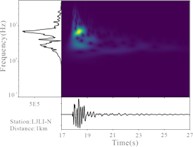
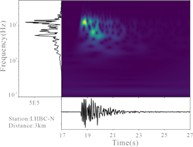
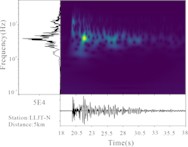
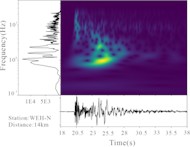
The attenuation characteristics described above provide essential empirical and physical foundations for fitting the attenuation function and constructing a magnitude-amplitude scaling relationship. During the propagation of blasting signals from the source to the observation stations, multiple factors jointly influence the recorded waveforms, including source parameters (such as magnitude and rupture mechanism) and the spatial distribution between the source and stations. In addition, the medium properties along the propagation path and the local sensor installation environment can significantly alter the observed waveform characteristics. Therefore, a systematic analysis of waveforms at different epicentral distances not only reveals how source characteristics and propagation paths influence the signal but also provides the necessary observational basis for subsequent attenuation-function fitting and the establishment of the magnitude–amplitude scaling relationship (Fig. 3).
In the time domain, the source–station distance exerts a clear influence on waveform morphology. Near-field records (approximately 1 km) are dominated by P-waves, exhibiting distinct, high-amplitude pulse signals. This is primarily because near-field seismic waves approach nearly vertically, concentrating energy and producing prominent P-wave pulses. As the epicentral distance increases to about 3 km, the P-wave energy decreases noticeably, and short-period surface-wave components gradually emerge and become partially dominant. Although the main pulse amplitude is reduced compared with the near-field, the P-wave arrival remains clearly identifiable. At 5 km, P-waves decay further, short-period surface waves dominate, and the waveform energy distribution becomes more continuous and longer in duration, with comparable energy between P- and surface-wave components. At the far-field distance of 14 km, P-waves weaken further, and the waveform is mainly composed of low-frequency surface waves. The energy concentrates in the later-arriving surface-wave portion, reflecting the effects of attenuation, scattering, and geometrical spreading during propagation. These temporal characteristics are consistent with previous findings, which indicate that near-field records are dominated by high-amplitude P-wave pulses, whereas surface waves become increasingly significant in the far field [21].
In the frequency domain, the near-field (1 km) records exhibit a broad spectral energy range (approximately 1-30 Hz), with a distinct peak near 8 Hz. This indicates that although the signal pulse is short, its spectral bandwidth is relatively wide, and the dominant frequency lies within the mid-to-low frequency range. As the distance increases to 3 km, the high-frequency (10-30 Hz) components of the P-wave attenuate significantly, and the energy becomes concentrated mainly within the low-frequency range (1-10 Hz), with a spectral peak around 2 Hz corresponding to the dominant frequency of the emerging surface waves. At 5 km, the spectrum exhibits a bimodal structure: one peak at 10-15 Hz (P-wave) and another around 8 Hz (surface wave), indicating comparable energy contributions from both components. Overall, the energy remains concentrated in the low-frequency range. At the far-field distance of 14 km, the spectrum shifts further toward low frequencies, with the primary energy concentrated between 1-6 Hz and a dominant peak around 1 Hz. High-frequency components nearly vanish, and low-frequency surface waves dominate the waveform. With increasing source-station distance, the spectral content progressively shifts toward lower frequencies. During propagation, high-frequency components above several tens of hertz attenuate rapidly due to crustal absorption and scattering and are evident only in near-field observations, while far-field records are dominated by low-frequency surface waves. This phenomenon is consistent with the filtering effect of low-velocity near-surface sedimentary layers, which significantly reduce the dominant frequency of far-field recordings compared to near-field ones.
It should be noted that the above analysis is based primarily on the composite amplitudes of three-component records, reflecting the overall evolution of wavefield energy with epicentral distance. However, the energy distribution across components is not uniform: differences in the projection of blasting energy onto vertical and horizontal components may significantly affect the construction of the magnitude calibration function. Previous studies have shown that artificial explosions can be approximated as isotropic volumetric sources, generating an elastic wavefield dominated by radially symmetric compressional (P) waves that radiate nearly uniformly in all directions [22, 23]. The P-wave energy primarily projects onto the vertical component, resulting in stronger first-arrival pulses and higher-frequency content, whereas the horizontal components mainly record shear or secondary surface-wave components and contain less of the radial motion energy from the source. Consequently, applying traditional local magnitude (ML) formulas based solely on horizontal-component amplitudes to blasting events may lead to systematic underestimation [24].
Based on these observations, and after clarifying the overall time–frequency attenuation characteristics, this study further compares the time-frequency evolution of horizontal and vertical components at different epicentral distances. The results show that in the near-field (< 3 km), the peak amplitudes of the two components are generally comparable, but their energy time-frequency structures differ significantly: in the vertical component, distinct short-period surface-wave (high-frequency wave) energy envelopes appear as early as 3 km, whereas in the horizontal component, surface-wave features are not yet prominent, and the waveform remains dominated by P-waves. This indicates that short-period surface waves generated by blasting are more efficiently radiated and excited in the vertical direction, and their energy separates earlier from the P-wave envelope. As the epicentral distance increases to 14 km, the waveform characteristics change systematically – the P-wave amplitude in the vertical component decreases relative to the horizontal component, whose peak amplitude becomes dominant. Overall, the vertical component is more sensitive to P-wave and high-frequency short-period surface-wave radiation in the near field, while the horizontal component more effectively represents the sustained propagation of surface-wave energy in the far field. Previous studies have also shown that using vertical-component amplitudes for ML determination can yield comparable results [22, 23]. Therefore, to comprehensively analyze blasting events, calibration functions for vertical and horizontal components should be established separately.
Fig. 3Time-frequency characteristics of the waveforms. The lower-left corner of each subplot indicates the station name and the corresponding epicentral distance. Each station panel includes a velocity time series (bottom section), a time–frequency spectrogram (left section), and a frequency spectrum. The color scale in the spectrogram represents the waveform velocity amplitudes
3. Methods
3.1. Parameter fitting inversion method
The concept of local magnitude was first introduced by Richter (1935) to meet the seismic monitoring needs of Southern California, and since then, almost all subsequent magnitude scales have been developed based on this definition [9]. In 1959, Li (1981) introduced Richter’s original local magnitude formula to China, which is expressed as follows [14]:
where is the calibration function, is the epicentral distance (in km), and is the arithmetic mean of the maximum S-wave amplitudes of the two horizontal components (in μm). The amplitude can be calculated using the following formula:
According to the national standard GB 17740-2017, the local magnitude of an earthquake event is obtained by taking the arithmetic mean of the magnitudes calculated from individual seismic station records. A calibration function value of 1.9 is uniformly adopted for stations within 5 km of the epicenter. However, for stations at near-epicentral distances, seismic amplitudes attenuate rapidly. If the calibration function is not sufficiently accurate, the magnitudes measured by different stations for the same event may diverge, leading to distorted event magnitude estimates [25]. Therefore, when the epicentral distances of stations within a seismic network vary substantially, it is essential to establish a precise local magnitude calibration function.
The current calibration function does not account for the effect of focal depth. However, for blasting events with source depths within 5 km, which are on the same order of magnitude as the epicentral distances, it is essential to incorporate a depth correction when determining magnitudes. Specifically, the hypocentral distance should be used, defined as:
as a substitute for the purely horizontal distance. The original definition of local magnitude is given by Havskov and Ottemöller [26]:
where is the displacement amplitude measured by the seismometer, and is the displacement correction term, i.e., the calibration function. The amplitude of the S-wave can be expressed as a function of the source distance:
where, is the original amplitude at the source, is the geometric spreading coefficient, denotes frequency, represents the S-wave velocity, and is the quality factor. Directly determining the values of these parameters can be challenging; therefore, empirical estimates are often used. Taking the logarithm of both sides of the above equation yields:
where, the distance-dependent amplitude attenuation term is defined as:
By substituting Eq. (7) into Eq. (4) and assuming and are constants, the local magnitude can be expressed as:
where, the terms represent geometric spreading, anelastic attenuation, and the baseline constant, respectively. It should be noted that the values of these parameters depend on the specific study area and must be adjusted accordingly for different regions.
3.2. Fitting with observed data
In the process of magnitude calculation, the frequency response characteristics of different types of seismometers vary significantly. Direct amplitude measurement from raw recordings would introduce systematic bias, leading to unreliable magnitude estimates. According to the Technical Specifications for Seismic Network Data Processing issued by the China Earthquake Administration (2011) and the relevant national standards, near-field magnitude calculations typically employ simulation of the DD-1 instrument. However, the nominal operating frequency band of the DD-1 is 0.1-5 Hz, while the source spectra of mining tremors and blasting events are usually concentrated in the higher frequency range of 1-50 Hz. If DD-1 simulation is directly applied, the high-frequency energy of the blasting source would be severely attenuated in the simulated records, resulting in underestimated magnitudes.
In contrast, the Wood-Anderson (WA) short-period seismograph maintains an approximately constant sensitivity above 1 Hz, effectively functioning as a high-pass filter that better captures the high-frequency components characteristic of mining and blasting events. Therefore, in this study, after removing the original short-period instrument response, all waveform data were uniformly processed through Wood-Anderson instrument simulation. The simulation was implemented using the standard Wood-Anderson response function provided in the ObsPy library, with parameters consistent with the IASPEI recommendations. This ensures the comparability and consistency of amplitude measurements and ML calibration. In this way, differences between instruments are eliminated, and the amplitude measurements and magnitude calculations for blasting events are unified on a common reference basis, ensuring the accuracy and comparability of magnitude analysis.
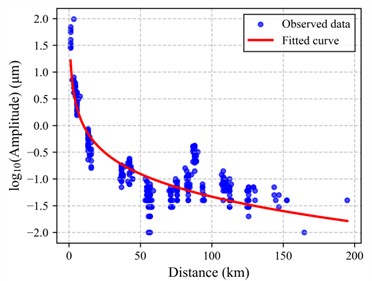
By analyzing waveforms recorded by each station for multiple blasting events and measuring the maximum displacement amplitudes, we established a relationship between the measured amplitudes and the corresponding source-station distances. Using a seismic-wave attenuation inversion approach, key parameters were estimated through constrained non-linear least-squares fitting, thereby determining the coefficients and in the calibration function. The constant term m₃ can, in principle, be determined based on the regional magnitude formula. In near-field observation environments, it is necessary to adjust this constant term to avoid systematic overestimation of magnitude. Unlike the correction formula proposed by Luckett (2019), which adopted a reference magnitude value of 1.27 at 5 km, this study follows the magnitude determination method defined in the Chinese national standard and uses a calibration reference value of 1.9 at 5 km for surface stations. This value accounts for the unified standard and magnitude calculation system of the Chinese seismic network, ensuring that the results are comparable and consistent within national operational frameworks. Based on the fitted geometric spreading coefficient () and the anelastic attenuation coefficient (m2) for surface stations, the constant term m3 was then calculated by substituting the measured amplitudes and the reference value of 1.9 at 5 km into the calibration function.
4. Results and discussion
4.1. Calibration functions
By fitting the observed waveform data from the blasting events, this study obtained the calibration function parameters , , , for both the vertical and horizontal components of stations in the Weihai area (see Table 2).
Table 2Calibration function parameters for vertical and horizontal components on surface stations
Category | |||
Vertical component | 1.3442 | 0.000961 | 0.8556 |
Horizontal component | 1.2552 | 0.001006 | 1.0176 |
By fitting the horizontal and vertical components of the waveforms recorded by surface stations in the Weihai region, attenuation relationships for both components were obtained, as shown in Fig. 4: Fig. 4(a) presents the fitting curve for the horizontal component, Fig. 4(b) for the vertical component, and Fig. 4(c) shows the corresponding calibration functions. The results indicate that the fitted parameters for the two components differ to some extent. The coefficient m₁ represents the logarithmic decay rate of seismic-wave amplitude with increasing source-station distance. The m₁ value of the vertical component is significantly larger than that of the horizontal component, suggesting a faster decay rate of amplitude with distance in the vertical direction on a logarithmic scale.
The coefficient reflects the influence of path effects – such as scattering and absorption – on amplitude attenuation. The values for both the horizontal and vertical components are relatively small, which may be related to the complex geological conditions in the Weihai area, where high scattering and absorption in the subsurface medium cause rapid amplitude attenuation with increasing distance. Overall, the differences in parameters between the horizontal and vertical components not only reflect the directional characteristics of the blasting source but also reveal the influence of propagation-path and site effects on amplitude behavior across different components. This finding further indicates that, for regional magnitude calibration, component-dependent calibration functions should be established separately to avoid systematic biases associated with using a single component.
Fig. 4Fitted attenuation curves for a) horizontal component, b) vertical component, and c) the corresponding calibration function curves
a)
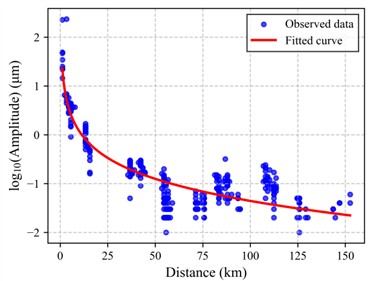
b)
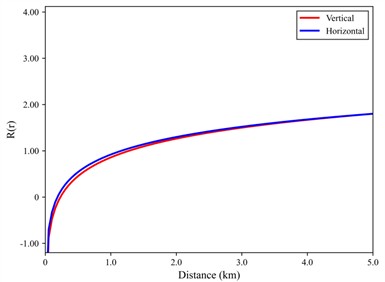
c)
4.2. Magnitude calculation
Using the fitted calibration functions for the vertical and horizontal components, the magnitudes of 22 blasting events were calculated. The calculated results are listed in Table 1. To verify the accuracy of the constructed calibration functions, the computed event magnitudes were compared with those determined by the Shandong Seismic Network, as shown in Fig. 5. The results indicate a high degree of consistency between the magnitudes derived from the vertical and horizontal components, with no significant systematic deviation observed. Both components exhibit very small discrepancies, with an overall deviation of approximately 0.2 and a maximum deviation of 0.3. According to the IASPEI magnitude standards [27, 28], these results meet the International Association of Seismology and Physics of the Earth’s Interior (IASPEI) requirements for magnitude determination, confirming the reliability of the fitted calibration functions.
Further analysis suggests that the maximum deviation is primarily due to limited data and fitting constraints. Because of the current spatial distribution of seismic stations, the Weihai region lacks sufficient near-field observations, making it difficult to establish a more comprehensive regional calibration function applicable over a broader distance range. The limited number of near-field data points used in this study may have affected the local stability of the fitting results.
Fig. 5Deviation of vertical and horizontal components from Shandong network magnitude
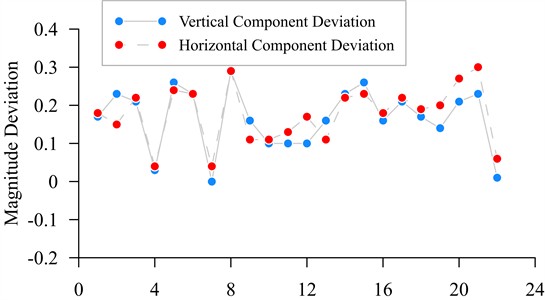
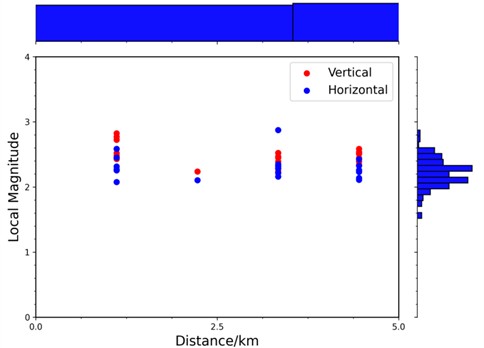
Fig. 6 presents the single-station magnitude results for different epicentral distances. It can be observed that, for both the vertical and horizontal components, no significant systematic deviation appears across stations at varying source-station distances. This indicates that the newly developed calibration function effectively corrects for distance-dependent effects, ensuring consistency in the magnitude estimates obtained from stations at different epicentral distances.
Fig. 6Distribution characteristics of single-station magnitudes
Empirical studies have shown that, when determining local magnitudes in different tectonic regions, vertical-component records often exhibit higher internal consistency than horizontal components. This finding is consistent with the IASPEI magnitude standard, which recommends the preferential use of vertical components in regions where crustal attenuation characteristics differ from those of southern California [27]. The results of this study also align with the conclusions of Butcher confirming that observed magnitudes within 5 km of the source tend to be systematically overestimated, and demonstrating that this issue can be effectively corrected through the fitting of a new calibration function [29]. In contrast, although the correction formula proposed by Zhang also mitigates the problem of excessive near-field amplitudes, it is not fully compatible with China’s current national standard [20]. The calibration-function approach proposed in this study, being directly aligned with the national standard, therefore possesses greater practical applicability and operational value.
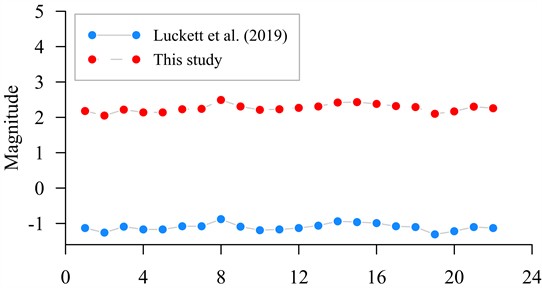
To validate the proposed model, we compared it with the widely used Luckett et al. [19] model [19]. As illustrated in Fig. 7, the calibration function derived from the Luckett et al. model significantly diverges from the results obtained in this study. Specifically, the magnitude comparison for the 22 blasting events reveals that the direct application of the Luckett model leads to a systematic underestimation of the local magnitude, as shown in Fig. 8. This discrepancy indicates that the generalized near-field model is not directly applicable to the Weihai region due to unique local geological conditions, thereby underscoring the critical necessity of developing a region-specific calibration function.
Fig. 7Comparison of near-field attenuation curves. The red line represents the calibration function calculated using the model proposed by Luckett et al., while the blue line represents the local calibration function derived in this study
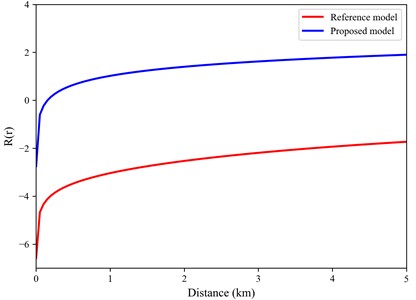
Fig. 8Comparison of local magnitudes determined by the proposed method and the Luckett et al. model for the 22 controlled blasting events. The red solid line represents the results calculated using the calibration function derived in this study, while the blue dashed line represents the results from the Luckett et al. model
4.3. Limitations and future work
Although this study successfully established a local magnitude calibration function for the near-field range (0-5 km) in the Weihai area, several limitations should be noted.
First, the data used in this study were exclusively recorded by surface stations. As indicated by previous studies [20], seismic wave propagation in underground mine roadways differs from that on the surface due to complex geological structures and cavity effects. Therefore, the applicability of the derived surface calibration function to underground microseismic monitoring systems requires further validation.
Second, the charge range in our controlled blasting experiments was relatively limited. While it covers the magnitude range of typical mining blasts, extrapolation to larger tectonic earthquakes or micro-fractures with significantly different frequency contents needs caution.
Future work will focus on deploying a joint surface-underground monitoring array to analyze the transfer function between surface and underground recordings, thereby extending the calibration model to a comprehensive 3D mining environment.
5. Conclusions
Based on observational data from 22 controlled blasting experiments conducted in the Weihai Port area of Shandong Province, this study systematically investigated the attenuation characteristics of near-field seismic waves and established a regional calibration function for local magnitude (ML). The main conclusions are as follows:
1) Time- and frequency-domain analyses of the waveforms reveal that amplitudes attenuate rapidly in the near field, with strong high-amplitude P-wave pulses dominating at approximately 1 km. As the source-station distance increases, P-waves gradually weaken, surface-wave components become more prominent and dominate in the far field, and the spectral energy shifts toward lower frequencies, with high-frequency components preserved primarily in the near field.
2) Using the least-squares fitting method, calibration functions for both horizontal and vertical components were established for surface stations in the Weihai region. The differences in the fitted parameters reflect variations in attenuation characteristics under different propagation conditions.
3) Based on the fitted calibration functions, the magnitudes of 22 blasting events were calculated. Comparison with the magnitudes determined by the Shandong Seismic Network shows minimal deviation, meeting the precision requirements of international magnitude determination standards and demonstrating the high reliability of the proposed model.
4) Compared with the national standard Specifications for Earthquake Magnitude (GB 17740-2017), this study developed a regional calibration function applicable within 5 km for near-field seismic arrays, addressing the limitation of using a constant value for short distances in the current standard and extending its applicability to near-field conditions.
The near-field attenuation model and magnitude determination method proposed in this study are not only applicable to blasting and mining-induced seismic events in the Weihai region but also provide a transferable technical framework for near-field magnitude calibration in other mining areas. The results contribute to improving the accuracy of magnitude estimation for non-natural seismic events, promoting consistency between mining-seismic and natural-earthquake magnitude determination methods, and providing a scientific basis for mine-disaster early warning and risk assessment.
References
-
L. M. Dou et al., “Classification, identification and monitoring methods of dynamic and static load hazards of coal mine rockburst sources,” (in Chinese), Coal Science and Technology, pp. 1–11, 2025.
-
A. Y. Cao et al., “Accurate picking and automatic location strategy of microseismic arrivals based on deep transfer learning,” (in Chinese), Journal of China Coal Society, Vol. 48, No. 12, pp. 4393–4405, Dec. 2023, https://doi.org/10.13225/j.cnki.jccs.2023.0095
-
G. E. M. Abro, Z. A. Ali, and S. Rajput, “Innovations in 3D object detection: A comprehensive review of methods, sensor fusion, and future directions,” ICCK Transactions on Sensing, Communication, and Control, Vol. 1, No. 1, pp. 3–29, Oct. 2024, https://doi.org/10.62762/tscc.2024.989358
-
M. Bibi et al., “Strain sensing technologies: recent developments in materials, performance, and applications,” ICCK Transactions on Sensing, Communication, and Control, Vol. 2, No. 3, pp. 168–199, Jul. 2025, https://doi.org/10.62762/tscc.2025.665257
-
X. Jin et al., “YOLOv7-bw: A dense small object efficient detector based on remote sensing image,” ICCK Transactions on Intelligent Systematics, Vol. 1, No. 1, pp. 30–39, May 2024, https://doi.org/10.62762/tis.2024.137321
-
H. Ren, Y. Wang, and H. Ma, “Deep prediction network based on covariance intersection fusion for sensor data,” ICCK Transactions on Intelligent Systematics, Vol. 1, No. 1, pp. 10–18, May 2024, https://doi.org/10.62762/tis.2024.136898
-
Y. S. Pan, Y. M. Song, and J. Liu, “Patterns, changes, and new trends in coal mine rockburst prevention in China,” (in Chinese), Chinese Journal of Rock Mechanics and Engineering, Vol. 42, No. 9, pp. 2081–2095, Dec. 2023, https://doi.org/10.13722/j.cnki.jrme.2022.1048
-
S. H. Zhou et al., “A review of research progress on the identification of blasts and collapses,” (in Chinese), Earthquake Research in China, Vol. 37, No. 2, pp. 508–522, Feb. 2021, https://doi.org/10.3969/j.issn.1001-4683.2021.02.022
-
C. F. Richter, “An instrumental earthquake magnitude scale,” Bulletin of the Seismological Society of America, Vol. 25, No. 1, pp. 1–32, Jan. 1935, https://doi.org/10.1785/bssa0250010001
-
R. A. Brazier, Q. Miao, A. A. Nyblade, A. Ayele, and C. A. Langston, “Local magnitude scale for the Ethiopian Plateau,” Bulletin of the Seismological Society of America, Vol. 98, No. 5, pp. 2341–2348, Oct. 2008, https://doi.org/10.1785/0120070266
-
E. Scordilis, D. Kementzetzidou, and B. Papazachos, “Local magnitude estimation in Greece, based on recordings of the Hellenic Unified Seismic Network (HUSN),” Journal of Seismology, Vol. 17, No. 2, pp. 437–451, Feb. 2013, https://doi.org/10.12681/bgsg.10980
-
J. Ristau, D. Harte, and J. Salichon, “A revised local magnitude (ML) scale for New Zealand earthquakes,” Bulletin of the Seismological Society of America, Vol. 106, No. 2, pp. 398–407, Feb. 2016, https://doi.org/10.1785/0120150293
-
L. Quinones et al., “Tracking induced seismicity in the fort worth basin: a summary of the 2008-2018 North Texas earthquake study catalog,” Bulletin of the Seismological Society of America, Vol. 109, No. 4, pp. 1203–1216, Aug. 2019, https://doi.org/10.1785/0120190057
-
S. B. Li, China Earthquakes. Beijing, China: Seismological Press, 1981.
-
P. S. Chen and J. Z. Qin, “Effects of calibration function, station azimuth, station foundation, and different measurement methods on local magnitude ML of near earthquakes,” (in Chinese), Acta Seismologica Sinica, Vol. 5, No. 1, pp. 87–98, 1983.
-
L. Y. Wang, R. F. Liu, and H. Yang, “Study on regional local magnitude calibration functions in China,” (in Chinese), Acta Seismologica Sinica, Vol. 38, No. 5, pp. 693–702, May 2016, https://doi.org/10.11939/jass.2016.05.004
-
R. F. Liu et al., “GB 17740-2017 regulations on earthquake magnitude,” Standards Press of China, Beijing, China, 2017.
-
W. Yang, G. Chen, L. Meng, Y. Zang, H. Zhang, and J. Li, “Determination of the local magnitudes of small earthquakes using a dense seismic array in the Changning-Zhaotong Shale Gas Field, Southern Sichuan Basin,” Earth and Planetary Physics, Vol. 5, No. 3, pp. 1–15, Mar. 2021, https://doi.org/10.26464/epp2021026
-
R. Luckett, L. Ottemöller, A. Butcher, and B. Baptie, “Extending local magnitude ML to short distances,” Geophysical Journal International, Vol. 216, No. 2, pp. 1145–1156, Nov. 2019, https://doi.org/10.1093/gji/ggy484
-
X. Zhang, Z. Wang, H. Yin, R. Liu, A. Li, and Y. Chen, “Enhancing microseismic monitoring through controlled blasting: Waveform analysis, location, and magnitude determination in Dongtan Coal Mine, China,” Seismological Research Letters, Vol. 96, No. 4, pp. 2273–2284, Jul. 2025, https://doi.org/10.1785/0220240445
-
J.-M. Kendall, A. Butcher, A. L. Stork, J. P. Verdon, R. Luckett, and B. J. Baptie, “How big is a small earthquake? Challenges in determining microseismic magnitudes,” First Break, Vol. 37, No. 2, pp. 51–56, Feb. 2019, https://doi.org/10.3997/1365-2397.n0015
-
A. Alsaker, L. B. Kvamme, R. A. Hansen, A. Dahle, and H. Bungum, “The ML scale in Norway,” Bulletin of the Seismological Society of America, Vol. 81, No. 2, pp. 379–398, Feb. 1991, https://doi.org/10.1785/bssa0810020379
-
I. Saunders, L. Ottemöller, M. B. C. Brandt, and C. J. S. Fourie, “Calibration of an ML scale for South Africa using tectonic earthquake data recorded by the South African National Seismograph Network: 2006 to 2009,” Journal of Seismology, Vol. 17, No. 2, pp. 437–451, Jan. 2013, https://doi.org/10.1007/s10950-012-9329-0
-
S. G. Kim and Y. Gitterman, “Underwater explosion (UWE) analysis of the ROKS Cheonan incident,” Pure and Applied Geophysics, Vol. 170, No. 4, pp. 547–560, Aug. 2012, https://doi.org/10.1007/s00024-012-0554-9
-
E. I. Novikova and M. D. Trifunac, “Duration of strong ground motion in terms of earthquake magnitude, epicentral distance, site conditions and site geometry,” Earthquake Engineering and Structural Dynamics, Vol. 23, No. 9, pp. 1023–1043, Jan. 1994, https://doi.org/10.1002/eqe.4290230907
-
J. Havskov and L. Ottemoller, “SEISAN earthquake analysis software,” Seismological Research Letters, Vol. 70, No. 5, pp. 532–534, Sep. 1999, https://doi.org/10.1785/gssrl.70.5.532
-
R. A. Uhrhammer and E. R. Collins, “Synthesis of Wood-Anderson seismograms from broadband digital records,” Bulletin of the Seismological Society of America, Vol. 80, No. 3, pp. 702–716, 1990.
-
S. Design, “The IASPEI new manual of seismological observatory practice,” Seismological Research Letters, Vol. 74, No. 5, pp. 510–518, Jan. 2003, https://doi.org/10.1785/gssrl.71.5.510
-
A. Butcher, R. Luckett, J. P. Verdon, J. M. Kendall, B. Baptie, and J. Wookey, “Local magnitude discrepancies for near‐event receivers: implications for the U.K. traffic‐light scheme,” Bulletin of the Seismological Society of America, Vol. 107, No. 2, pp. 532–541, Jan. 2017, https://doi.org/10.1785/0120160225
About this article

This research was supported by the General Project of Shandong Earthquake Agency (YB2507); Monitoring and Early Warning Task of China Earthquake Administration (CEA-JCYJ-202601019); the Research Team on Non-Natural Earthquake Monitoring and Activity Mechanisms (TD202404) and General Program of the Hubei Provincial Natural Science Foundation – “Research on the Prediction of Earth Rotation Parameters (ERP) Considering Multi-Scale Effects and Effective Angular Momentum” (S24H6403, 2024-2026);and the Project “Research on Extraction and Mechanism of Pre-seismic Transient Deformation Signals Based on Dense GNSS Stations” (SKLPG2026-1-3). Some of the figures in this manuscript were generated using the Generic Mapping Tools (GMT).
The datasets generated during and/or analyzed during the current study are available from the corresponding author on reasonable request.
Yu Wang: conceptualization, data curation, formal analysis, methodology, software, visualization, writing-original draft preparation. Junhao Qu: supervision, conceptualization, methodology, project administration, funding acquisition, writing-review and editing. Ruifeng Liu: supervision, investigation, validation, writing-review and editing. Zibo Wang: data curation, formal analysis, visualization. Qinying Wang: investigation, resources, validation. Kunpeng Shi: software, data curation, formal analysis. Qijie Zhou: resources, project administration. Shiwen Xie: resources, validation.
The authors declare that they have no conflict of interest.
