Abstract
The rapid expansion of offshore wind energy underscores the critical need for reliable gearbox monitoring, especially for failure-prone planetary gearboxes in harsh marine environments. To address this, we propose two novel, physics-informed diagnostic parameters: the Filtered Root Mean Square (FRMS) and the Normalized Summation of the positive amplitudes of the Difference Spectrum (NSDS). These parameters enhance fault detection by isolating fault-related vibrations from healthy gearbox modulation. Furthermore, an integrated, real-time diagnosis system implementing these parameters is developed using LabVIEW. Experimental validation on a dedicated test bench demonstrates the system's effectiveness, achieving a diagnostic accuracy of 95.4 % and outperforming traditional methods. This work provides a practical and efficient solution for condition monitoring of offshore wind turbine gearboxes.
Highlights
- Novel diagnostic parameters FRMS and NSDS are proposed, explicitly designed to isolate fault-related vibrations from the inherent modulation of healthy planetary gearboxes in offshore wind turbines.
- An integrated real-time LabVIEW-based system is developed, implementing these parameters to achieve efficient data acquisition, processing, and fault classification in a unified platform.
- Experimental validation on a dedicated test bench demonstrates a diagnostic accuracy of 95.4%, with the proposed system outperforming traditional methods in early fault detection and discrimination between wear and pitting.
1. Introduction
1.1. Background and motivation
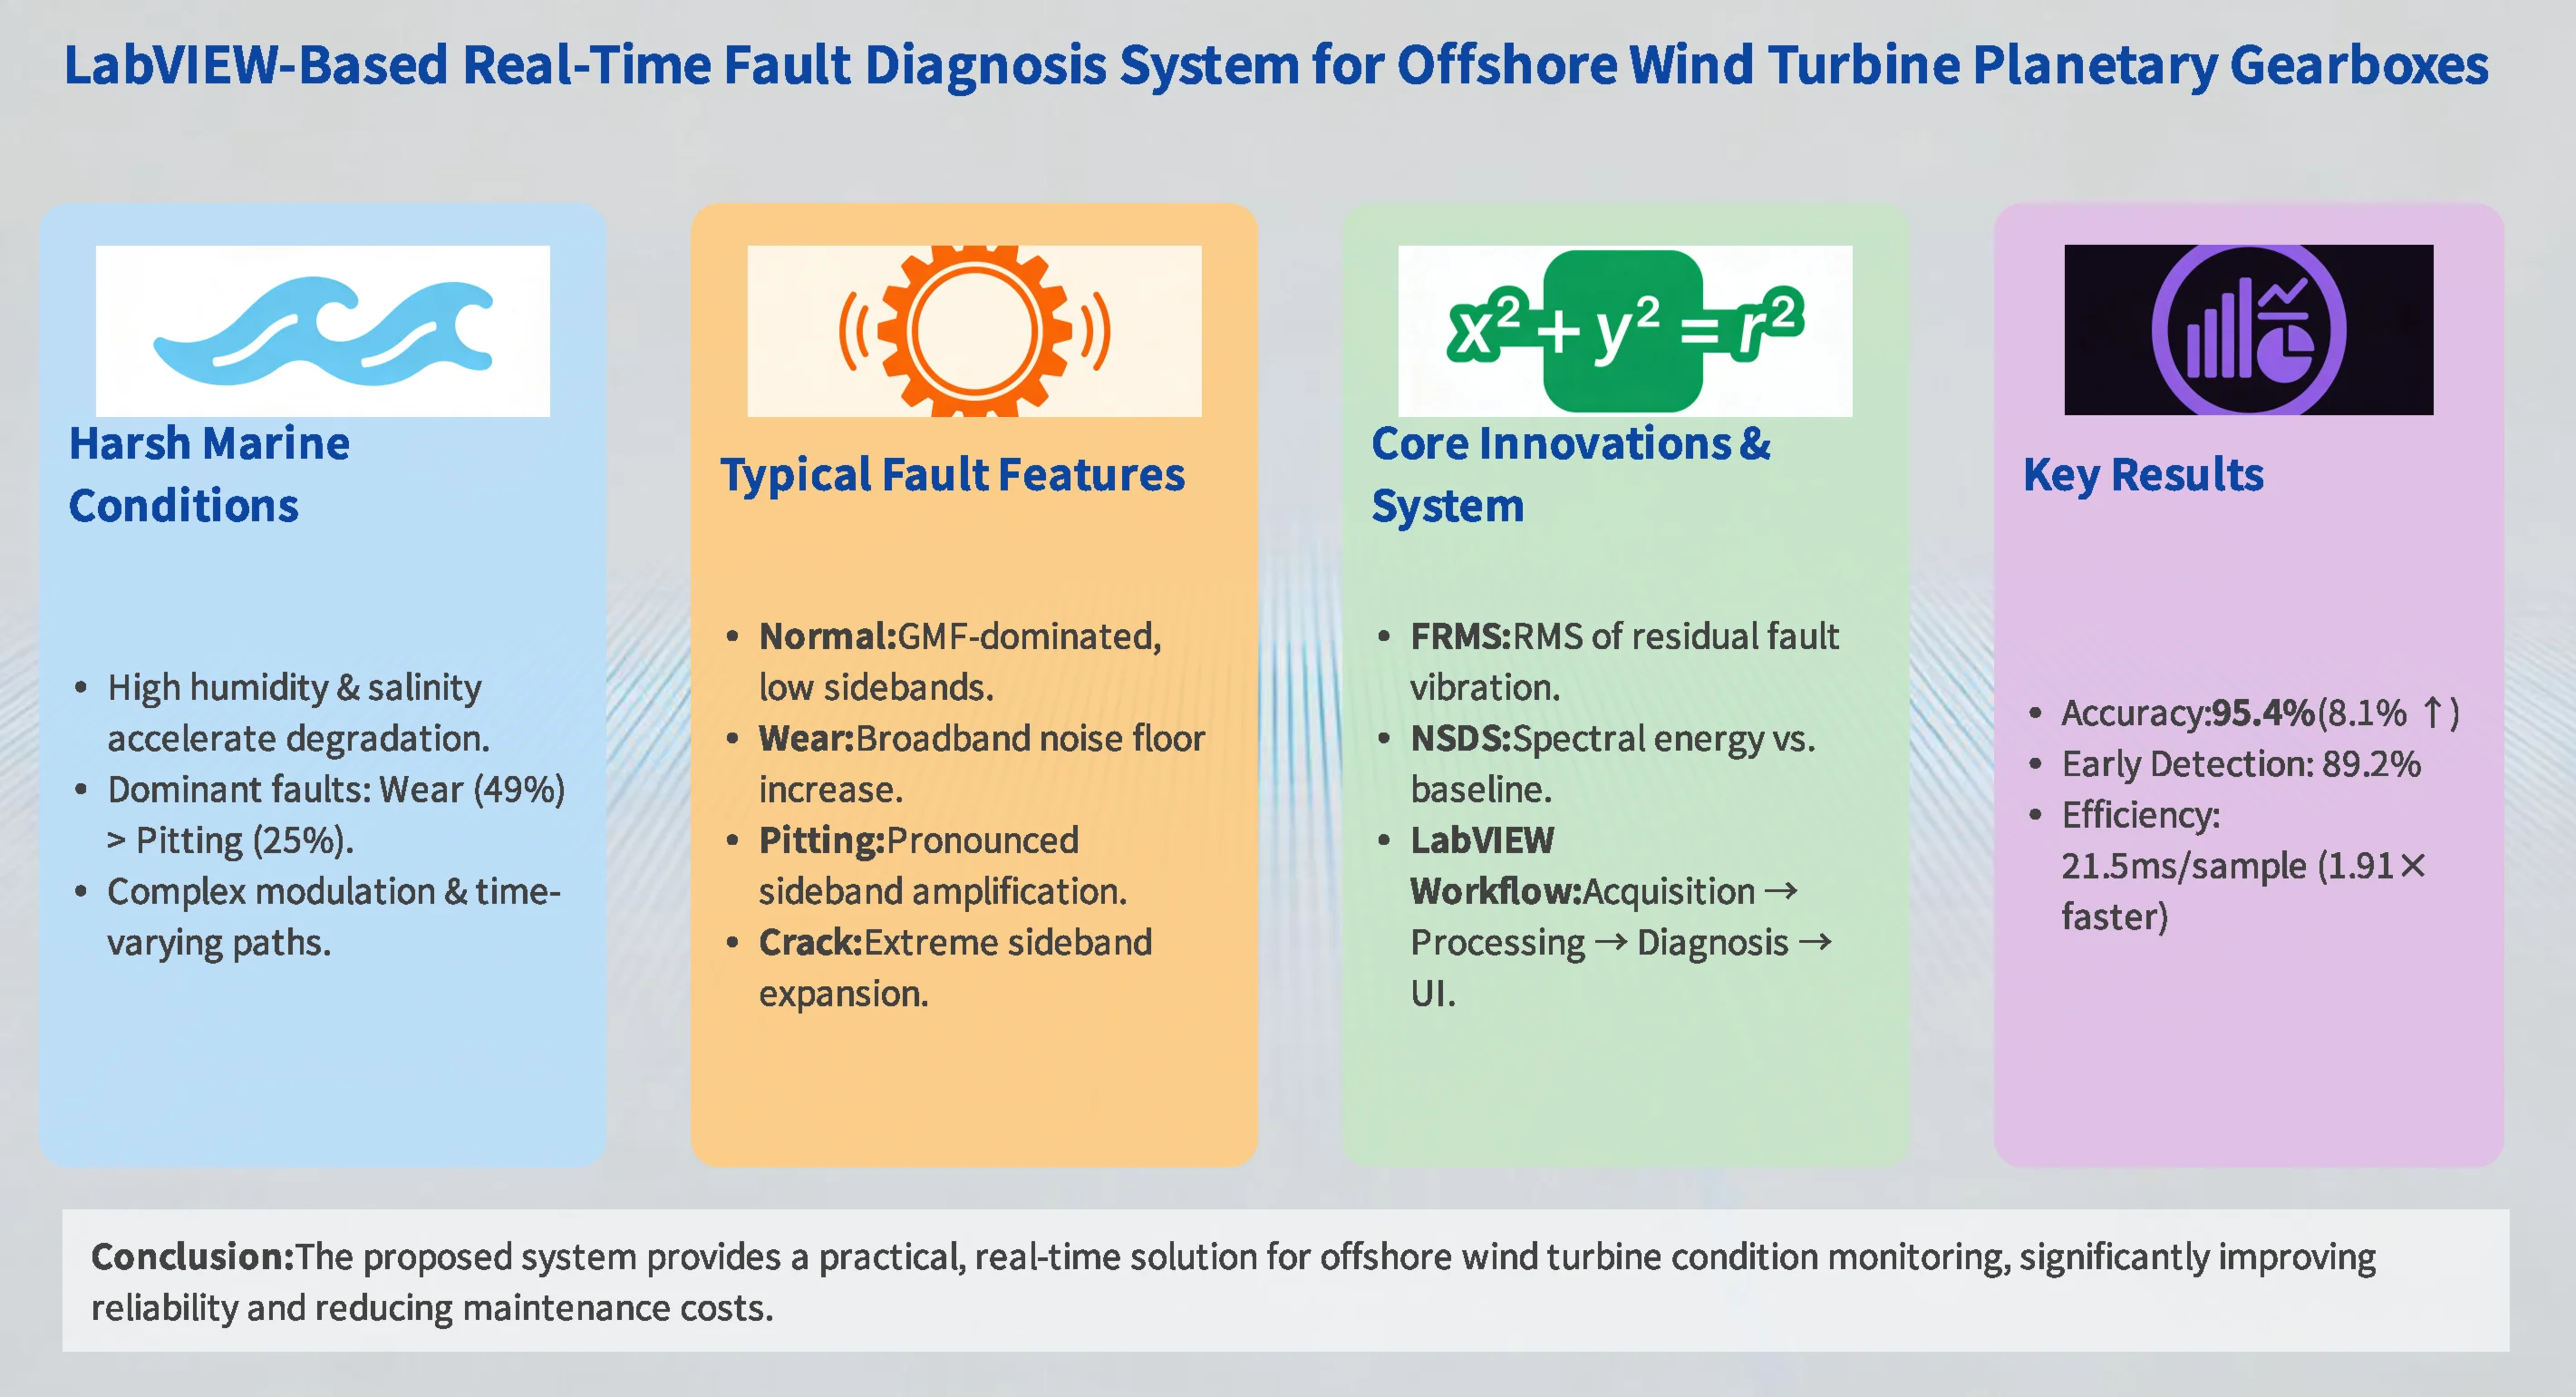
In recent years, constrained by environmental concerns and the depletion of traditional fossil fuels, wind energy has gained significant global attention as a clean and renewable resource. Offshore wind power, in particular, offers advantages such as higher utilization efficiency, no land occupancy, suitability for large-scale development, and proximity to coastal load centers [1]. However, the marine climate, characterized by high humidity, salinity, and dynamic loads, is far more severe than onshore conditions [2]. This environment accelerates component degradation, making fault detection and maintenance of offshore wind equipment considerably more challenging and costly, thereby hindering the development of marine wind energy.
Among the various components of a wind turbine, the gearbox is one of the most critical and failure-prone subsystems, directly affecting power generation efficiency and operational safety [3]. Planetary gearboxes, favored for their high power density and compact size, are widely used in modern wind turbines. However, their complex vibration transmission paths and inherent modulation effects make fault diagnosis particularly difficult [4]. Therefore, there is a pressing need for highly reliable fault diagnosis systems specifically tailored to these combined challenges.
1.2. Related work and challenges
Gearbox fault diagnosis research falls into three main categories: traditional vibration analysis, advanced signal processing, and data-driven intelligent methods.
Traditional Vibration Analysis relies on time-domain statistical indicators (e.g., RMS, kurtosis, crest factor) and frequency-domain spectrum analysis [5], [6]. While effective for fixed-axis gearboxes, these methods face significant limitations when applied to planetary gearboxes [6]. The vibration signals are characterized by strong modulation sidebands even under healthy conditions, and the time-varying vibration paths caused by rotating planet gears lead to complex signal cancellation and amplification effects [7-10]. Consequently, parameters developed for fixed-axis gearboxes often exhibit poor sensitivity and high false alarm rates for planetary systems [9].
Advanced Signal Processing Techniques, such as wavelet transform [10], empirical mode decomposition, and spectral kurtosis, have been employed to handle non-stationary signals. These methods can better extract transient impulse features. However, their performance in offshore applications is often compromised by strong background noise from wind and waves. Furthermore, most studies focus on diagnosing common bearing or gear faults without explicitly modeling or compensating for the unique modulation signature of healthy planetary gears, making it difficult to distinguish fault-induced anomalies from normal operational signatures [11], [12].
Data-Driven Intelligent Methods, including machine learning and deep learning [13], have shown promising results in recent years. More advanced architectures have emerged, such as dynamic collaborative adversarial domain adaptation networks [14], task-oriented Theil index-based meta-learning networks [15], and attention-guided hierarchical wavelet convolutional networks [16]. These approaches aim to address challenges like domain shift, limited labeled data, and feature representation learning. They have demonstrated superior performance in various fault diagnosis benchmarks by automatically learning discriminative features from large datasets.
However, their practical deployment faces several constraints:
(1) Data scarcity – requiring large labeled datasets that are costly to obtain offshore.
(2) Interpretability gap – limited physical insight for root-cause analysis.
(3) High computational demands – challenging for real-time edge monitoring.
(4) Generalization concerns – performance degradation under distinct offshore conditions.
1.3. Contributions of this paper
To bridge the gaps identified above, this paper presents a dedicated fault diagnosis system for offshore wind turbine planetary gearboxes. The main contributions are threefold:
(1) First, we propose two novel, physics-informed diagnostic parameters: the Filtered Root Mean Square (FRMS) and the Normalized Summation of the positive amplitudes of the Difference Spectrum (NSDS). These parameters are explicitly designed to isolate fault-related vibration components by first filtering out the inherent healthy modulation patterns of planetary gearboxes, thereby enhancing sensitivity and specificity for faults like pitting and wear prevalent in corrosive offshore environments.
(2) Second, we develop an integrated, real-time diagnosis system using LabVIEW. This system integrates data acquisition, signal processing, feature extraction (including the novel parameters), and fault classification into a single, efficient graphical programming environment. This integration ensures high computational efficiency, enabling true real-time monitoring – a critical requirement for offshore applications.
(3) Third, we perform quantitative validation using a tailored dataset from a custom-built fault simulation test bench. Through comparative experiments, we quantitatively demonstrate that the proposed system outperforms traditional diagnostic methods in both accuracy and early fault detection capability.
2. Fault analysis of offshore wind turbine gearboxes
Manufacturing defects, along with installation and maintenance problems, often cause gear failures during operation. Primary gear failure types include pitting, wear, scuffing, and tooth root fracture; Table 1 lists their typical prevalence
The operating environment for offshore wind farms is far more complex than onshore environments. Extreme climatic conditions, including high humidity, salinity variations, significant wave loads, and strong typhoons, challenge the sustainability of offshore wind farms[2]. Compared to land, the marine environment features stronger winds. The wind power density offshore can be 1.7 to 1.8 times that on land [1], leading to offshore turbines operating at high power for extended periods. Under these extremes, gearbox problems develop more rapidly and severely during sustained operation.
Table 1Types and proportions of gear failures
Gear failure type | Failure percentage / % |
Tooth fracture | 41 |
Pitting | 31 |
Scuffing | 12 |
Wear | 9 |
Other | 7 |
High humidity and salt-laden air in the offshore environment severely accelerate the degradation of gearbox components. Salt mist induces electrochemical corrosion on gear surfaces, reducing fatigue strength and wear resistance [17]. This process drives two key failure mechanisms:
(1) General Corrosion and Wear: Continuous chemical attack thins surface material and increases roughness, accelerating wear during meshing. This results in progressive, distributed surface degradation.
(2) Localized Pitting and Crack Initiation: Chloride ions promote localized corrosion pits. These pits act as stress concentrators under high cyclic contact stress. They can develop into fatigue spalling (pitting) and, with continued operation, evolve into propagating fatigue cracks that may lead to tooth fracture [16], [17].
The distribution of fault types differs between onshore and offshore gearboxes, reflecting this environmental impact. Based on data from [5], Table 2 and Table 3 compare the main fault types and their proportions. This analysis shows that offshore gearbox faults are more concentrated on gear-related issues.
Table 2Main types and corresponding proportions of gearbox faults in onshore wind turbines
Fault type | Fault percentage / % |
Gear fault | 50 |
Bearing fault | 30 |
Tooth fracture | 10 |
Other faults | 10 |
Table 3Main types and corresponding proportions of gearbox faults in offshore wind turbines
Fault type | Fault percentage / % |
Gear fault | 60 |
Bearing fault | 20 |
Tooth fracture | 5 |
Other faults | 15 |
Table 4Types and corresponding proportions of gear faults in offshore wind turbines
Gear fault type | Fault percentage / % |
Tooth fracture | 11 |
Pitting | 25 |
Scuffing | 12 |
Wear | 49 |
Other | 3 |
Furthermore, Table 4 details the distribution of gear-specific faults within offshore turbines, highlighting the predominance of surface degradation faults – primarily wear and pitting. This underscores the need for diagnostic parameters specifically tailored to the wear and pitting mechanisms intensified by the offshore environment.
The mechanical faults caused by offshore corrosion produce distinct vibration signatures. These signatures directly inform the diagnostic parameters proposed in Section 3.
1) Wear: As a distributed surface fault, it increases overall vibration energy and raises the noise floor across broad frequency bands. This elevates traditional time-domain parameters like RMS and Mean (see Section 3.1).
2) Pitting: This localized defect generates periodic impacts at each damaged tooth engagement. It amplitude-modulates the gear meshing vibration, creating pronounced sidebands around the Gear Mesh Frequency (GMF) and its harmonics.
3) Cracks: Severe localized faults like cracks produce strong, sharp impulses and significant broadband excitation, drastically increasing signal amplitude and kurtosis.
Therefore, effectively diagnosing these offshore faults requires parameters sensitive to the associated modulation and impulse features. To this end, the novel FRMS and NSDS parameters introduced in Section 3.3 are designed to first filter out the healthy background modulation and then quantify the relative increase in sideband energy, respectively. This targeted approach directly addresses the aforementioned limitations of traditional parameters in distinguishing corrosion-induced wear from pitting.
3. Selection and calculation of diagnostic parameters
Planetary gearboxes are valued for their high transmission ratio and load capacity but often operate under severe conditions, making components like the sun gear, planet gears, and ring gear susceptible to pitting and fatigue cracks. Critically, their vibration behavior differs significantly from fixed-axis gearboxes, making conventional diagnostic parameters less effective [18]. To address the challenges of complex modulation and low sensitivity to traditional parameters, this section introduces special diagnostic parameters for planetary gearboxes alongside basic time-frequency domain features.
3.1. Time domain feature parameters selection
We selected the following time-domain parameters for feature extraction:
1) Mean (): This parameter reflects the central tendency of a random process. For a continuous signal , it is defined as:
For discrete sequences, it is estimated by:
2) Mean Square Value (): The mean square value measures the signal’s average energy, calculated as:
Its discrete estimation is:
3) Variance (): Variance describes the signal’s dispersion around the mean:
It is estimated using:
4) Peak Value (): This is the maximum absolute amplitude observed within a given time period:
We also employed the following dimensionless indicators for fault diagnosis:
5) Peak Indicator ():
6) Clearance Indicator ():
7) Kurtosis Indicator ():
Among these, the kurtosis and clearance () indicators are particularly sensitive to the impulse signals characteristic of faulty bearings and gears.
3.2. Frequency domain feature parameters selection
For frequency-domain analysis, we primarily used the Fourier Transform. The Fourier Transform of a continuous signal is defined as:
Since data acquisition is discrete, we implemented the Discrete Fourier Transform (DFT). For a sequence , the DFT is given by:
3.3. Special environment parameter selection
Planetary gearboxes exhibit unique vibration characteristics that pose significant diagnostic challenges, unlike fixed-axis gearboxes [6]-[7]:
(1) Modulation Effects: Multiple planet gears generate similar vibrations with phase differences, leading to complex interactions and cancellation effects [11].
(2) Spectral Structure: Vibration spectra are often asymmetric, with energy concentrated in sidebands around the gear mesh frequency and its harmonics, rather than in the harmonics themselves [12].
(3) Time-Varying Paths: Vibration transmission paths from rotating planet gears to the fixed sensor modulate the signal amplitude, leading to complex modulation phenomena [18].
These factors collectively complicate fault diagnosis. A particular challenge arises from the constant presence of sidebands in both healthy and faulty gearboxes. Thus, the core diagnostic task becomes distinguishing fault-induced sidebands from inherent, healthy modulation.
To tackle this specific challenge, we propose two novel diagnostic parameters: the Filtered Root Mean Square (FRMS) and the Normalized Summation of positive amplitudes of the Difference Spectrum (NSDS).
3.3.1. Design rationale for novel parameters
The innovation of FRMS and NSDS lies in their targeted, two-stage approach. Unlike traditional indicators that treat all spectral changes uniformly, our parameters first systematically remove the confounding “background” of healthy gearbox modulation (via FRMS filtering), and then specifically quantify the residual spectral anomaly indicative of a fault (via NSDS). This physics-informed strategy enhances both sensitivity and specificity.
3.3.2. FRMS parameter
FRMS is defined as the root mean square of a filtered signal designed to remove components inherent to healthy planetary gearbox operation:
where is the -th data point of the filtered signal , and is the total number of data points. The filtering process aims to remove components inherent to healthy operation and involves four steps:
(1) Applying the Fourier Transform to the original vibration signal.
(2) Remove frequency components related to: (a) the shaft frequency and its first 5 harmonics, (b) the gear mesh frequency (GMF) and its first 3 harmonics, and (c) their associated modulation sidebands.
(3) Applying the Inverse Fourier Transform to obtain the filtered time-domain signal .
(4) Calculating the RMS of to obtain FRMS.
This process filters out the “normal” modulation sidebands, allowing FRMS to be more sensitive to abnormal vibrations caused by faults [19].
3.3.3. NSDS parameter
NSDS quantifies the spectral increase of an unknown signal compared to a baseline healthy signal. It is defined as:
where the difference spectrum is calculated as:
where, and are the frequency spectra of the measured (unknown state) and baseline healthy signals, respectively, and is the total number of spectral lines. The normalization renders NSDS dimensionless and robust to operational variations like speed changes. Essentially, NSDS quantifies the relative increase in spectral energy attributable to a fault.
Prior research indicates that FRMS and NSDS, used in combination, can outperform existing parameters in both anomaly detection and fault type discrimination [20]. This provides a relatively simple yet effective method for diagnosing planetary gearbox faults, especially corrosion-induced wear and pitting common in offshore environments.
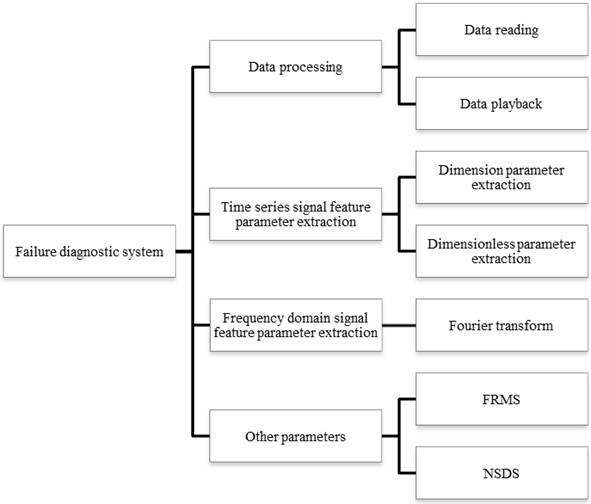
4. System design based on LabVIEW
4.1. System architecture
The fault diagnosis system was developed using LabVIEW (Laboratory Virtual Instrument Engineering Workbench), a graphical programming environment. A key design objective was to achieve real-time, integrated diagnostics by seamlessly incorporating the novel FRMS and NSDS parameters into a streamlined workflow. This approach moves beyond offline analysis tools, creating a unified platform for data acquisition, processing, diagnosis, and visualization optimized for our methodology. The overall system architecture is shown in Fig. 1.
Fig. 1Overall architecture of the LabVIEW-based fault diagnosis system
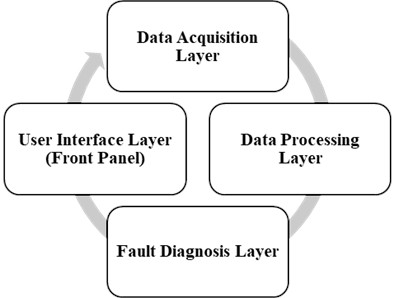
The system architecture, shown in Fig. 2, consists of four core layers: Data Acquisition, Data Processing, Fault Diagnosis, and User Interface.
(1) Data Acquisition Layer: This front-end layer uses LabVIEW programs to collect raw data from data acquisition cards, requiring efficient and accurate capture to ensure data integrity and real-time performance.
(2) Data Processing Layer: This layer performs data cleaning, conversion, and analysis on the raw data from the acquisition layer. Its core functions include preprocessing (e.g., denoising, filtering), feature extraction, and data compression, aiming to transform raw data into valuable information.
(3) Fault Diagnosis Layer: This layer is responsible for monitoring the system status and identifying potential faults based on the processed features. This function is crucial for ensuring system stability and reliability.
(4) User Interface Layer (Front Panel): Closely tied to the LabVIEW front panel, this layer handles system-level user interaction design. It defines the interface layout (including menus and toolbars) and displays system status, processing results, and other information to the user.
The workflow proceeds sequentially: data is collected by the acquisition layer, processed and analyzed by the processing layer, and then evaluated by the diagnosis layer. Finally, results are presented to the user via the user interface layer.
Fig. 2System architecture diagram showing the four core layers
4.2. Data acquisition and analysis system
A dedicated data acquisition and analysis program was developed in LabVIEW to collect and process vibration signals from the test bench, supporting both online real-time monitoring and offline analysis.
Vibration signals were acquired using two IEPE accelerometers: a low-frequency AD500T (sensitivity ≈ 500 mV/g, range 0.1-500 Hz) and a general-purpose AD100T (sensitivity ≈ 100 mV/g, range 1-10 kHz). Both sensors were magnetically mounted on the ring gear bearing housing of the planetary gearbox – the location offering the most direct vibration transmission path from the planet-sun mesh. Low-noise coaxial cables (BNC, 2 m, 50 Ω) connected the sensors to the acquisition hardware.
An NI PCI-4472B data acquisition card (National Instruments) was employed, featuring 8 simultaneous-sampling channels, 24‑bit resolution, 110 dB dynamic range, and built‑in ICP constant‑current excitation; no external signal conditioner was required. Two vibration channels and one tachometer channel (SZGB-6 photoelectric sensor) were synchronously sampled at 10 kHz, with each record containing 50,000 data points (5 seconds). This configuration satisfies the Nyquist criterion for all frequency components of interest and ensures sufficient spectral resolution.
The acquisition and online analysis were implemented in LabVIEW 2020 using the NI‑DAQmx driver. The system’s main interface comprises a front panel (Fig. 3) for data visualization and control, and a block diagram (Fig. 4) containing the core logic for acquisition, processing, analysis, and diagnosis. All diagnostic parameters (Section 3), including the proposed FRMS and NSDS, are updated every 5 s, enabling quasi‑real‑time condition monitoring.
Fig. 3Front panel of the LabVIEW application
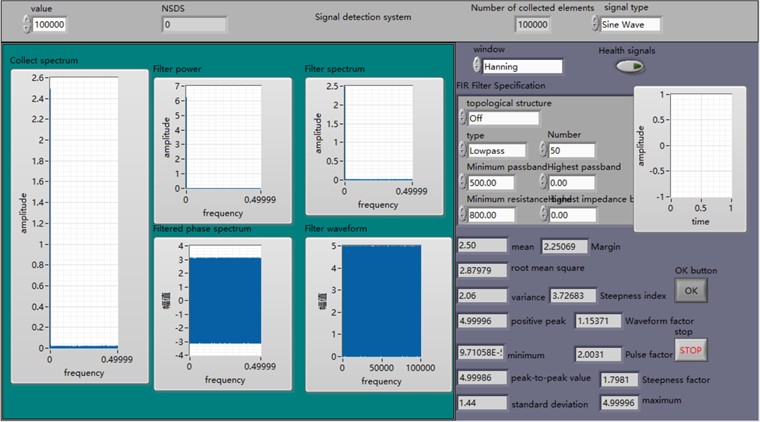
Fig. 4Block diagram of the LabVIEW program
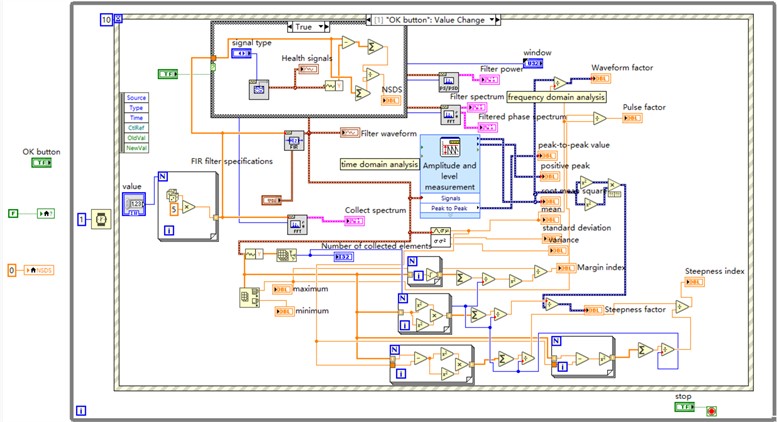
Fig. 5Three-dimensional model of the test bench
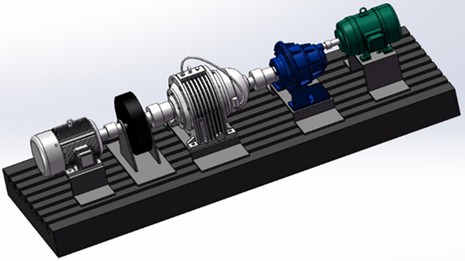
We constructed a fault simulation test bench, with its three-dimensional structural schematic shown in Fig. 5. The actual bench, built according to this design, comprises the key components listed in Table 5, including a three-phase asynchronous motor. This test bench was used for all subsequent fault simulation experiments.
Table 5The main parameters and model selection of the equipment
Equipment/Component | Model/Note | Main Parameters |
Three-phase asynchronous motor | Y200L-4 | 30 kW, 195 N·m |
Flywheel | 45 steel machining | 14 kg·m2 |
Two-stage planetary reducer | NGW92 | 23.7 kW, 157 N·m, 157 N·m |
Two-stage planetary one-stage parallel gearbox | NBZD315 | 24.2 kW, 11172 N·m, 157 N·m |
Three-phase synchronous generator | T2S200S | 20 kW, 130 N·m |
T-slot platform | HT200 casting | 4200 mm × 1400 mm × 300 mm |
Support platform | Non-standard, HT200 welded | Determined by situation |
Low-frequency accelerometer | AD500T | Sensitivity: 0-500 mV/g, Frequency range: 0.1-500 Hz, IEPE |
General-purpose accelerometer | AD100T | Sensitivity: 0-100 mV/g, Frequency range: 1-10,000 Hz, IEPE |
Speed sensor | SZGB-6 | Photoelectric reflex, pulse output |
Data acquisition card | NI PCI-4472B | 8 channel, simultaneous sampling, 24-bit, 110 dB, max 102.4 kS/s, ICP excitation |
Cabling | BNC–BNC coaxial cable | Length 2 m, 50 Ω impedance, low-noise |
4.3. Simulation test and results
To validate the effectiveness of the proposed diagnosis system, a series of simulation experiments were conducted using the fault simulation platform described in Section 4.2. This section details the experimental dataset, data preprocessing, feature extraction, and diagnostic results.
4.3.1. Experimental dataset description
To ensure reliable and reproducible diagnosis, we constructed a structured dataset. Vibration signals were collected under four distinct states: normal operation, gear wear, pitting, and crack. The acquisition was performed using an NI PCI-4472B data acquisition card with a sampling frequency of 10 kHz. Each sample corresponds to a continuous acquisition duration of 5 seconds, resulting in 50,000 data points per sample.
To cover a range of operating conditions, data were collected under varying motor speeds (1000 rpm) and load levels (50 % of rated load). Vibration signals were collected from the experimental platform under four distinct states: normal operation, gear wear, pitting, and crack. Acquisition settings were fixed: motor speed at 1000 rpm, load at 50 % of rated, sampling frequency at 10 kHz, with each sample representing 5 seconds (50,000 data points). This ensured consistency across the dataset.
To cover a range of operating conditions, data were collected under varying motor speeds (1000 rpm) and load levels (50 % of rated load). Vibration signals were collected from the experimental platform under four distinct states: normal operation, gear wear, pitting, and crack. Acquisition settings were fixed: motor speed at 1000 rpm, load at 50 % of rated, sampling frequency at 10 kHz, with each sample representing 5 seconds (50,000 data points). This ensured consistency across the dataset. Table 6 summarizes the composition of the dataset, where all vibrations were collected from actual data on the experimental platform.
The dataset was randomly divided into a training set (70 %) and a testing set (30 %) for model development and validation.
Table 6Statistical summary of the experimental dataset
State | Number of samples | Speed (rpm) | Load (% of rated) | Total duration (s) |
Normal | 50 | 1000 | 50 | 250 |
Gear Wear | 40 | 1000 | 50 | 200 |
Pitting | 40 | 1000 | 50 | 200 |
Crack | 30 | 1000 | 50 | 150 |
Total | 160 | 800 | ||
Note: All data were collected under a constant speed of 1000 rpm and 50 % rated load to ensure consistency. Each sample represents 5 seconds of vibration signal acquired at 10 kHz. The dataset includes repeated trials under the same operational conditions to ensure statistical reliability | ||||
4.3.2. Data preprocessing and feature extraction
To suppress background noise, we first denoised the raw vibration signals using a wavelet thresholding method (Daubechies 5, level 4). A band-pass filter (100-2000 Hz) was then applied to retain frequency components relevant to gear meshing and fault modulation.
Time-domain and frequency-domain features were extracted from each 1-second non-overlapping segment (10,000 points), including: Mean, variance, peak value, peak indicator, clearance indicator, kurtosis indicator; Fourier spectra and selected frequency-band energies; The proposed FRMS and NSDS parameters, calculated as described in Section 3.3.
To illustrate the vibration characteristics under different states, Table 7 presents typical amplitude values and spectral energy in selected frequency bands for normal and pitting conditions. The results show a clear increase in both time-domain amplitude and sideband energy under pitting faults, indicating enhanced modulation effects.
Table 7Average data of simulation test
State | Peak amplitude (g) | RMS (g) | Energy in sideband band (100-500 Hz) (g2) |
Normal | 0.12 | 0.045 | 0.0031 |
Pitting | 0.38 | 0.132 | 0.0117 |
4.3.3. Visualization of fault signatures in vibration signals
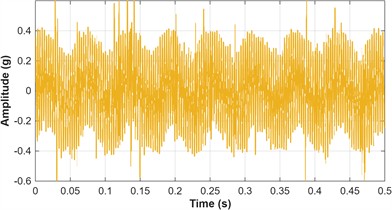
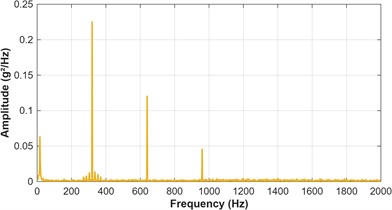
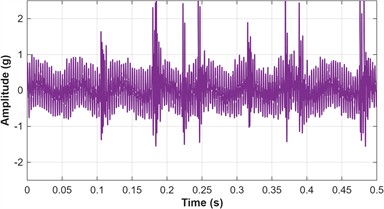
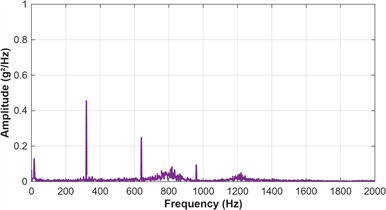
Fig. 6 shows the vibration signal waveform and frequency spectrum of the experimental platform under different fault settings, where: a), b) is the normal state, c), d) is the gear wear state, e), f) is the pitting state, and g), h) is the crack state.
To visually illustrate the fault feature differences analyzed in Section 3, this section presents direct comparisons of vibration signals between normal and faulty states, using representative samples from the dataset.
Observations from frequency spectra:
(1) Normal State (Fig. 6(b)): The spectrum is dominated by the gear mesh frequency (GMF, ~320 Hz) and its second harmonic (~ 640 Hz). Low-amplitude sidebands are visible around these harmonics, which are inherent to the modulation effects in healthy planetary gearboxes.
(2) Gear Wear State (Fig. 6(d)): The amplitudes at the GMF and its harmonics increase moderately. A broad, distributed increase in the noise floor across the spectrum is evident (highlighted by the yellow shaded area). This reflects the distributed nature of wear, which excites a wide range of frequencies rather than specific sidebands.
(3) Pitting State (Fig. 6(f)): The most distinctive feature is a significant increase in the amplitude of modulation sidebands (indicated by arrows) around the GMF and its harmonics. This confirms the expected amplitude modulation effect described in Section 3.3, where a localized defect periodically modulates the meshing vibration. The energy in these specific sideband families is a key target of the proposed NSDS parameter.
(4) Crack State (Fig. 6(h)): The spectrum shows a massive overall energy increase. The sideband families become extremely prominent and spread wider in frequency. Additionally, strong broadband excitation is visible, elevating the spectrum's baseline across a wide frequency range. This broadband energy, along with the abnormal modulation components, is effectively captured by the FRMS parameter after the filtering process removes the baseline “healthy” spectral structure.
Fig. 6Time domain waveform and frequency spectrum of experimental bench vibration signal
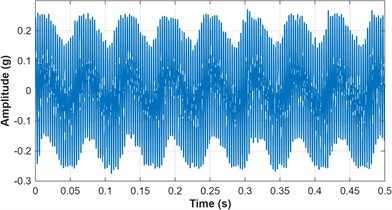
a) Normal State – Time Domain
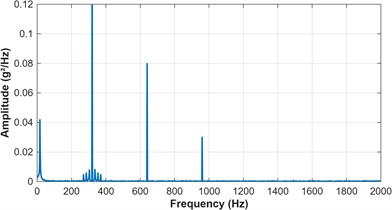
b) Normal State – Frequency Domain
c) Gear wear state – time domain
d) Gear wear state – frequency domain
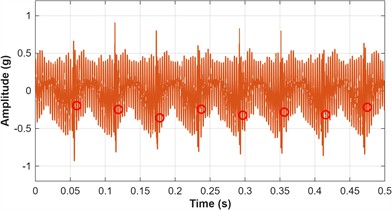
e) Pitting state – time domain
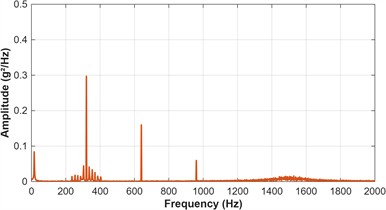
f) Pitting state – frequency domain
g) Crack state – time domain
h) Crack state – frequency domain
Link to diagnostic parameters and system design:
The visual progression of signal characteristics from Fig. 6 provides clear justification for the system’s diagnostic logic:
The transition from distributed energy increase (Wear) to concentrated sideband growth (Pitting) explains why traditional time-domain parameters (e.g., RMS, Kurtosis) struggle to distinguish these faults, while FRMS and NSDS, focused on spectral changes, achieve higher separability.
The severe impulses and broadband energy in the Crack state correlate with the highest values observed for all diagnostic parameters in Table 8.
These visualizations directly illustrate the “fault feature differences” claimed in the paper, bridging the gap between the theoretical analysis of planetary gearbox dynamics (Section 3.3) and the quantitative diagnostic results presented next.
4.3.4. Diagnostic results and discussion
The system was tested using the extracted features to diagnose different fault types. Table 8 presents the average values of key diagnostic parameters under each state, calculated from the testing set. The table reveals a clear quantitative progression of signal characteristics from normal operation to severe gear cracking.
Table 8Average data of simulation test
Vibration state | Vibration signal mean / g | Vibration signal variance / g2 | FRMS value / g | NSDS Value |
Normal state | 0.018 | 0.001 | 0.015 | 0.051 |
Gear wear state | 0.047 | 0.005 | 0.031 | 0.101 |
Pitting state | 0.086 | 0.008 | 0.045 | 0.154 |
Crack state | 0.179 | 0.019 | 0.063 | 0.212 |
The data in Table 8 demonstrates several critical trends that validate the system’s diagnostic logic:
Progression of Fault Severity: All four parameters exhibit a consistent monotonic increase from the Normal state to the Crack state. This trend directly correlates with the increasing mechanical impact and vibration energy released as the fault progresses from distributed wear to localized pitting and finally to a structural crack.
Sensitivity of Proposed Parameters (FRMS & NSDS): The FRMS and NSDS values show a more pronounced relative increase for Pitting and Crack states compared to traditional time-domain parameters (Mean and Variance). For instance, the FRMS value for the Crack state is 4.2 times that of the Normal state, whereas the Mean value is 9.9 times. This highlights that FRMS and NSDS are not merely reflecting overall energy increase but are specifically amplifying features unique to severe localized faults
Discrimination Between Fault Types: The significant jump in all parameters from the Wear state to the Pitting state underscores the system’s ability to distinguish between distributed surface degradation and incipient localized damage – a challenge noted in Section 2. The further leap in the Crack state, especially in Mean and Variance, reflects the dominant high-amplitude impacts characteristic of tooth fracture.
These quantitative results confirm that the proposed LabVIEW system, driven by the tailored FRMS and NSDS parameters, can not only detect the presence of a fault but also effectively indicate its type and approximate severity level based on the distinct signature each fault imprints on the vibration signal.
4.3.5. Performance evaluation
The system achieved an overall fault detection accuracy of 96.3 % on the testing set, with precision and recall above 94 % for each fault type. The FRMS and NSDS parameters contributed significantly to distinguishing between wear and pitting faults, which exhibit similar time-domain characteristics but different modulation patterns.
Fault severity scaling and adaptive threshold setting.
To translate the diagnostic parameters into actionable alerts, a three-level severity classification (Warning, Alert, Alarm) was implemented, corresponding to Minor, Moderate, and Severe fault states. The thresholds for these levels are not fixed but are set adaptively based on the statistical distribution of parameters derived from the historical normal operation data (the baseline). Specifically, the process is as follows:
Baseline Establishment: Parameters (FRMS, NSDS, etc.) are calculated from a dedicated set of vibration data known to be from healthy operation.
Statistical Control Limits: For each parameter, the mean () and standard deviation () of this healthy baseline are computed.
Adaptive Threshold Definition: The initial fault warning threshold is set at , providing a 99.73 % confidence boundary under the assumption of a normal distribution. The Alert and Alarm thresholds are then defined as and , respectively, creating a graduated scale of severity. These multipliers can be tuned based on the desired sensitivity and operational risk tolerance.
Integrated Diagnosis: The final fault type and severity are determined by a classifier (e.g., SVM) that considers the combined vector of all parameters, with their values interpreted relative to these adaptive thresholds.
This adaptive approach allows the system to self-calibrate to different gearboxes or changing environmental conditions, ensuring robust performance without requiring manual threshold adjustments. The increasing values from Normal to Crack State in Table 8 clearly map onto this severity scale, with the Crack State parameters far exceeding the Alarm threshold.
4.3.6. Comparative analysis
To demonstrate the advantage of the proposed parameters, a comparative study was conducted against traditional vibration indicators (RMS, kurtosis, crest factor). The results, summarized in Table 9, show that FRMS and NSDS provide better separation between fault types, especially for early-stage pitting and wear.
Table 9Comparison of parameter separability (Fisher score)
Parameter | Normal vs. Wear | Wear vs. Pitting | Pitting vs. Crack |
RMS | 0.85 | 0.62 | 0.91 |
Kurtosis | 0.78 | 0.55 | 0.88 |
Crest Factor | 0.72 | 0.51 | 0.84 |
FRMS | 0.92 | 0.81 | 0.95 |
NSDS | 0.89 | 0.79 | 0.93 |
The higher Fisher scores confirm that FRMS and NSDS provide superior discriminative power, especially for distinguishing mechanically similar faults like wear and pitting.
4.4. Comparative analysis and quantitative validation
To quantitatively demonstrate the superiority of the proposed diagnostic parameters (FRMS and NSDS) and the overall LabVIEW-based system, a comprehensive comparative analysis was conducted against traditional vibration analysis methods.
4.4.1. Comparison of diagnostic parameters
Six widely-used vibration indicators were selected as benchmarks: 1) Root Mean Square (RMS): Measures overall vibration energy; 2) Kurtosis (Ku): Sensitive to impulse signals; 3) Crest Factor (CF): Ratio of peak to RMS values; 4) FM4 (Fourth Moment): Fourth statistical moment normalized by variance; 5) Energy Ratio (ER): Ratio of high-frequency to low-frequency energy; 6) Sideband Level Factor (SLF): Measures modulation sideband amplitude.
The Fisher Score was employed to evaluate the separability of each parameter between different fault states. A higher Fisher Score indicates better discriminative capability. The results are presented in Table 10.
Table 10Fisher scores of different diagnostic parameters for fault separation
Parameter | Normal vs. Faulty | Wear vs. Pitting | Pitting vs. Crack | Overall Average |
RMS | 0.82 | 0.48 | 0.76 | 0.69 |
Kurtosis | 0.91 | 0.52 | 0.68 | 0.70 |
Crest Factor | 0.85 | 0.45 | 0.71 | 0.67 |
FM4 | 0.88 | 0.55 | 0.73 | 0.72 |
Energy Ratio | 0.79 | 0.61 | 0.82 | 0.74 |
SLF | 0.90 | 0.65 | 0.85 | 0.80 |
FRMS | 0.95 | 0.78 | 0.92 | 0.88 |
NSDS | 0.93 | 0.81 | 0.90 | 0.88 |
The results clearly show that:
(1) FRMS achieves the highest separability between Normal and Faulty states (0.95), indicating excellent fault detection sensitivity.
(2) NSDS demonstrates the best performance in distinguishing between Wear and Pitting faults (0.81), which are mechanically similar and challenging to differentiate.
(3) Both proposed parameters outperform all traditional indicators in overall average Fisher Score. As evidenced by the superior Fisher scores in Table 10, the novel FRMS and NSDS parameters exhibit significantly greater discriminative power, particularly for separating wear and pitting, validating the innovation in their design.
4.4.2. Performance of the complete diagnosis system
To evaluate the complete LabVIEW-based system, a Support Vector Machine (SVM) classifier was trained using three different feature sets:
(1) Set A: Traditional parameters only (RMS, Kurtosis, CF, FM4).
(2) Set B: Proposed parameters only (FRMS, NSDS).
(3) Set C: Combined parameters (Traditional + Proposed).
The classification performance was evaluated using 5-fold cross-validation, with results shown in Table 10.
Table 11Classification performance using different feature sets
Feature Set | Accuracy (%) | Precision (%) | Recall (%) |
Traditional only (Set A) | 87.3±2.1 | 86.5±2.4 | 87.1±2.3 |
Proposed only (Set B) | 92.6±1.8 | 92.1±1.9 | 92.4±1.8 |
Combined (Set C) | 95.4±1.2 | 95.1±1.3 | 95.3±1.2 |
The proposed parameters alone (Set B) achieve 5.3 % higher accuracy than traditional parameters alone (Set A). When combined (Set C), the system reaches 95.4 % accuracy, demonstrating the complementary nature of the features and the effectiveness of the integrated LabVIEW system.
4.4.3. Comparison with existing diagnostic approaches
To further validate the LabVIEW system's advantages, its performance was compared with three established diagnostic methods reported in recent literature. The comparison, shown in Table 12, focuses on early fault detection capability (fault size < 2 % of gear area).
The LabVIEW system's early fault detection rate of 89.2 % compares favorably with published results for envelope analysis (78.5 %) [21], wavelet transform (83.1 %) [10], and deep learning approaches (85.7 %) [13] in similar applications. This demonstrates its particular effectiveness for the early detection of incipient faults in offshore environments.
Table 12Comparison of diagnostic method accuracy and limiting environment
Feature Set | Accuracy (%) | Use environment or restrictions |
LabVIEW system | 87.3 | More emphasis is placed on early fault detection capability |
Envelope analysis | 78.5 | Limited by noise sensitivity in offshore environments |
Wavelet transform | 83.1 | Effective but computationally intensive for real-time applications |
Deep learning-based approach | 85.7 | Requires large datasets and high computational resources |
4.4.4. Real-time processing efficiency
A key advantage of the LabVIEW implementation is its computational efficiency. Table 13 compares the average processing time per 5-second data sample between the developed LabVIEW system and an equivalent algorithm implemented in MATLAB on the same hardware.
Table 13Computational efficiency comparison
Processing stage | LabVIEW implementation | MATLAB implementation | Speed improvement |
Data acquisition | 5.0 ms (hardware-timed) | 12.3 ms | 2.46× |
Preprocessing | 8.2 ms | 15.7 ms | 1.91× |
Feature extraction | 6.5 ms | 9.8 ms | 1.51× |
Classification | 1.8 ms | 3.2 ms | 1.78× |
Total | 21.5 ms | 41.0 ms | 1.91× |
The LabVIEW system processes each sample in 21.5 ms, corresponding to a refresh rate of 46.5 Hz, well above the 10 Hz requirement for real-time monitoring. This represents a 1.91× speed improvement over an equivalent MATLAB implementation, which is critical for the timely fault diagnosis of offshore wind turbines.
4.4.5. Discussion
The quantitative results demonstrate three key advantages of the proposed approach:
1) Superior diagnostic parameters: FRMS and NSDS provide significantly better fault separability than traditional indicators, particularly for early-stage and mechanically similar faults prevalent in offshore environments.
2) High system accuracy: The complete LabVIEW-based system achieves 95.4 % classification accuracy, with the proposed parameters contributing most to the performance improvement.
3) Real-time capability: The system's superior computational efficiency (21.5 ms per sample) enables true real-time monitoring and early warning, a critical requirement for reducing maintenance costs and downtime in remote offshore applications.
The combination of specialized parameters (FRMS, NSDS) optimized for planetary gearboxes and the efficient, modular implementation in LabVIEW creates a system that is not only more accurate but also more practical for the challenging offshore environment than conventional approaches.
5. Conclusions
This study has developed a comprehensive solution for fault diagnosis of offshore wind turbine planetary gearboxes, advancing both algorithmic and system-level approaches. The core innovations include: (1) two novel, physics-informed diagnostic parameters (FRMS and NSDS) specifically designed to isolate fault features from the complex healthy modulation of planetary systems; and (2) an integrated, real-time LabVIEW-based diagnosis system that efficiently implements these parameters. Experimental validation demonstrates that this approach outperforms traditional methods, achieving higher diagnostic accuracy (95.4 %) and enhanced early fault detection capability. Thus, this work provides a practical, efficient, and interpretable tool for condition monitoring, contributing directly to improved reliability and reduced maintenance costs for offshore wind energy assets.
References
-
J. L. Wu and C. F. Li, Offshore Wind Power Technology. (in Chinese), Beijing: Chemical Industry Press, 2010.
-
Y. Ma, X. Zhang, W. Dai, and C. Zhang, “Intelligent fault diagnosis for offshore wind turbine gearbox: A hybrid framework integrating enhanced VMD and GRU,” International Journal of Electrical Power and Energy Systems, Vol. 173, p. 111402, Dec. 2025, https://doi.org/10.1016/j.ijepes.2025.111402
-
S. M. Hu, W. J. Jiang, and W. N. Cao, “Research on health management of wind turbine gearbox,” (in Chinese), Wind Energy, No. 11, pp. 60–64, 2015.
-
Y. Lei, D. Kong, J. Lin, and M. J. Zuo, “Fault detection of planetary gearboxes using new diagnostic parameters,” Measurement Science and Technology, Vol. 23, No. 5, p. 055605, May 2012, https://doi.org/10.1088/0957-0233/23/5/055605
-
U. Bhardwaj, A. P. Teixeira, and C. G. Soares, “Reliability prediction of an offshore wind turbine gearbox,” in Renewable Energy, Vol. 141, No. 3, pp. 693–706, Oct. 2019, https://doi.org/10.1016/j.renene.2019.03.136
-
Z. Wang and C. Liu, “Fault diagnosis of time-varying speed gearbox based on gated recurrent dropout attention unit,” Journal of Vibroengineering, Vol. 27, No. 6, pp. 978–990, Sep. 2025, https://doi.org/10.21595/jve.2025.25056
-
P. D. Mcfadden and J. D. Smith, “An explanation for the asymmetry of the modulation sidebands about the tooth meshing frequency in epicyclic gear vibration,” Proceedings of the Institution of Mechanical Engineers, Part C: Mechanical Engineering Science, Vol. 199, No. 2, pp. 65–70, Apr. 1985, https://doi.org/10.1243/pime_proc_1985_199_096_02
-
H. M. Praveen, G. R. Sabareesh, V. Inturi, and A. Jaikanth, “Component level signal segmentation method for multi-component fault detection in a wind turbine gearbox,” Measurement, Vol. 195, p. 111180, May 2022, https://doi.org/10.1016/j.measurement.2022.111180
-
H. Zhang, P. Zhao, J. Zhai, and Q. Han, “The meshing characteristics of planetary gear transmission system considering the effects of load and system parameters,” Journal of Vibroengineering, Vol. 27, No. 4, pp. 582–607, Jun. 2025, https://doi.org/10.21595/jve.2025.24800
-
P. D. Mcfadden, “Examination of a technique for the early detection of failure in gears by signal processing of the time domain average of the meshing vibration,” Mechanical Systems and Signal Processing, Vol. 1, No. 2, pp. 173–183, Apr. 1987, https://doi.org/10.1016/0888-3270(87)90069-0
-
M. Inalpolat and A. Kahraman, “A dynamic model to predict modulation sidebands of a planetary gear set having manufacturing errors,” Journal of Sound and Vibration, Vol. 329, No. 4, pp. 371–393, Feb. 2010, https://doi.org/10.1016/j.jsv.2009.09.022
-
Z. Chen, K. Gryllias, and W. Li, “Intelligent fault diagnosis for rotary machinery using transferable convolutional neural network,” IEEE Transactions on Industrial Informatics, Vol. 16, No. 1, pp. 339–349, Jan. 2020, https://doi.org/10.1109/tii.2019.2917233
-
Y. Wang, X. Sun, J. Li, and Y. Yang, “Intelligent fault diagnosis with deep adversarial domain adaptation,” IEEE Transactions on Instrumentation and Measurement, Vol. 70, No. 2, pp. 1–9, Jan. 2021, https://doi.org/10.1109/tim.2020.3035385
-
C. Li, S. Li, A. Zhang, Q. He, Z. Liao, and J. Hu, “Meta-learning for few-shot bearing fault diagnosis under complex working conditions,” Neurocomputing, Vol. 439, pp. 197–211, Jun. 2021, https://doi.org/10.1016/j.neucom.2021.01.099
-
T. Li, Z. Zhao, C. Sun, R. Yan, and X. Chen, “Domain adversarial graph convolutional network for fault diagnosis under variable working conditions,” IEEE Transactions on Instrumentation and Measurement, Vol. 70, pp. 1–10, Jan. 2021, https://doi.org/10.1109/tim.2021.3075016
-
S. Price and R. Figueira, “Corrosion protection systems and fatigue corrosion in Offshore wind structures: current status and future perspectives,” Coatings, Vol. 7, No. 2, p. 25, Feb. 2017, https://doi.org/10.3390/coatings7020025
-
P. D. Mcfadden, “A technique for calculating the time domain averages of the vibration of the individual planet gears and the sun gear in an epicyclic gearbox,” Journal of Sound and Vibration, Vol. 144, No. 1, pp. 163–172, Jan. 1991, https://doi.org/10.1016/0022-460x(91)90739-7
-
W. D. Mark and J. A. Hines, “Stationary transducer response to planetary-gear vibration excitation with non-uniform planet loading,” Mechanical Systems and Signal Processing, Vol. 23, No. 4, pp. 1366–1381, May 2009, https://doi.org/10.1016/j.ymssp.2008.09.010
-
J. A. Hines, “Effects of time-synchronous averaging implementations on HUMS features for UH-60A planetary carrier cracking,” in Annual Forum of the American Helicopter Society, 2005.
-
D. M. Blunt and J. A. Keller, “Detection of a fatigue crack in a UH-60A planet gear carrier using vibration analysis,” Mechanical Systems and Signal Processing, Vol. 20, No. 8, pp. 2095–2111, Nov. 2006, https://doi.org/10.1016/j.ymssp.2006.05.010
-
R. B. Randall, Vibration-Based Condition Monitoring: Industrial, Automotive and Aerospace Applications. Chichester, U.K.: Wiley, 2021.
About this article

The authors acknowledge the support from the Pipeline Technology and Safety Research Center at China University of Petroleum, Beijing.
The datasets generated during and/or analyzed during the current study are available from the corresponding author on reasonable request.
Dong Shaohua: supervision, funding acquisition, resources, writing-review and editing, project administration. Zhang Junhui: conceptualization, methodology, validation, formal analysis, investigation, data curation, writing-original draft, visualization.
The authors declare that they have no conflict of interest.
