Abstract
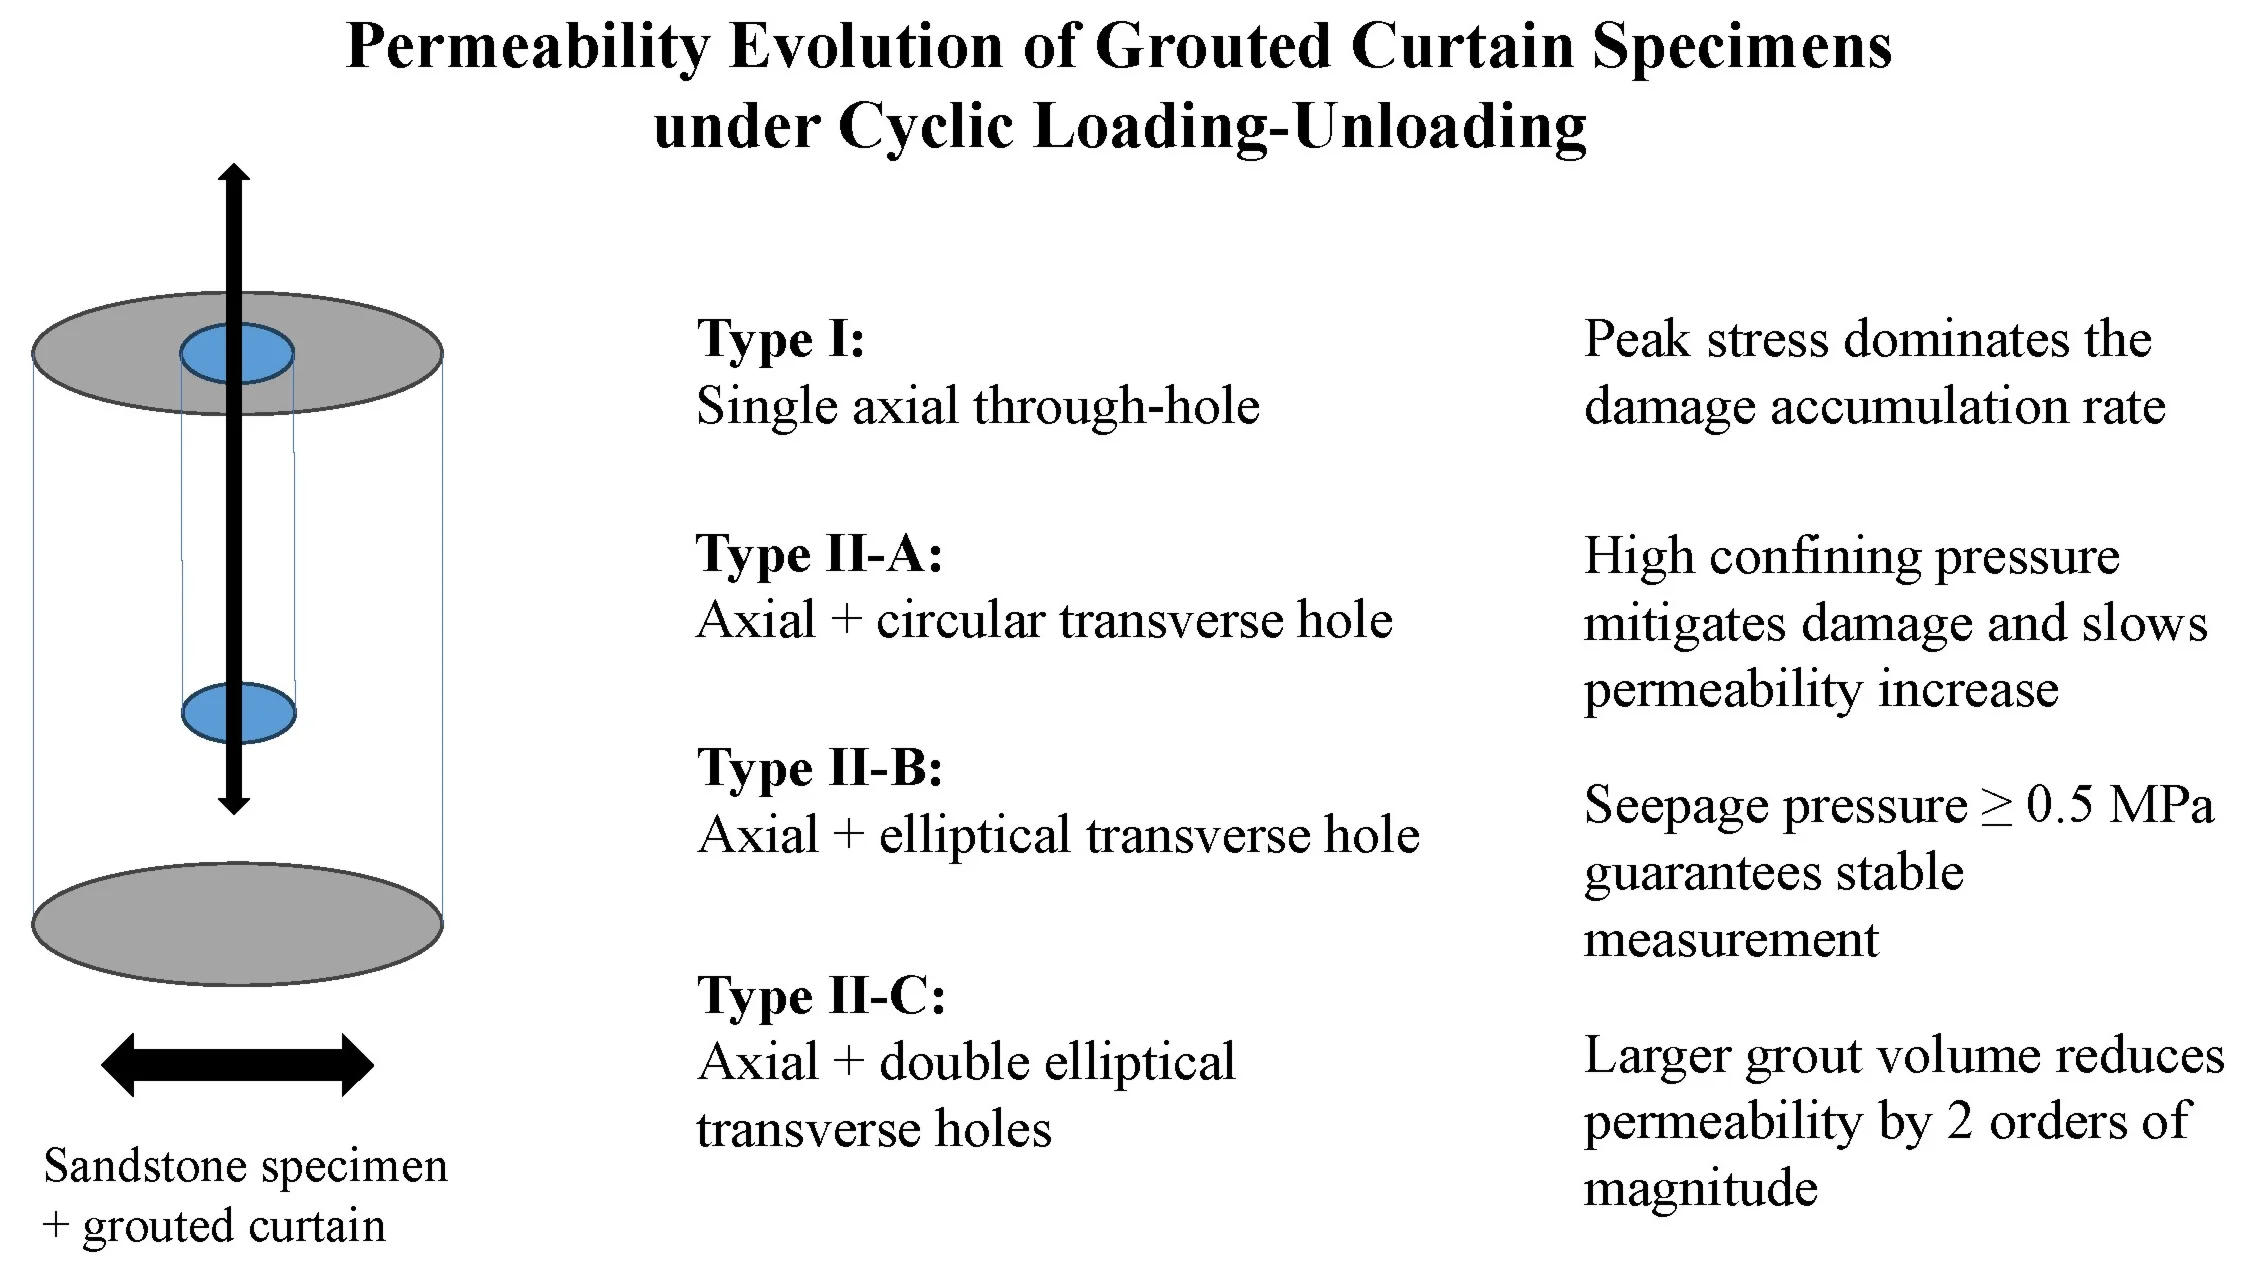
Two types of rock specimens simulating grout curtains were prepared: one featuring solely an axial through-hole and the other featuring combined axial and transverse holes (termed combined-hole specimens). Coupled permeability-damage tests under cyclic loading-unloading were conducted to analyze the effects of peak stress level, confining pressure, seepage pressure difference, and defect geometry (curtain filling configuration) on permeability evolution and damage accumulation. The results indicate that: (1) Peak stress level is the primary factor governing damage development rate; (2) Higher confining pressure mitigates damage in the surrounding rock and decelerates permeability increase; (3) Larger seepage pressure difference (≥ 0.5 MPa) significantly enhances the stability and accuracy of permeability measurements; (4) For combined-hole configurations, increasing the transverse hole area (and thus the grout volume) provides more lateral seepage paths, effectively reducing axial permeability by up to two orders of magnitude. This study provides an experimental framework for assessing the long-term sealing performance of grouted curtains under repeated dynamic loading akin to blasting disturbances.
Highlights
- Cyclic loading-unloading tests were performed on prefabricated grouted curtain specimens to reveal permeability-damage evolution under blasting-like disturbances.
- Peak stress level is the dominant factor controlling damage rate, while high confining pressure effectively restrains permeability growth.
- A seepage pressure difference ≥ 0.5 MPa is critical to ensure the accuracy and stability of permeability measurement.
- Increasing transverse defect area and grout filling ratio can reduce axial permeability by up to two orders of magnitude by lengthening seepage paths.
1. Introduction
In rock blasting theory, rock damage primarily refers to the process encompassing the initiation [1], propagation, coalescence, and eventual formation of macroscopic fractures within rock subjected to blasting vibration loads, leading to material deterioration and failure [2]. During blasting operations in open-pit mining, dozens or even hundreds of blasting events are often required to achieve the designed ore production. Consequently, the rock mass of the mine slope containing grouting curtains is subjected to multiple, cyclic blasting dynamic loads [3, 4]. To ensure mine safety, extensive research has been conducted on the cumulative effects of blasting on seepage and damage evolution in the surrounding rock mass.
Based on acoustic wave testing results, Li Hai Bo [5] investigated the cumulative damage law induced by blasting vibrations and established a relationship between the number of blast vibrations and the damage extent of the rock mass using regression analysis. Wang C. L. et al. [6] performed cumulative impact tests on standard rock specimens, examining the relationship between the cumulative damage in the specimens and the number of impact load repetitions, and characterizing the stress-strain relationship of limestone specimens at varying impact repetition counts. Biao Zhang et al. [7] conducted permeability tests on granite specimens throughout the complete stress-strain process under triaxial compression. Utilizing an acoustic emission (AE) monitoring system [8], they recorded the cumulative ring-down counts during specimen failure and investigated the mechanical damage evolution mechanism of granite under varying confining pressures, along with its influence on the permeability characteristics of the rock.
Chen Z. W. et al. [9, 10] conducted coupled stress-seepage tests on granitic gneiss specimens, investigating the dependencies of permeability on factors including seepage pressure, confining pressure, effective confining pressure, volumetric strain, and stress path under two distinct stress paths: conventional triaxial compression and axial cyclic loading-unloading, analyzing the influence of varying confining and seepage pressures on granite permeability as well as the variations in permeability with confining pressure, seepage pressure, and volumetric strain during the rock’s deformation-to-failure process. Parallel to this, significant advances have been made in understanding fracture network evolution and fluid flow under cyclic loading. Recent studies have employed techniques like CT imaging and 3D reconstruction to quantify the morphological evolution and flow conductivity of fracture channels in rocks subjected to cyclic loading-unloading [11]. Others have focused on characterizing the surface roughness of fractures and its controlling effect on gas flow patterns [12]. These works highlight the paramount importance of defect geometry and its evolution in governing macroscopic seepage behavior. However, they primarily address natural or induced fractures within intact rock, rather than engineered, grout-filled defects simulating remediation structures like curtains.
Building upon previous research, this study addresses the critical gap in understanding how the predefined geometry of artificial defects (simulating karst caves filled with grout) governs the seepage behavior and damage evolution in grouted curtains subjected to cyclic loading-unloading conditions. To realistically simulate the repeated blasting events common in mining engineering, cyclic loading was employed instead of monotonic loading, as the latter fails to capture the cumulative damage effects crucial for assessing long-term grout curtain performance [13].
Accordingly, laboratory specimens simulating grout curtains were prepared with two types of artificially prefabricated defects: (1) a simple axial through-hole (Ø6 mm), representing a primary seepage channel, and (2) combined axial and transverse holes with circular or elliptical cross-sections, mimicking more complex karst cave networks with varying lateral flow path geometries. A key focus of this investigation is to quantify the impact of these defect configurations, particularly the role of transverse hole area and morphology in diverting axial flow and reshaping seepage pathways.
The novelty of this work lies in its systematic and first-time experimental revelation of the controlling influence of defect geometry on the permeability hysteresis and damage accumulation in grouted curtains under cyclic loading. To this end, coupled permeability-damage tests under cyclic loading-unloading were conducted, analyzing the effects of peak stress level, confining pressure, seepage pressure difference, and defect configuration.
2. Preparation of grouted curtain specimens
2.1. Rock specimens and artificial defect fabrication
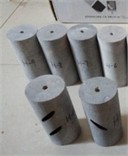
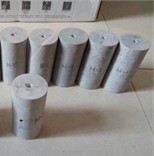
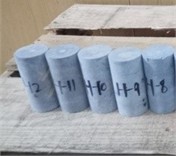
The surrounding rock mass of cement mines contains abundant karst fissures [14], caves, and solution cavities, forming highly permeable groundwater seepage channels. Obtaining intact surrounding rock cores containing grout curtains is challenging in practice. Therefore, to simulate the natural seepage channels and their remediation via grouting, standard cylindrical specimens (Ø50 mm × 100 mm) were prepared from homogeneous sandstone.
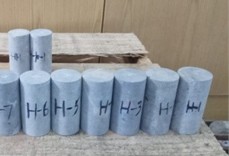
Two types of artificial through-holes were prefabricated to simulate different karst defect geometries before grouting: (1) a single axial through-hole, and (2) combined axial and transverse through-holes. All holes were drilled using a precision computer numerical control (CNC) drilling machine equipped with a diamond-tipped bit (Ø6 mm). The drilling process was conducted at a low feed rate (5 mm/min) with continuous water cooling to minimize the generation of microcracks around the hole periphery, thereby ensuring the defect geometry was the dominant variable. The positions and dimensions of all holes were verified using a digital caliper (accuracy ±0.01 mm). Fig. 1 shows the schematic and photographs of the prepared specimens.
2.2. Grout material and curtain formation
A clay-cement grout, commonly used in field engineering for seepage control, was prepared in the laboratory. The mix proportion by weight was: water: cement: clay = 1.0: 1.0: 0.5. The cement was ordinary Portland cement (P.O 42.5), and the clay was sodium bentonite. The components were mixed thoroughly to achieve a homogeneous, flowable slurry.
The grout was then carefully injected into the prefabricated holes under low air pressure until complete filling was observed from the opposite end. After injection, the specimen ends were immediately sealed with a quick-setting epoxy resin to prevent grout leakage and moisture loss. The specimens were subsequently polished to ensure the end surfaces were flat and parallel. Finally, all specimens were placed in a standard curing chamber (relative humidity > 95 %, temperature 25±2 °C) for 28 days to allow the grout to achieve its design strength, simulating a cured grout curtain within the rock matrix.
2.3. Classification of specimen configurations
The specimens are categorized into three distinct configurations based on the geometry and volumetric filling ratio of the prefabricated defects – key parameters governing seepage path complexity.
Type I (Simple Axial Channel): This configuration features a single axial through-hole (Ø6 mm), representing a basic, straight-line seepage path.
Type II (Complex Cross-Hole Network): This type incorporates combined axial and transverse through-holes and is subdivided based on the morphology and cross-sectional area of the transverse hole: II-A: A circular transverse hole (Ø6 mm), corresponding to a grout mass filling ratio of 0.9 %. II-B: A single elliptical transverse hole (6 mm×30 mm), with a grout mass filling ratio of 2.18 %. II-C: Double elliptical transverse holes, resulting in a grout mass filling ratio of 3.96 %.
This classification enables a quantitative examination of the influence of both lateral flow path expansion and grout volume increase on the overall seepage and damage behavior under cyclic loading.
Fig. 1Schematic diagrams and photographs of grouted curtain specimens. Photo by Haijie Wen, Zhuzhou, China, July 11, 2025
a) Type I
b) Type II-A
c) Type II-B
d) Type II-C
3. Testing principles
3.1. Definition of damage variable
Rock damage is characterized by the irreversible deterioration of macroscopic mechanical properties due to the initiation and propagation of microcracks [15]. This deterioration is quantified using a damage variable, which can be defined through various methods such as the elastic modulus degradation method, acoustic wave velocity method, maximum strain method, and residual strain method [16-19].
The maximum strain method was selected for this study for the following reasons: (1) It directly captures the accumulation of irreversible plastic deformation during cyclic loading-unloading, which is a macroscopic manifestation of internal micro-damage; (2) The required parameter (peak strain in each cycle) is obtained directly and accurately from the stress-strain curves recorded by the servo-hydraulic system, without the need for interrupting the test for additional measurements (e.g., ultrasonic wave tests), thus ensuring the continuity of the cyclic loading process and the consistency of the damage-permeability coupling data.
The cumulative damage variable is defined as:
where: , , are the maximum axial strain at the peak stress during the first loading-unloading cycle, the th cycle, and the last cycle of the final disturbance level, respectively. represents the cumulative damage of the specimen under cyclic loading-unloading, ranging from 0 (undamaged) to 1 (fully damaged at the final stage).
3.2. Transient permeability measurement
Permeability of rock specimens is commonly measured using two methods: the steady-state method and the transient method. The transient method determines permeability by recording the time-dependent decay of the seepage pressure difference across the specimen during flow.
Transient permeability tests were conducted using an MTS 815 rock mechanics testing system. Its pore pressure system consists of two pressure vessels of equal volume, each independently controllable. Permeability was measured using the transient decay-flow method, with data recorded automatically. A key technical consideration in this study was the maintenance of a sufficiently large seepage pressure differential (≥ 0.5 MPa) to minimize fluctuations caused by manual valve operation and ensure flow stabilization, thereby significantly improving measurement accuracy compared to conventional low-pressure-difference setups. Based on these MTS-recorded data from the permeability tests, specimen permeability can be calculated using the following formula:
Hydraulic conductivity, conversely, depends on two factors: (1) the intrinsic permeability of the rock/soil matrix, and (2) the properties of the fluid, namely its density () and dynamic viscosity (). A defined conversion relationship exists between hydraulic conductivity and permeability:
where: is the intrinsic permeability of the specimen; is the duration of the permeability measurement; is the ratio of the initial to final seepage pressure differential; and are the cross-sectional area and height of the specimen, respectively; is the dynamic viscosity of water (0.001 Pa·s); is the compressibility coefficient of water (4.53×10⁻10 Pa⁻1); and is the volume of one pressurization tank (309 cm3).
Note: The intrinsic permeability calculated from Eq. (2) is in units of cm2. In the results and discussion, permeability values are reported in m² (1 cm2 = 10⁻4 m2) for consistency with common practice.
4. Experimental apparatus
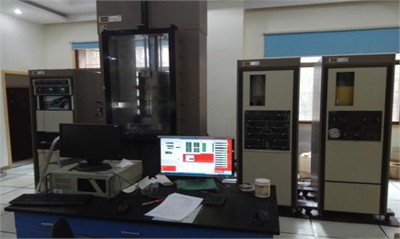
The experimental tests employed an electro-hydraulic servo-controlled rock triaxial testing system (MTS Model 815), manufactured by MTS Systems Corporation, USA, as shown in Fig. 2. This system is capable of conducting static and dynamic mechanical tests on geo-materials such as rock and concrete. Key functionalities include uniaxial and triaxial compression tests, pore water pressure application, permeability tests, and temperature simulation. It features three control modes: displacement, load (force), and strain. Control mode switching is possible during testing (e.g., from triaxial compression to permeability testing), enabling the simulation of multi-field coupling conditions, such as stress-seepage coupling, stress-temperature coupling, and permeability-damage coupling.
Fig. 2MTS 815 Electro-hydraulic Servo-controlled Rock Triaxial Testing System. Photo by Haijie Wen, Zhuzhou, China, July 16, 2025
5. Testing program
5.1. Design rationale for loading parameters
The cyclic loading-unloading tests were designed to simulate the cumulative effect of repeated blasting disturbances on grout curtains in a mine slope environment. The selection of key parameters was based on both engineering practice and experimental feasibility: Peak Axial Stress (52, 83, 114 MPa): These levels were chosen to represent a range from moderate to high stress states relative to the typical uniaxial compressive strength (UCS) of the surrounding sandstone (≈100-120 MPa). This covers scenarios from elastic shakedown to progressive damage accumulation, akin to the stress history experienced by rock near a slope under repeated blasting. The specific values allow for a clear examination of stress-level dependency.
Confining Pressure (1, 3, 5 MPa): These values simulate varying depths of burial for the grout curtain, from shallow (low confining pressure) to moderately deep conditions.
Seepage Pressure Difference (0.3, 0.5, 0.7 MPa): This range was selected to investigate the sensitivity of permeability measurements to the applied hydraulic gradient, with the higher end (0.7 MPa) ensuring stabilized flow for accurate data acquisition (as justified in Section 3.2).
Cyclic Loading Pattern: Stepwise increasing peak stress (e.g., Case 1) was employed to study damage evolution across different intensity levels, while constant peak stress tests (e.g., Cases 2-6) isolated the effects of other variables. This approach aligns with established methodologies for investigating fatigue and cumulative damage in rocks.
5.2. Test matrix
Six permeability-damage coupling test conditions were designed, as detailed in Table 1. The core experimental variable in Cases 1-3 is the defect configuration (Type I), while the loading/environmental parameters are varied. Cases 4-6 focus on comparing the performance of different grout curtain configurations (Types II-A, II-B, II-C) under identical mechanical and seepage conditions.
Table 1Permeability-damage coupling test conditions
Test case | Peak axial stress (MPa) | Confining stress (MPa) | Seepage pressure difference (MPa) | Specimen defect configuration (before grouting) |
1 | 52/83/114 (stepwise) | 1 | 0.7 | Single axial through-hole (Ø6 mm) – Type I |
2 | 83 | 1/3/5 | 0.7 | Single axial through-hole (Ø6 mm) – Type I |
3 | 83 | 1 | 0.3/0.5/0.7 | Single axial through-hole (Ø6 mm) – Type I |
4 | 8 | 1 | 0.7 | Axial (Ø6 mm) + Transverse circular hole (Ø6 mm) – Type II-A |
5 | 8 | 1 | 0.7 | Axial (Ø6 mm) + Transverse elliptical hole (6×30 mm) – Type II-B |
6 | 8 | 1 | 0.7 | Axial (Ø6 mm) + Double transverse elliptical holes – Type II-C |
Note: For test cases 4-6, the uniaxial compressive strength of the composite (rock+grout) specimen decreased with increasing grout volume. The strength for Case 5 (Type II-B) was approximately 16 MPa | ||||
5.3. Loading procedure example
Taking test case 1 as an example, the loading sequence for the stepwise cyclic axial loading-unloading is detailed in Table 2. Throughout the test, confining pressure was maintained at 1 MPa. After each loading-unloading cycle at a given stress level, the axial load was held at the minimum value (1 MPa) for 300 seconds to allow pore pressure equilibrium before the seepage pressure difference (0.7 MPa) was re-applied and permeability was measured.
Table 2Loading sequence for graded cyclic axial loading-unloading (Test Case 1)
Load level | Peak Stress Level (MPa) | Unloading Axial Stress (MPa) | Cycles |
1 | 52 | 1 | 6 |
2 | 83 | 1 | 6 |
3 | 114 | 1 | 6 |
6. Analysis of test results
6.1. Evolution characteristics of permeability-damage under different stress levels
As shown in Fig. 3, the deviatoric stress-strain curve for test case 1 under graded cyclic axial loading-unloading clearly demonstrates that the deformation of the specimen subjected to the same stress load disturbance gradually increases with the number of loading-unloading cycles within the same load level. As shown in the Fig. 3, at peak stresses of 52 MPa, 83 MPa, and 114 MPa, the maximum peak strains corresponding to the deviatoric stress-strain curves are parallel to the -axis (strain axis).This phenomenon indicates that the damage variable defined by the maximum strain method is reasonable and feasible, and that this method can effectively represent the damage development in rock specimens during the cyclic loading-unloading process.
Fig. 4 shows the cumulative damage variable versus number of cycles curves for rock specimens containing a grout curtain under cyclic loading-unloading at different peak stresses. In the figure, at peak stresses of 52 MPa, 83 MPa, and 114 MPa, the rate of increase damage variable for the rock mass containing a grout curtain are differed. At a peak stress of 52 MPa, the cumulative damage variable increases approximately linearly with increasing number of cycles. As the peak stress level increases, the increase of the cumulative damage variable with increasing number of cycles follows a polynomial evolution law. If the relationship between the cumulative damage variable and number of cycles is represented by a linear slope for all three peak stress levels in the figure, the slope increases. That is, as the peak stress increases, the rate of damage accumulation accelerates. Thus, the peak stress is the primary factor governing the damage development rate in rock specimens containing a grout curtain.
Fig. 3Deviatoric stress-strain curves for test case 1 under graded cyclic axial loading-unloading
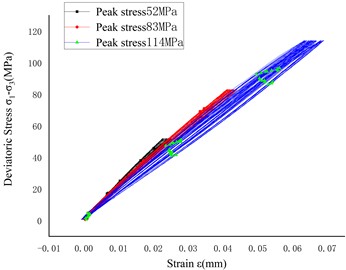
Fig. 4Cumulative damage variable versus number of cycles curve for specimens with a grout curtain under cyclic loading-unloading
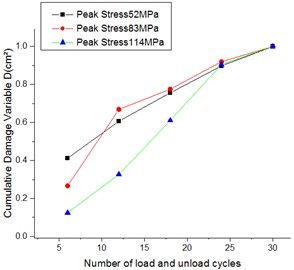
Fig. 5 shows the permeability evolution of rock specimens containing a grout curtain under cyclic loading-unloading at different peak stress levels. When the peak stress is low and cyclic loading-unloading disturbance is applied at the same stress level, the permeability increases relatively slowly and approximately linearly with increasing number of cycles. However, when the peak stress transitions from a lower stress level to the next higher stress level, the first loading-unloading cycle causes a significant increase in permeability. Subsequent cyclic loading-unloading at that same stress level has little effect on the permeability evolution. Overall, under a constant seepage pressure differential, permeability first increases, then decreases, and then increases again with increasing peak stress.
Fig. 5Permeability evolution of specimens with a grout curtain under cyclic loading-unloading
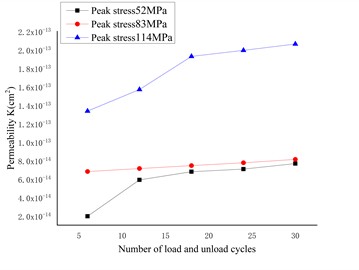
Fig. 6Permeability versus cumulative damage variable for specimens with a grout curtain at different peak stress levels
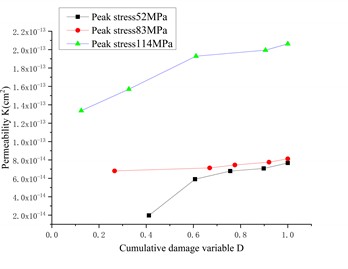
Fig. 6 shows the permeability versus cumulative damage variable curves for different peak stress levels. At a given peak stress level, cyclic loading-unloading of rock specimens containing a grout curtain leads to the initiation and propagation of microcracks, and permeability increases with increasing cumulative damage variable. At different peak stress levels, as the peak stress increases, the permeability of specimens containing a grout curtain exhibits an increase-decrease-increase trend with increasing cumulative damage variable. This suggests the existence of a critical peak stress threshold. When the stress level applied to the specimen containing a grout curtain is below this threshold, the rate of permeability change with respect to the cumulative damage variable is relatively slow. Conversely, when the applied stress level exceeds this threshold, the rate of permeability change significantly increases. Determining this peak stress threshold value requires additional experimental investigation. Due to the complexity and significant operational difficulties involved in this permeability-damage coupling test, conducting the three-stage graded cyclic loading-unloading was already challenging. Consequently, no further tests were conducted to determine this threshold value.
6.2. Effect of confining pressure on permeability-damage evolution in surrounding rock with a grout curtain
As shown in Fig. 7, the deviatoric stress-strain curves under cyclic loading-unloading at different confining pressures are presented. Under the same confining pressure level, the mechanical properties of rock specimens containing a grout curtain deteriorate during cyclic loading-unloading. That is, the deformation produced by the specimen gradually increases when subjected to the same stress magnitude. However, increasing the confining pressure and reapplying cyclic loading eliminated the mechanical degradation effect induced at the lower confining pressure.
Fig. 7Deviatoric stress-strain curves for specimens with a grout curtain under cyclic loading-unloading at different confining pressures
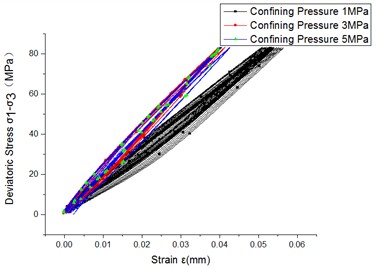
Fig. 8Cumulative damage variable versus number of cycles for specimens with a grout curtain under fatigue loading at different confining pressures
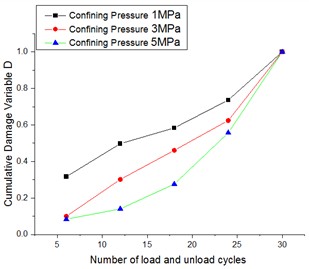
Fig. 8 shows the cumulative damage variable versus number of cycles at different confining pressures, illustrating the evolution of the cumulative damage variable under fatigue loading at varying confining pressures. When the confining pressure is relatively low, the first loading-unloading cycle significantly influences the damage in specimens containing a grout curtain. Subsequently, at the same peak stress level, the crack propagation rate in these specimens rapidly decreases to a slow development phase. When the specimen reaches the fatigue failure point under cyclic loading-unloading, the damage variable increases abruptly. At the same peak stress level but higher confining pressure, the initial cyclic loading-unloading disturbance has minimal effect on the damage variable. As the specimen approaches the fatigue failure point, the damage variable increases rapidly.
Fig. 9 shows the permeability versus number of cycles for specimens with a grout curtain under different confining pressures. At a confining pressure of 1 MPa, the permeability increases within the first 12 loading-unloading cycles. When the cycle number exceeds 12, the permeability first decreases and then increases. This behavior may be attributed to the following mechanisms: During initial cycling, microcracks gradually develop at the bonding interface between the clay-cement grout and the surrounding rock near the central hole, creating additional seepage paths that increase permeability. With further cycling, fatigue loading induces microcrack initiation and propagation within the surrounding rock, accompanied by mechanical degradation. This results in greater deformation under identical stress levels, causing compaction of the clay-cement grout that reduces permeability. Continued cycling intensifies mechanical degradation, leading to interconnected microcracks and debonding at the grout-rock interfaces, which subsequently increases permeability.
Higher confining pressures reduce the overall permeability of grouted specimens and promote compaction of initial fractures in the clay-cement grout. In engineering contexts, this phenomenon manifests as: deeper-buried grout curtains (experiencing higher confining pressures) exhibit slower permeability increases and lower susceptibility to permeability damage.
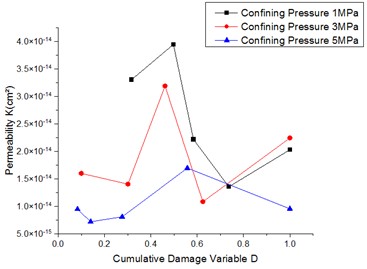
Fig. 10 shows permeability versus cumulative damage variable curves for grouted specimens under different confining pressures. Comparison of Fig. 9 and Fig. 10 reveals similar permeability evolution patterns at identical confining pressures, demonstrating that the cumulative damage variable effectively substitutes cycle number in characterizing permeability evolution under cyclic loading-unloading. Furthermore, Fig. 10 indicates that identical cumulative damage values are achieved with fewer cycles under low confining pressures compared to high pressures. This implies greater sensitivity and larger variation amplitudes in permeability response to damage accumulation at low confining pressures, whereas high confining pressures yield slower permeability changes and gradual damage development.
Fig. 9Permeability evolution of specimens with a grout curtain under different confining pressures
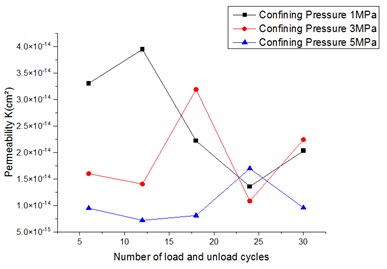
Fig. 10Permeability versus cumulative damage variable for specimens with a grout curtain at different confining pressures
6.3. Influence of seepage pressure differential on permeability-damage evolution in surrounding rock with a grout curtain
Fig. 11 shows the deviatoric stress-strain curves under cyclic loading-unloading. These curves demonstrate significant mechanical degradation in specimens containing a grout curtain during this test. The maximum strain method was therefore employed to characterize the cumulative damage variable under cyclic loading-unloading. Fig. 12 presents the cumulative damage variable versus number of cycles. As shown, the damage variable 0 for undisturbed specimens. During the first six loading-unloading cycles, damage development through microcrack initiation and propagation occurs rapidly. Subsequently, the rate of cumulative damage accumulation decreases progressively. Within a specific cycle range, the cumulative damage variable increases approximately linearly – a finding consistent with the experimental results shown earlier in Fig. 7.
Fig. 13 shows permeability versus number of cycles for grouted specimens under cyclic loading-unloading at different seepage pressure differentials. When the differential is low (< 0.3 MPa), the permeability curve exhibits significant fluctuations. As the differential increases (0.5-0.7 MPa), measured permeability decreases while test duration extends, yielding more accurate results due to stabilized flow conditions.
Fig. 11Deviatoric stress-strain curves for specimens with a grout curtain under cyclic loading-unloading
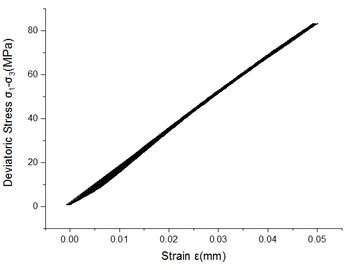
Fig. 12Cumulative damage variable versus number of cycles for specimens with a grout curtain
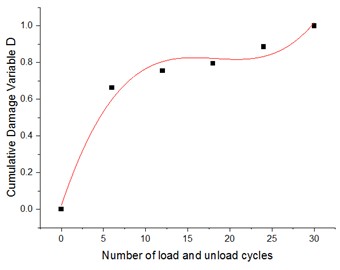
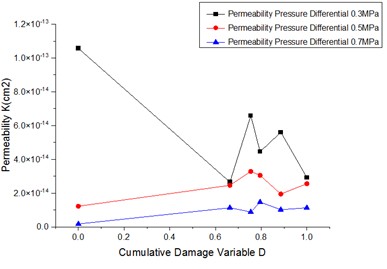
Fig. 14 presents permeability versus cumulative damage variable curves under cyclic loading-unloading at varied seepage pressure differentials. Tests with low differentials (0.3 MPa) show large permeability amplitudes and irregular damage-permeability relationships. This stems from the manual valve operation protocol: After applying equal water pressures to both specimen ends, differentials were created by sequentially 1) closing the upstream valve to establish hydraulic head, then 2) rapidly depressurizing and closing the downstream valve. The speed of the second valve closure critically controls differential magnitude – particularly at low pressures where human timing variability causes data scatter.
Higher differentials (≥ 0.5 MPa) significantly reduce measurement fluctuations. The 0.7 MPa differential proved optimal, providing: (1) Extended stabilization periods (> 120 s) for steady-state flow; (2) Minimal human operation interference; (3) High-quality pressure-time curves; (4) Accurate mid-test permeability calculations.
Fig. 13Permeability versus number of cycles for specimens with a grout curtain at different seepage pressure differentials
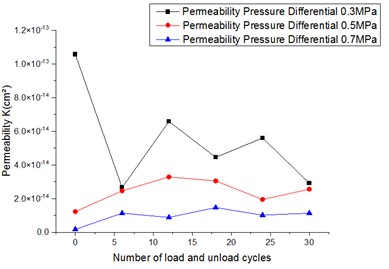
Fig. 14Permeability versus cumulative damage variable for specimens with a grout curtain at varied seepage pressure differentials
6.4. Permeability-damage characteristics of different grout curtain configurations
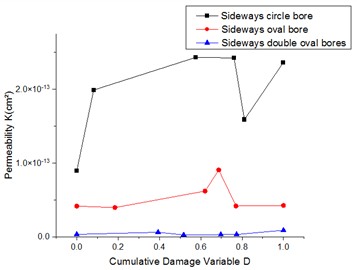
Test cases 4-6 investigated the water-blocking effectiveness of the three classified grout curtain configurations (Types II-A, II-B, and II-C, as defined in Section 2), which simulate karst cavities with increasing lateral flow path areas and grout filling ratios. Fig. 15 shows the cumulative damage variable versus number of cycles for specimens with different grout configurations under cyclic loading-unloading. Polynomial fitting revealed that damage accumulation follows a characteristic trend: across the three configuration types, as the grout filling ratio increases from Type II-A (0.9 %) to II-C (3.96 %), the damage evolution curve transitions from a near-linear to a distinct S-shape. This indicates that specimens with higher filling ratios (Type II-C) experience accelerated damage evolution during the initial loading cycles. This indicates that higher filling ratios accelerate damage evolution during initial loading cycles.
The permeability evolution for the three configuration types is presented in Fig. 16, which clearly quantifies the impact of defect geometry. The steady-state permeability decreases dramatically by two orders of magnitude across the series:
– Type II-A (Circular): 10⁻13 m/s.
– Type II-B (Elliptical): 10⁻14 m/s.
– Type II-C (Double-elliptical): 10⁻15 m/s.
This quantitative relationship demonstrates that increasing the lateral hole area (and thus the grout volume) is a highly effective strategy for reducing axial seepage. The reduction in axial permeability with increased lateral hole size can be attributed to three primary mechanisms: (1) enhanced lateral flow diversion, which redistributes the hydraulic head; (2) extended overall seepage paths; and (3) greater flow path tortuosity. These factors collectively increase the flow resistance and significantly degrade axial flow efficiency as the grout volume increases.
Fig. 15Cumulative damage variable versus number of cycles for different grout curtain configurations
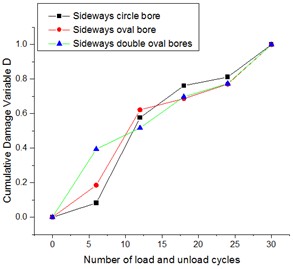
Fig. 16Permeability evolution versus number of cycles for different grout curtain configurations
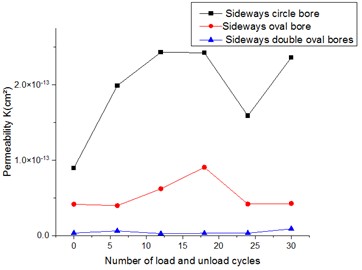
Fig. 17Permeability versus cumulative damage variable for different grout curtain configurations
As shown in Fig. 17, the permeability evolution with cumulative damage variable exhibits similar trends to its evolution with cycle number for rock specimens with different grout curtain configurations under cyclic loading-unloading. Permeability undergoes a three-stage evolution: initial increase, subsequent decrease, and final resurgence with increasing cycle number. Furthermore, specimens with higher mass filling ratios demonstrate extended crack compaction phases within the grout matrix.
6.5. Quantitative relationship between permeability and cumulative damage
To address the reviewer’s suggestion and enhance the quantitative rigor of the conclusions, the permeability () versus cumulative damage variable () data for different grout curtain configurations (Fig. 17) were fitted. The evolution follows a general trend that can be described by a piecewise or nonlinear function. For instance, the data for Type II-B specimens can be empirically approximated by the following relationship during the main damage accumulation phase:
where is the initial permeability, and , are fitting parameters. For Type II-B, , indicating an accelerating increase in permeability with damage. In contrast, Type II-C specimens exhibit a more complex trend with an extended plateau (low ), highlighting the prolonged crack compaction phase within the larger grout volume. This quantitative analysis confirms that not only the final permeability but also its evolution rate with damage is strongly governed by the initial defect geometry and grout filling ratio. The fitted relationships provide a basis for predictive modeling of grout curtain performance under cyclic loading.
7. Discussion and engineering implications
This experimental study bridges the gap between laboratory-scale observations and field-based concerns regarding grout curtain durability. The result that defect geometry dominates seepage behavior carries a direct practical implication: in a karstified rock mass, the effectiveness of a grout curtain depends less on reducing the permeability of the intact rock matrix, and more on how completely the grout fills and interconnects with the pre-existing cavity network. This conclusion aligns with studies on fracture-network conductivity, which also highlight the governing role of flow-path geometry.
From a design standpoint, the findings advocate for a “volumetric filling” strategy rather than merely “sealing” dominant flow paths. Increasing the grout take – simulated here by larger transverse holes – markedly reduces axial seepage, indicating that injection strategies should aim to maximize penetration and occupancy of lateral cavities, even if they are not aligned with the main flow direction. Moreover, the identified critical seepage-pressure difference (≥ 0.5 MPa) for reliable measurement provides guidance for designing in-situ monitoring systems, which must maintain sufficient hydraulic head to acquire accurate data on curtain performance.
The accelerated damage evolution under high peak-stress levels underscores the need for strength-based design in high-stress mining zones. Conversely, the mitigating effect of confining pressure offers inherent safety for deeper curtains. Together, these insights support a more performance-based and defect-aware approach to designing and assessing grout curtains under cyclic dynamic loading.
8. Conclusions
To investigate the impact of cumulative blasting effects on the water-sealing performance of grout curtains, cyclic loading-unloading tests were conducted on specimens containing simulated grout-filled defects. The influences of peak stress level, confining pressure, seepage pressure differential, and defect configuration were examined. Key findings are:
1) Peak stress level is the primary governing factor for damage development rate. Higher cyclic peak stresses accelerate both damage evolution and permeability increase.
2) Higher confining pressure mitigates damage, leading to slower permeability evolution. This implies better long-term performance for deeper-buried grout curtains.
3) A sufficient seepage pressure difference (≥ 0.5 MPa) is critical for measurement accuracy. Smaller differentials introduce significant variability due to manual operational limits.
4) Defect geometry overwhelmingly controls seepage behavior. Increasing the lateral hole area (and thus grout volume) is a highly effective strategy, reducing axial permeability by up to two orders of magnitude by creating tortuous lateral flow paths and enhancing flow diversion. Quantitative relationships between permeability and cumulative damage variable were established for different configurations.
This research establishes an experimental framework for probing permeability-damage evolution in grouted curtains and provides foundational insights for developing predictive models of their performance under repeated dynamic loading.
References
-
Y. Zhang, M. Huang, Y. Jiang, and Z. Wang, “Mechanics, damage and energy degradation of rock-concrete interfaces exposed to high temperature during cyclic shear,” Construction and Building Materials, Vol. 405, p. 133229, Nov. 2023, https://doi.org/10.1016/j.conbuildmat.2023.133229
-
S. Guo et al., “Investigation on directional rock fracture mechanism under instantaneous expansion from the perspective of damage mechanics: A 3-D simulation,” Simulation Modelling Practice and Theory, Vol. 137, p. 103013, Dec. 2024, https://doi.org/10.1016/j.simpat.2024.103013
-
Q. Zong, N. Lv, H. Wang, and J. Duan, “Numerical analysis on dynamic response and damage threshold characterization of deep rock mass under blasting excavation,” Frontiers in Materials, Vol. 11, p. 1329549, Jan. 2024, https://doi.org/10.3389/fmats.2024.1329549
-
Z. Li et al., “Study on cyclic blasting failure characteristics and cumulative damage evolution law of tunnel rock mass under initial in-situ stress,” Engineering Failure Analysis, Vol. 150, p. 107310, Aug. 2023, https://doi.org/10.1016/j.engfailanal.2023.107310
-
C. Yu, J. Wu, H. Li, Y. Ma, and C. Wang, “Study on the equivalence transformation between blasting vibration velocity and acceleration,” Sensors, Vol. 24, No. 6, p. 1727, Mar. 2024, https://doi.org/10.3390/s24061727
-
C. Wang, B. He, X. Hou, J. Li, and L. Liu, “Stress-energy mechanism for rock failure evolution based on damage mechanics in hard rock,” Rock Mechanics and Rock Engineering, Vol. 53, No. 3, pp. 1021–1037, Mar. 2019, https://doi.org/10.1007/s00603-019-01953-y
-
L.-H. Zeng, D.-B. Zhang, J.-H. Zhang, B. Zhang, and H.-D. Yin, “Macro-meso fracture evolution mechanism of hollow cylindrical granite with different hole diameters under conventional triaxial compression,” Journal of Central South University, Vol. 31, No. 9, pp. 3281–3294, Sep. 2024, https://doi.org/10.1007/s11771-024-5750-0
-
L. Liu, Z. Zhang, T. Wang, S. Zhi, and J. Wang, “Evolution characteristics of fracture volume and acoustic emission entropy of monzogranite under cyclic loading,” Geomechanics and Geophysics for Geo-Energy and Geo-Resources, Vol. 10, No. 1, p. 16, Dec. 2024, https://doi.org/10.1007/s40948-024-00737-1
-
Z. Chen, H. Liu, C. Zhu, S. Ma, Y. Hang, and W. Luo, “Seepage characteristics and influencing factors of weakly consolidated rocks in triaxial compression test under mining-induced stress path,” Minerals, Vol. 12, No. 12, p. 1536, Nov. 2022, https://doi.org/10.3390/min12121536
-
J. Jiang, C. Lin, Z. Cheng, and Y. Zuo, “Investigation of macroscopic and microscopic behavior of gravels using triaxial compression test with CT scan,” Journal of Testing and Evaluation, Vol. 47, No. 6, pp. 4364–4378, Nov. 2019, https://doi.org/10.1520/jte20180547
-
K. Peng, J. Zhou, Q. Zou, J. Zhang, and F. Wu, “Effects of stress lower limit during cyclic loading and unloading on deformation characteristics of sandstones,” Construction and Building Materials, Vol. 217, pp. 202–215, Aug. 2019, https://doi.org/10.1016/j.conbuildmat.2019.04.183
-
Z. Chen, Q. Zou, F. Lv, Q. Ran, X. Sun, and X. Heng, “Quantitative characterization of fracture surface undulations and gas-guiding patterns in fractured rocks under steady loading,” International Journal of Mining Science and Technology, Vol. 35, No. 10, pp. 1753–1773, Oct. 2025, https://doi.org/10.1016/j.ijmst.2025.08.017
-
Q. Zou et al., “Morphological evolution and flow conduction characteristics of fracture channels in fractured sandstone under cyclic loading and unloading,” International Journal of Mining Science and Technology, Vol. 33, No. 12, pp. 1527–1540, Dec. 2023, https://doi.org/10.1016/j.ijmst.2023.11.003
-
X. Su, J. Lai, E. Ma, J. Xu, J. Qiu, and W. Wang, “Failure mechanism analysis and treatment of tunnels built in karst fissure strata: A case study,” Engineering Failure Analysis, Vol. 167, p. 109048, Jan. 2025, https://doi.org/10.1016/j.engfailanal.2024.109048
-
W. Liu, Z. Qu, and P. Wang, “Study of rock damage behavior based on configurational mechanics,” Chemistry and Technology of Fuels and Oils, Vol. 58, No. 6, pp. 1011–1017, Jan. 2023, https://doi.org/10.1007/s10553-023-01483-y
-
H. Wang et al., “Experimental and theoretical model study on grouting reinforcement effect of fractured rock mass,” International Journal of Damage Mechanics, Vol. 34, No. 8, pp. 1279–1304, Nov. 2024, https://doi.org/10.1177/10567895241297699
-
X. Li, G. Si, S. Jiang, Y. Wang, S. Jiao, and Y. Wan, “Identify and formulate internal rock damage variable via acoustic emission (AE) and wave velocity measurement on rock materials – A review,” Case Studies in Construction Materials, Vol. 22, p. e04768, Jul. 2025, https://doi.org/10.1016/j.cscm.2025.e04768
-
Y. Wu, “Characteristics of rock damage variable under cyclic loading,” IOP Conference Series: Earth and Environmental Science, Vol. 651, No. 3, p. 032099, Feb. 2021, https://doi.org/10.1088/1755-1315/651/3/032099
-
Y. Chen, Y.-P. Wang, Y.-G. Yang, W.-K. Sun, and N.-K. Meng, “Damage mechanism and fracture evolution of rock containing defects with LCEM-GFEM method under explosive load,” Journal of Central South University, Vol. 31, No. 2, pp. 496–510, Feb. 2024, https://doi.org/10.1007/s11771-024-5582-y
About this article

The research is partly financially sponsored by Hunan Natural Scientific Foundation Zhuzhou Jointed Project (No. 2022JJ50087) and National Natural Science Foundation of China (No. 52174140).
The datasets generated during and/or analyzed during the current study are available from the corresponding author on reasonable request.
Fangcai Zhu: conceptualization, funding acquisition, project administration, writing-review and editing. Haijie Wen: methodology, investigation, formal analysis, data curation, writing-original draft. Zengjie Liu: resources, validation. Jiang Guo: supervision, writing-review and editing. Xuebin Xie: supervision, writing-review and editing.
The authors declare that they have no conflict of interest.
