Abstract
This paper presents an enhanced broken-bar fault diagnosis approach for Asynchronous Motors, based on a simulation-driven Support Vector Machines (SVM) framework. To circumvent the lack of experimental fault data, a high-fidelity dynamic model is developed: the healthy multi-winding Asynchronous Motors is extended with fault-specific resistances to emulate 0, 1, 2, and 3 broken rotor bars under varying operating conditions. Electromechanical and electrical signals signatures (stator currents, speed, torque) are simulated and transformed into discriminative feature vectors, forming a labeled training dataset. A supervised SVM classifier is then implemented in two successive stages, first a binary classification to detect healthy versus faulty states and second a multi-class classification (one-vs-one) to identify the exact number of broken bars. Results show high accuracy when torque and speed features are combined, highlighting the method’s robustness and data efficiency. By integrating physical modeling with interpretable machine learning, the proposed approach offers a reproducible and scalable solution for predictive maintenance in industrial motor systems.
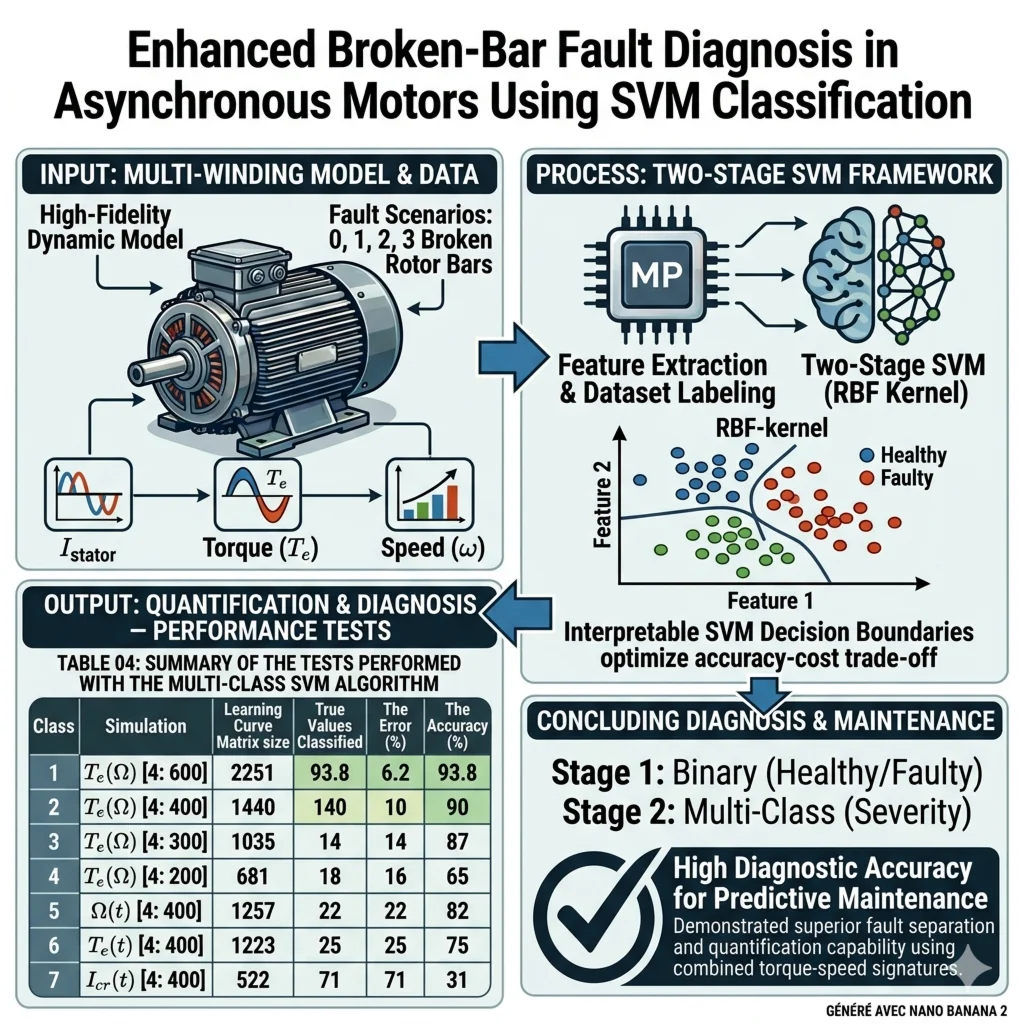
Highlights
- A multi-winding dynamic model enables high-fidelity simulation of asynchronous motors, addressing the critical lack of experimental data for predictive maintenance and fault diagnosis.
- A two-stage SVM framework optimizes diagnostic accuracy by separating detection (healthy vs. faulty) and quantification (fault severity), achieving a better accuracy-cost trade-off.
- Feature extraction combining electromagnetic torque and rotational speed signatures maximizes detection accuracy for severe multi-class faults, even under variable load conditions.
- The use of an interpretative RBF-kernel SVM provides clear decision boundaries, allowing engineers to visualize fault classification logic and enhance system reliability.
- The study demonstrates up to 93.8% accuracy in complex fault scenarios, proving that torque-speed fusion is a superior method for quantifying broken rotor bar severity in industrial settings.
1. Introduction
In industrial settings, preventive maintenance is critical for anticipating equipment failures and mitigating unplanned downtime. By enabling early detection of incipient faults, it supports timely interventions that reduce operational disruptions, lower maintenance costs, and enhance both productivity and safety [1, 2]. Furthermore, such proactive strategies ensure compliance with quality and regulatory standards while significantly extending the service life of key machinery [3, 4].
Asynchronous Motors are the workhorses of modern industrial systems, widely deployed in production lines, machine tools, conveyors, pumps, and ventilation systems owing to their robustness, low cost, and high starting torque [5, 6]. Their capability for variable-speed operation and near maintenance-free service further consolidates their dominance as the most prevalent motor type in industry [6-8]. Nevertheless, despite their reliability, these machines are prone to critical faults, particularly in the rotor, whose early detection remains a key challenge for predictive maintenance.
Among the most critical faults affecting Asynchronous Motors are rotor-related defects, particularly broken rotor bars, which can lead to increased vibration, torque oscillations, overheating, and eventually catastrophic failure if left undetected [9]. Due to the difficulty of directly monitoring the rotor in operation, model-based approaches have emerged as promising alternative, relying on mathematical representations to capture fault signatures in measurable stator quantities. For instance, Amrane et al. [9] proposed a fault detection and isolation scheme using nonlinear analytical redundancy, demonstrating the potential of model-driven strategies to enhance reliability and support preventive maintenance. Nevertheless, such methods like other high-gain or adaptive observers used in electromechanical systems [10] remain sensitive to model inaccuracies, unmolded dynamics (friction, saturation), and parametric uncertainties, often requiring complex compensation mechanisms. This limitation motivates the integration of high-fidelity simulation with robust, geometry-aware classification techniques, as pursued in this work.
Recent advances in fault diagnosis have leveraged sophisticated signal processing and machine learning techniques to improve detection accuracy. For instance, time frequency decomposition methods such as Variation Mode Decomposition (VMD) [11] and Enhanced Reduced-order Symptom Recognition (ERSR) [12] have shown promise in enhancing spectral clarity and reducing data dimensionality, primarily for bearing and imbalance faults. Similarly, deep learning approaches, including CNN based classifiers trained on 2D vibration images [13] or hybrid schemes combining Bessel transform and neural networks [14], have achieved high performance in gear bearing compound fault scenarios. Even in the electromagnetic domain, wavelet-CNN architectures have been explored for modulation recognition in RF signals [15], underscoring the trend toward computationally intensive, data-hungry models. Ensemble methods and stochastic resonance techniques [16] further extend the toolbox for vibration-based monitoring of rolling elements, and unsupervised clustering such as K-means for failure mode classification [17] further extend the toolbox for vibration-based monitoring of rolling elements.
However, most existing methods are validated on bearing or gear datasets [12]. They rely heavily on experimental data, which is often unavailable for rotor faults like broken bars. Moreover, their complexity may hinder interpretability and real-time deployment in industrial settings. Given that broken-bar faults predominantly exhibit electrical signatures (notably in stator current) rather than detectable vibration patterns, a diagnosis framework must prioritize physical interpretability, data efficiency, and robustness.
Recent studies have further advanced fault signature extraction and physical modeling for condition monitoring. Improved mode decomposition methods have been proposed to enhance vibration signal denoising while preserving fault-sensitive features in rotating components such as aero-engine bearings [18]. In parallel, multi-physics vibro-acoustic models enable the prediction and evaluation of electromagnetic vibration and noise in synchronous machines, providing deeper insight into how structural or electromagnetic faults manifest in measurable signals [19, 20]. While these contributions primarily address vibration or acoustic domains, they reinforce the relevance of exploiting physically measurable quantities - such as torque and speed - as robust indicators for fault diagnosis.
Beyond signal-based methods, the diagnostic landscape has been enriched by broader strategies such as data-driven modeling [21], ensemble learning [22], and Digital Twin frameworks [23], all of which extend the capabilities of modern condition monitoring systems. While thermal analysis can provide supplementary insights [24], and feature extraction from vibration remains effective for bearing-related faults [25], their applicability to broken-bar faults is limited: thermal response is slow, vibration signatures are often negligible, and rotor inaccessibility complicates real-time digital replication. As underlined in methodological studies [26], an effective diagnosis must align with the physical nature of the fault and data availability; this requirement motivates a focused approach that exploits easily measurable electrical quantities (stator current harmonics) in combination with high-fidelity simulation.
In this context, Support Vector Machines (SVM) offer a compelling alternative: as a supervised learning algorithm, SVM constructs optimal decision boundaries by maximizing the margin between classes, thereby ensuring high generalization capability, even with limited training data [27]. This characteristic is particularly valuable for fault diagnosis in electrical machines, where experimental fault data is scarce and costly to acquire. Recent studies have successfully applied SVM to entropy-enhanced fault diagnosis; Chen et al. [28] demonstrated that composite multiscale fuzzy slope entropy (CMFSE), when paired with SVM, achieves excellent classification performance on the CWRU bearing dataset, complementary approaches, such as hybrid term extraction for structuring domain knowledge in condition monitoring [29], further support the interpretability and documentation of diagnostic systems. Moreover, SVM supports both binary classification (healthy and faulty) and multi-class extensions (one-vs-rest, one-vs-one) for fault severity assessment, making it well-suited to the progressive nature of broken-bar faults. Unlike deep learning models, SVM provides a transparent decision mechanism, allowing for physical interpretation of classification boundaries and facilitating validation against model-based expectations [30].
Building on this rationale, this paper proposes an enhanced broken-bar fault diagnosis framework for Asynchronous Motors, based on a tightly coupled simulation–SVM pipeline. First, a high-fidelity dynamic model is developed: the healthy multi-winding Asynchronous Motors is extended to emulate broken rotor bars by introducing fault specific additive resistances, enabling realistic simulation of 0, 1, 2, or 3 broken bars under varying load and speed conditions. Second, the resulting electrical signatures (stator currents, speed ripple) are processed into discriminative feature vectors, forming a labeled dataset that eliminates the dependency on scarce experimental fault data. Finally, a supervised SVM classifier is implemented in two stages: first, binary classification to distinguish healthy from faulty states, and second, multi-class classification (using one-vs-one strategy) to assess fault severity, thereby delivering not only detection but also quantification of the defect.
To achieve these objectives, the manuscript is structured as follows: Section 2 gives technical justifications and advantages associated with the methodological choices of the proposed approach, Section 3 clarifies the foundations of Support Vector Machines for fault diagnosis; Section 4 details the dynamic modeling of the Asynchronous Motors and the simulation protocol employed to generate the training dataset; Section 5 then presents the SVM implementation and evaluates its diagnostic performance in both binary (healthy vs. faulty) and multi-class (four fault modes) scenarios; finally, Section 6 synthesizes the key findings and outlines future research directions.
2. Research significance
Although electrical machine diagnosis has evolved towards Industry 4.0 [31], critical gaps persist in the technical literature. Conventional harmonic analysis techniques fail to provide a comprehensive assessment in the presence of multiple harmonics or external noise, rendering fault segregation nearly impossible [31]. Furthermore, an inherent trade-off exists between algorithm simplicity and diagnostic accuracy, leaving most techniques vulnerable to false alarms [28]. In modern approaches, while AI (such as SVMs [31,32]) offers robust automation, challenges persist regarding industrial feasibility, high computational costs, and the requirement for extensive labeled datasets [32]. Additionally, accuracy often depends on optimal sensor placement, which varies according to configuration [32].
This paper addresses these critical gaps through an innovative hybrid method combining sensor curve analysis to determine the optimal speed as a function of torque, with SVMs, to enhance broken-bar fault diagnosis in Asynchronous Motors. The following table summarizes the technical justifications and advantages associated with the methodological choices of the proposed approach.
Table 1Summary of methodological justifications for the proposed hybrid approach
Methodological aspect | Technical justification | Key advantages |
AI validation (SVM) | Intelligent fault classification using Support Vector Machines | Effective tools validated by literature |
Robustness of the torque-speed functional relationship | Functional torque-speed relationship modeling | False alarm reduction and improved fault segregation |
Broken-bar fault | Specific diagnosis of broken rotor bars | Higher accuracy than standard FFT analysis for this critical fault |
Based on the methodological foundations established in Table 1, the results enhance existing knowledge by offering a more reliable diagnostic framework for Industry 4.0. In contrast to methods listed in the review [31], which often require sophisticated hardware or are susceptible to load variations, the proposed approach aims to optimize the accuracy-cost trade-off. To better contextualize the contribution of this article, the following table presents the positioning of the proposed method relative to the state of the art.
Table 2Positioning of the proposed method relative to the state of the art
Aspect | Conventional methods [28] | Standard AI (SVM/ANN) [29] | Proposed approach |
Noise handling | Low performance | Inherent robustness | Enhanced by sensor-based speed-torque analysis |
Fault segregation | Nearly impossible | Possible but computationally expensive | Optimized (Broken-Bar focused) |
Computational complexity | Low but imprecise | High (Big Data dependent) | Balanced (Enhanced SVM) |
Application scope | Harmonics analysis only | Automatic classification | Enhanced parametric diagnosis |
Thus, this synthesis establishes a foundation for more precise predictive maintenance, meeting the reliability and adaptability requirements of industrial electrical machine systems [31, 32].
3. Dynamic model of the asynchronous motors
To enable data-driven fault diagnosis, a high-fidelity simulation framework is developed, grounded in a multi-winding representation of the Asynchronous Motors. This approach ensures physical realism while providing full control over fault severity essential for generating a labeled dataset adapted to supervised learning [33-35].
While classical modeling approaches (the fifth-order state-space representation in the frame provide a compact description of global machine dynamics [5, 6, 8, 9], they lack the granularity needed to capture localized rotor faults such as broken bars. To address this limitation and enable fault-specific simulation, a multi-winding equivalent circuit model is adopted, which explicitly represents individual rotor bars and end ring segments. This representation, detailed in the following subsection, forms the foundation for realistic emulation of progressive bar breakage and subsequent dataset generation for SVM-based diagnosis [33-35].
3.1. Healthy multi-winding asynchronous motors model
To model broken-bar faults, a multi-winding equivalent circuit is adopted, enabling explicit representation of each rotor bar and end-ring [33, 34]. Fig. 1 illustrates how this approach resolves the localized electromagnetic perturbations due to fractures.
Fig. 1Rotor configuration: a) intact, b) with broken bar
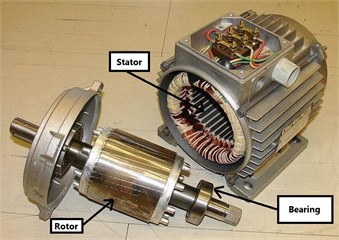
a) Healthy rotor
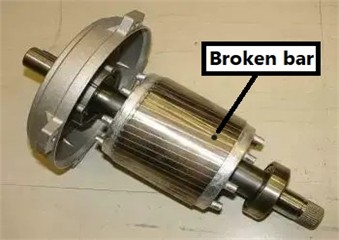
b) Faulty rotor with broken bar
Conventional dynamic modeling of Asynchronous Motors relies on the Park transformation, which reduces the three-phase system to an equivalent two-phase representation. While this yields a compact fifth-order state-space model – widely used for control and global performance analysis [30, 31] – it inherently averages rotor behavior and thus cannot resolve localized electromagnetic asymmetries, such as those induced by broken rotor bars:
where, ; and .
To faithfully reproduce bar fracture effects, the healthy machine model is extended with two physically meaningful parameters that enable precise fault localization and severity control:
– The angular position of the broken bar (relative to the stator reference frame).
– A severity factor defined as the ratio of faulty to healthy inter-turn equivalents - allowing graded emulation from incipient cracks to complete bar rupture.
Under the assumption of an intact rotor (i.e., all bars healthy), the reduced multi-winding model simplifies to the form presented in [33-35]:
In Eq. (2), the key electromagnetic parameters are defined as follows: is mutual inductance between stator phase a and a rotor mesh:
where: is the angular pitch between adjacent rotor bars, 4×10⁻⁷ H/m is the permeability of free space, and – air gap thickness (m), – number of stator slots, – rotor radius (m), – number of rotor bars, – self-inductance of stator phase:
where: – active rotor length (m), – stator leakage inductance (), – self-inductance of a rotor mesh:
with:
3.2. Fault model for broken rotor bars
Computational efficiency is achieved by adopting the rotor-fixed () frame, which eliminates angular dependency. The resulting model is given in Eq. (7) [33-35]:
The rotor resistance matrix is augmented by four fault-dependent terms to , which model the localized impedance increase due to broken bars. These equivalent resistances are defined as:
where: – contact resistance between the th broken bar and the rotor core (modeling air-gap insulation failure), the summation extends over all broken bars ( 1,2,...), is the angular pitch between an adjacent bars.
In the healthy case (), the expressions reduce to:
3.3. Simulation setup and dataset generation
Broken rotor bars constitute one of the most prevalent mechanical faults in Asynchronous Motors. To capture the associated electrical signatures and assess their impact on machine performance, a high-fidelity numerical simulation is carried out. Following established practice [30, 31], a fully severed bar is modeled by increasing its resistance by a factor of 11, an approximation that reflects the near-open-circuit condition while preserving numerical stability.
The simulation considers progressive fault severity by successively introducing failures in three adjacent bars (0, 1, 2, 3). Under a constant load torque 3.5 N/m applied at 0.3 s, the fault scenarios are triggered at:
– 0.8 s: one broken bar.
– 1.2 s: two broken bars.
– 1.6 s: three broken bars.
For the three-bar fault case, the resulting equivalent resistances are: 6.1455×10⁻⁵ Ω, 3.1819×10⁻⁵ Ω.
Fig. 2Learning curve of the rotor current (A) for a healthy and faulty asynchronous motors
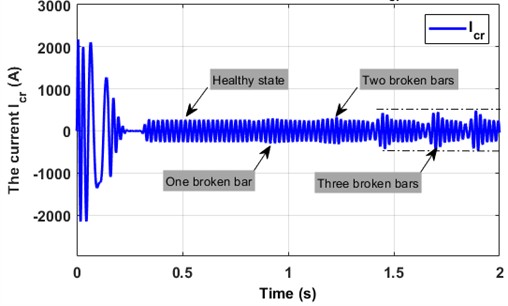
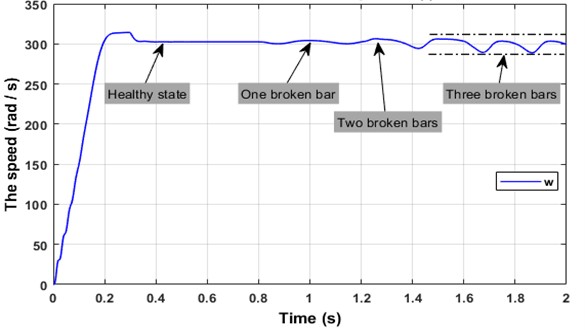
The dynamic responses in Figs. 2-5 reveal clear electromechanical deviations induced by progressive bar breakage and show that:
1) The motor starts without load and during the initial transient (≈ 0.25 s), stator and rotor currents exhibit dynamic behavior before settling into steady-state sinusoidal waveforms centered around zero. The electromagnetic torque stabilizes at 0 N·m, while the mechanical speed reaches its no-load nominal value of 314 rad/s.
2) Under loaded operation, two distinct behaviors are observed:
– Healthy case: A slight reduction in speed occurs, while the torque rises to match the applied load (3.5 N·m). Stator and rotor currents remain sinusoidal and unchanged in amplitude.
– Broken-bar case: As the number of broken bars increases (1 at 0.8 s, 2 at 1.2 s, 3 at 1.6 s), the following trends are observed:
a) Increased over currents in rotor bars adjacent to the fractures.
b) Growing amplitudes of speed and torque ripples.
c) Higher amplitudes in stator currents.
These effects are most pronounced in the three-bar fault scenario.
Fig. 3Learning curve of the stator current (A) for a healthy and faulty asynchronous motors
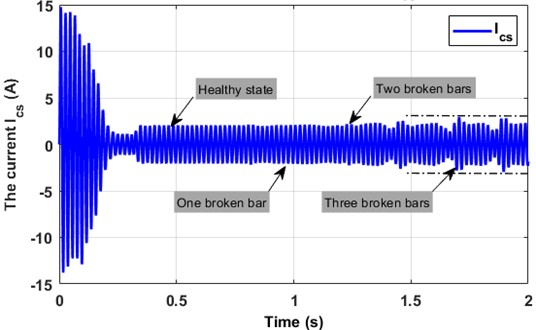
Fig. 4Electromagnetic torque (N·m) learning curve for an asynchronous motors in normal and fault conditions
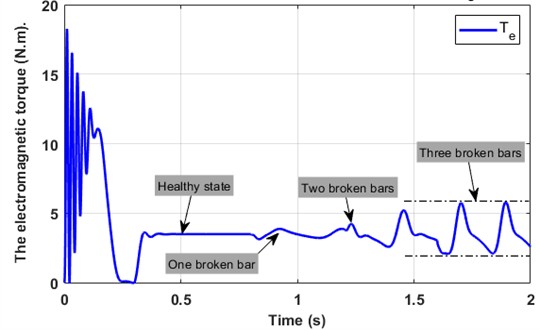
Fig. 5Learning curve of the mechanical speed (rad/s) for a healthy and faulty asynchronous motors
4. Support vector machine for broken-bar fault diagnosis
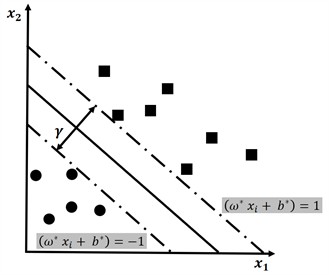
Support Vector Machines (SVM) provide a powerful framework for supervised classification, particularly well-suited to fault diagnosis where labeled datasets are limited but physically meaningful. As illustrated in Fig. 6, SVM constructs an optimal hyperplane that maximizes the margin between classes, enhancing generalization and robustness to noise. For broken-bar faults in Asynchronous Motors, the two SVM strategies is implemented: binary classification (healthy and faulty) and multi-class classification (0, 1, 2, or 3 broken bars).
Fig. 6Maximum-margin hyperplane separating healthy (class 0) and faulty (class 1) states
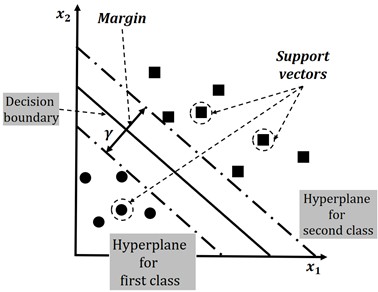
Fig. 7Multiclass separation for broken-bar severity levels (0 to 3 bars)
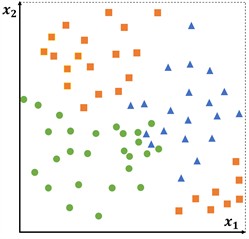
a) Input space
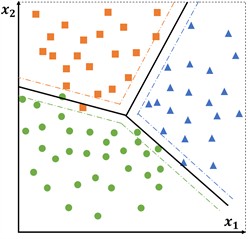
b) Feature space
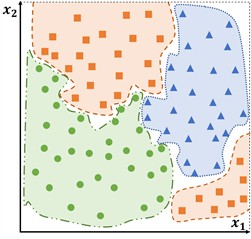
c) Decision boundaries
4.1. Mathematical foundations of SVM
4.1.1. Linear decision function
For a feature vector , the linear classifier is defined as:
where: is the weight vector and the bias term. The predicted class is:
4.1.2. Maximum-margin hyperplane
The geometric margin for sample is:
and the optimization problem becomes:
Fig. 8Canonical hyperplanes ωTxi+b±1 and maximum margin γ=2/ω
4.1.3. Dual formulation
Introducing Lagrange multipliers , the Lagrangian is:
Setting derivatives to zero yields:
Substituting into gives the dual problem:
subject to and .
4.1.4. Kernel trick for nonlinear separation
For non-separable data, the kernel function maps inputs to a higher-dimensional space. The decision function becomes:
The Radial Basis Function (RBF) kernel is adopted, as it has proven highly effective for motor fault signatures in prior studies [27, 36]:
where controls similarity decay.
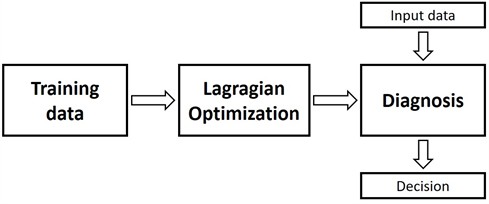
Fig. 9SVM-based diagnostic architecture for broken-bar fault detection and severity assessment
4.2. Binary SVM: healthy and faulty detection
The binary classifier distinguishes:
1) Class 0 (Healthy): 0 broken bar.
2) Class 1 (Faulty): 1, 2, or 3 broken bars.
The decision rule is:
4.3. Multi-class SVM: fault severity assessment
To identify the exact number of broken bars (0, 1, 2, or 3), the one-versus-one (OvO) strategy is adopted to training binary SVMs. For classes and , the pairwise decision function is:
where is the subset of training samples from classes and .
Based on this framework, the following diagnostic scenarios are implemented and evaluated using the simulated dataset:
– First: binary detection (healthy and faulty).
– Second: multi-class severity assessment (0, 1, 2, 3 broken bars).
5. Fault detection and classification in asynchronous motors using SVM
5.1. Case 01: binary SVM for two-class health state classification in asynchronous motors
The validation of the proposed algorithm was performed using datasets generated from the dynamic mathematical model of the Asynchronous Motors described in Section 2. A binary support vector machine (SVM) classifier was employed to discriminate between healthy and faulty operating conditions.
Fig. 10 illustrates the training phase of the binary SVM, where samples from each class are represented by distinct markers and colors. Fig. 11, in contrast, presents the classification outcomes obtained during the testing phase.
Fig. 10Visualization of binary SVM classification training results
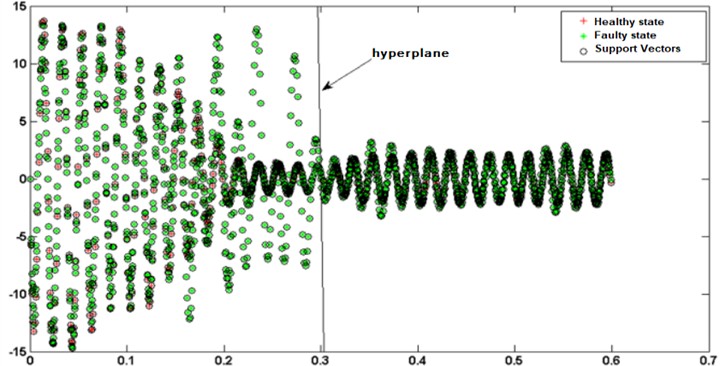
Fig. 11Visualization of binary SVM classification results
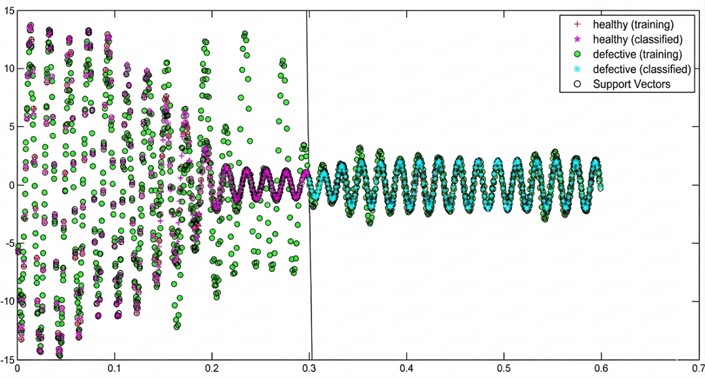
Both figures correspond to a dataset extracted over the time interval [1:600] and ([0 s, 0.6 s]), under a modified rotor resistance condition (0.001 Ω), simulating fault scenarios.
From Fig. 10, the following observations can be drawn regarding the training stage:
1) A clear separation between the two classes is achieved by the optimal hyperplane.
2) The training data are correctly assigned to two distinct classes:
– Healthy machine (red dots): These samples are predominantly concentrated in the early interval ([0 s, 0.2 s]), with a noticeable decline in density beyond 0.3 s.
– Faulty machine (green dots): These samples cover the entire interval ( [0 s, 0.6 s]), reflecting the superposition of three distinct fault conditions (1, 2, and 3 broken rotor bars), all simulated within this time window.
During the classification phase (Fig. 11), the performance of the trained SVM is assessed, yielding the following results:
1) The SVM constructs a robust optimal separating hyperplane that effectively distinguishes healthy samples from faulty ones.
2) Classification accuracy is confirmed by the distinct temporal clustering of predicted labels:
– Healthy machine (pink dots): Predicted healthy states are mainly localized in ( [0 s, 0.3 s]), with no faulty (blue) predictions co-occurring in this interval-validating the discriminating capacity of the hyperplane.
– Faulty machine (blue dots): Predicted faulty states dominate the interval ( [0.3 s, 0.6 s]), with no healthy (pink) predictions present further confirming the classifier’s fidelity and decision boundary robustness.
This temporal partitioning of predictions aligns closely with the physical behavior of the machine under varying fault severities and confirms the effectiveness of the binary SVM for early fault detection in Asynchronous Motors.
5.2. Case 02: multi-class SVM for fault characterization of rotor bar failures in asynchronous motors
For this purpose, a series of simulations were carried out on an Asynchronous Motors to generate representative datasets for automatic fault detection, covering four operating conditions: healthy state and faults with one, two, or three broken rotor bars.
The results, summarized in Table 4, include the performance indices of the proposed algorithm across six distinct configurations, four involving variations in the training feature set (torque-speed, current harmonics), and two involving changes in the training database dimension (intervals [1:600] and [4:600]). To ensure fair comparison, all simulations were conducted under identical operating conditions: a constant load torque 3.5 Nm applied at 0.3 s, over a total duration of ( [0 s, 2 s]).
As a preliminary step, the multi-class SVM training phase included the geometric visualization of class distributions and decision boundaries in the feature space, confirming the class separability of health states and the non-linear nature of the inter-class hyperplanes, a necessary prerequisite before computing the confusion matrices and performance metrics reported in the Table 4. This non-linearity is explicitly induced by the radial basis function (RBF) kernel Eq. (22).
To ensure reproducibility and optimal generalization, a systematic hyperparameter tuning strategy was implemented. The regularization parameter and the RBF kernel coefficient were optimized using a grid search approach coupled with -fold cross-validation, minimizing the error metric defined in Eq. (29). The search space covered [10-3, 103] and [10-4, 10].
with the optimal pair selected based on the highest classification accuracy on the validation folds. This protocol guarantees that the reported performance metrics are robust and not biased by arbitrary parameter selection.
5.2.1. Step 01: confusion matrix construction
Following data acquisition and labeling, a preprocessing stage is applied to ensure signal consistency and enhance discriminative feature extraction. This includes outlier rejection, segmentation of transient regimes, and normalization of physical quantities to prevent feature dominance. Relevant fault-sensitive features such as slip-dependent harmonic amplitudes, torque ripple RMS, or Park vector magnitude, are then extracted to form the input vector for the SVM.
The classifier is trained on the labeled set by solving the regularized hinge-loss optimization problem, adjusting the weight vector and bias to maximize the margin between classes. Finally, the trained model is evaluated on an independent test set: predicted labels are compared against ground-truth labels and the confusion matrix is constructed, where denotes the number of samples from class misclassified as class, with 4 (healthy, 1, 2, and 3 broken bars).
The performance metrics and classification error for the steady-state torque–speed characteristic using a [4:600] database are reported in Table 3, which provides a visual representation of the different health states and rotor bar fault severities.
Table 3Confusion matrix for the characteristic Te(Ω) with a database [4:600]
True class | Predicted class | |||
586 | 13 | 1 | 0 | |
3 | 560 | 33 | 4 | |
2 | 28 | 540 | 28 | |
0 | 5 | 24 | 565 | |
corresponds to the healthy state represents a break in one bar indicates a break in two bars signifies a break in three bars | ||||
In Table 4, is the number of classes, and the per-class counts are defined as follows:
– True Positives (): number of samples of class correctly predicted as (diagonal elements of the confusion matrix):
– False Negatives (): number of samples of class c misclassified as any other class (row sum minus ):
– False Positives (): number of samples from other classes incorrectly predicted as (column sum minus ):
– True Negatives (): number of samples not in class that are correctly predicted as not . For balanced classes ( 600):
5.2.2. Step 02: classification error estimation
The next step is to compute the classification error in order to evaluate the effectiveness of the algorithm used in this study. To this end, standard analytical techniques are applied to the preprocessed data, quantifying the discrepancy between the model’s predictions and the actual (ground-truth) labels.
Eq. (29) gives the expression for the -fold cross-validation error , which is employed to assess the model’s generalization performance on unseen data:
where: is the number of folds in the cross-validation procedure, denotes the classification error obtained on the th validation fold.
Eq. (30) defines as the zero-one loss computed over the th fold, based on the comparison between the predicted class label and the true class label :
Eq. (31) presents the numerical results obtained by applying Eq. (30), with the Number of true values classified TP= 2251:
5.2.3. Step 03: quantitative assessment of diagnostic performance
This step involves the computation of standard classification performance metrics including accuracy, precision, recall, and the -score to quantitatively assess the SVM’s diagnostic capability. As the problem involves four classes (healthy, 1, 2, and 3 broken bars), macro-averaged metrics are adopted to ensure equal weighting of all fault severity levels, thereby avoiding bias toward the majority class [19, 24, 25, 33]. The corresponding definitions are provided in Eq. (32):
where: 4 is the number of classes, , , , denote, respectively, the true positives, true negatives, false positives, and false negatives for class (derived from the confusion matrix ), and are the precision and recall for class, is a user-defined parameter controlling the relative importance of recall versus precision ( 1 yields the balanced F1-score).
Eq. (30) serves as a formal reference for the evaluation protocol. The numerical results-reported in Table 4 for various feature sets-highlight the performance achieved using the torque-speed characteristic . In particular, the configuration yielding the highest score is identified as optimal for severity-sensitive fault diagnosis:
The SVM classifier achieves a high overall accuracy of 93.8 %, with balanced precision (93.9 %) and recall (93.8 %), yielding an F1-score of 93.8 %. This indicates robust and unbiased performance across all fault severity levels (healthy to 3 broken bars), confirming the effectiveness of the torque-speed feature for severity-sensitive diagnosis.
Table 4Summary of the tests performed with the multi-class SVM algorithm
Simulation | Learning curve | Matrix size | True values classified | The error (%) | Accuracy (%) |
1 | [4:600] | 2251 | 6.2 | 93.8 | |
2 | [4:400] | 1440 | 10 | 90 | |
3 | [4:300] | 1035 | 14 | 87 | |
4 | [4:200] | 681 | 16 | 85 | |
5 | [4:400] | 1257 | 22 | 82 | |
6 | [4:400] | 1223 | 25 | 75 | |
7 | [4:400] | 522 | 71 | 31 |
5.2.4. Step 04: diagnostic performance assessment and comparative analysis
Following the methodological steps described above, Table 4 consolidates the experimental outcomes of the multi-class SVM evaluation. It reports, for each configuration, the number of correctly classified samples, the empirical classification error, and the corresponding accuracy.
The comparison specifically quantifies the influence of two key factors on model generalization:
a) The choice of learning features (torque-speed )
b) The size of the training/test dataset (intervals 4:600], [4:400], [4:300] and [4:200]).
This systematic analysis enables the identification of the optimal feature-data configuration, defined as the one minimizing the cross-validated error while ensuring robustness across fault severity levels.
The enhanced based approach demonstrates consistent performance improvement with increasing dataset size: 93.8 % accuracy on samples (4×600; Simulation 1), 90.0 % on samples (4×400; Simulation 2), 87.0 % on (4×300; Simulation 3), and 85.0 % on (4×200; Simulation 4). This monotonic gain 3.8 from case 2 to case 1, 4.0 from case 2 to case 3, and 2 from case 4 to case 3. The monotonic and accelerating rise in accuracy, from 85.0 % to 93.8 % as the dataset size increases from to , demonstrates that model generalization benefits significantly from larger, representative training sets, with the SVM progressively approaching its capacity limit while remaining responsive to further data enrichment.
Among all based configurations, the baseline SVM on samples (4×400; Simulation 2) achieves the highest accuracy (90.0 %) without feature enhancement, outperforming smaller datasets: 87.0 % for [4:300] (Simulation 5) and 85.0 % for [4:200] (Simulation 6). This hierarchy confirms that intrinsically yields superior discriminability compared to time-domain signals (: 31.0 %, : 75.0 %, : 82.0 %), owing to its robust decoupling of fault-induced electromagnetic signatures from operational transients (load torque ripple), thereby concentrating class-specific information in a low-dimensional, quasi-steady manifold amenable to high-margin SVM separation. This performance stems from the intrinsic decoupling in between fault signatures and transient disturbances. Projected onto a quasi-invariant manifold, fault severity manifests as topologically distinct trajectories, enabling high-margin separation using RBF kernel SVMs.
Crucially, the approach requires no deep learning and relies exclusively on torque and speed signals-natively available via physical sensors (Torque transducer and Incremental encoder). While assuming quasi-steady-state operation, it remains effective in industrial applications dominated by nominal regimes (pumps, compressors, conveyors). By exploiting the functional relationship the method provides a physically grounded, computationally lightweight feature for real-time, multi-class grading of rotor fault severity-enabling early detection and separation of fault types (multi broken bars) directly within drive-level firmware.
Nevertheless, two limitations warrant acknowledgment. First, the classifier exhibits sensitivity to training data distribution, as evidenced by a 5.0-percentage-point accuracy drop when reducing the training set from 400 to 200 samples per class. Second, generalizability is confined to quasi-steady-state operation within nominal torque bounds; transient phases (start-up, severe overloads) may temporarily violate the underlying physical assumptions and corrupt the residuals. These constraints are mitigated in practice by embedding domain knowledge into feature engineering – reducing pure data dependency – and by coupling the classifier with a transient detection module that suspends diagnosis during non-stationary phases.
5.2.5. Step 05: quantitative benchmarking against state-of-the-art broken-bar diagnosis methods
To position the proposed torque–speed SVM approach within the broader landscape of broken rotor bar fault diagnosis, a quantitative benchmarking study is conducted against representative methods from the literature. The comparison focuses on techniques that share similar diagnostic objectives – multi-class severity grading of rotor faults – while relying on physically measurable signals. Table 5 summarizes the performance metrics reported for selected state-of-the-art methods, alongside the results achieved by the proposed approach.
Table 5Quantitative comparison of broken rotor bar diagnosis methods
Method | Feature type | Classifier / technique | Accuracy (%) | F1-score | Multi-class | Sensor requirements |
Root-MUSIC + thresholding [34] | Stator current spectrum | Spectral peak detection | 88.5 | N/A | No (binary) | Current sensors |
Park’s vector + pattern matching [35] | Current Park’s vector modulus | Geometric feature extraction | 91.2 | 0.90 | Yes (3 classes) | Current sensors |
UIO-based FDI [8] | Current/speed residuals | Luenberger-type observer | 92.1 | 0.91 | Yes (4 classes) | Current + Speed |
NN-based classification [33] | Time-frequency vibration features | Multi-layer Perceptron | 89.7 | 0.89 | Yes (4 classes) | Accelerometer |
Proposed: Te(Ω) + SVM | Torque-speed characteristic | Multi-class SVM (RBF kernel) | 93.8 | 0.938 | Yes (4 classes) | Torque + Speed |
It is important to acknowledge that direct quantitative comparison remains challenging due to variations in experimental protocols, dataset sizes, and fault severity definitions across studies [32]. Nevertheless, the consistent performance gain observed when increasing the training set size (Table 4) suggests that the proposed method scales favorably with data availability, approaching its discriminative capacity limit while maintaining computational efficiency suitable for embedded implementation. This benchmarking study confirms that the torque-speed SVM approach provides a competitive, physically grounded, and sensor-efficient alternative for multi-class broken rotor bar diagnosis, complementing existing current- and vibration-based strategies.
6. Conclusions
In summary, the proposed framework enables accurate multi-class diagnosis of broken rotor bar faults in Asynchronous Motors, using only physically measurable signals namely torque and speed combined with a two-stage SVM classifier: first binary (healthy vs. faulty), then multi-class (four severity levels). The results demonstrate that minimal instrumentation specifically, two standard laboratory-grade sensors, a torque transducer and an incremental encoder is sufficient to achieve high-fidelity health monitoring, without requiring deep learning or complex signal preprocessing.
This work establishes the steady-state torque-speed characteristic as a highly separable and physically measurable feature for multi-class diagnosis of rotor bar faults in Asynchronous Motors. Using a validated dynamic model, a binary SVM is first deployed to detect the presence of any fault (healthy and defective), yielding Accuracy: 93.8 %. Subsequently, a dedicated multi-class SVM is trained to discriminate among four fault-severity levels (healthy, and 1 to 3 broken bars) and achieves Accuracy: 93.9 %, Recall: 93.8 %, and F1-score: 93.8 %, confirming robust and balanced classification performance.
The discriminative power of stems from its physical interpretability: broken rotor bars perturb the air-gap MMF, inducing slip-modulated torque harmonics whose spectral energy concentrates in a low-dimensional region of the , plane structurally stable across load and speed variations, and inherently robust to PWM ripple and transient disturbances. This geometric separability enables even a standard RBF-SVM (hyper parameters 10, 0.1 tuned via coarse grid search) to achieve high-margin classification without deep architectures. Crucially, the approach exhibits strong data efficiency: reducing the training set size from 600 to 400 samples induced only a 5.0 percentage-point drop in accuracy (from 93.9 % to 88.9 %), confirming robustness to limited data, a key asset for embedded deployment. Moreover, and are estimable in real time using signals natively available in vector-controlled drives (stator currents , and rotor position from encoder or observer), requiring no additional sensors. Nevertheless, the approach entails two practical limitations that warrant explicit acknowledgment. The primary limitation – dependence on quasi-steady-state operation – is mitigated by the fact that industrial drives (pumps, compressors, conveyors). Future work will focus on experimental validation under real noise conditions and online estimation of for incipient fault detection and investigation of semi-supervised learning strategies to further reduce dependency on large labeled datasets while preserving classification margins.
References
-
M. Moleda, B. Malysiak-Mrozek, W. Ding, V. Sunderam, and D. Mrozek, “From corrective to predictive maintenance: A review of maintenance approaches for the power industry,” Sensors, Vol. 23, No. 13, p. 5970, Dec. 2023, https://doi.org/10.3390/s23135970
-
Y. Shi, W. Zhu, Y. Xiang, and Q. Feng, “Condition-based maintenance optimization for multi-component systems subject to a system reliability requirement,” Reliability Engineering and System Safety, Vol. 202, p. 107042, Dec. 2020, https://doi.org/10.1016/j.ress.2020.107042
-
R. Harywibowo and A. Hariadi, “The effect of preventive maintenance, traffic management, technology and communication support and operator care on OSH performance transportation of truck units in the mining service company PT. XYZ,” Journal of Economics, Management, Entrepreneurship, and Business (JEMEB), Vol. 2, No. 2, pp. 114–129, Nov. 2022, https://doi.org/10.52909/jemeb.v2i2.103
-
E. Y. Salawu et al., “Impact of maintenance on machine reliability: A review,” E3S Web of Conferences, Vol. 430, p. 01226, Oct. 2023, https://doi.org/10.1051/e3sconf/202343001226
-
G. Zanuso, S. L. S. Kumar, and L. Peretti, “Interturn fault detection in induction machines based on high-frequency injection,” IEEE Transactions on Industrial Electronics, Vol. 70, No. 10, pp. 10639–10647, Oct. 2023, https://doi.org/10.1109/tie.2022.3217590
-
J. A. Kumar, M. Gowthambigai, N. R. Shanker, and J. Jasper, “Prediction of rotor slot size variation through vibration signal of three phase induction motor using machine learning,” Journal of Vibration Engineering and Technologies, Vol. 12, No. 1, pp. 561–574, Jan. 2023, https://doi.org/10.1007/s42417-023-00859-y
-
O. I. U. Haq, Y. Wu, L. Peretti, S. G. Bosga, and R. S. Kanchan, “Generalized harmonic injection strategy for multiphase induction machine control,” IEEE Transactions on Energy Conversion, Vol. 39, No. 2, pp. 1245–1254, Jun. 2024, https://doi.org/10.1109/tec.2023.3331233
-
A. Amrane, A. Larabi, and A. Aitouche, “Unknown input observer design for fault sensor estimation applied to induction machine,” Mathematics and Computers in Simulation, Vol. 167, pp. 415–428, Jan. 2020, https://doi.org/10.1016/j.matcom.2018.09.018
-
A. Amrane, A. Larabi, and A. Aitouche, “Fault detection and isolation based on nonlinear analytical redundancy applied to an induction machine,” in 6th International Conference on Systems and Control (ICSC), pp. 255–260, May 2017, https://doi.org/10.1109/icosc.2017.7958716
-
S. Yuan, W. Yi, and G. Yang, “Adaptive robust control of electromagnetic actuators with friction nonlinearity and uncertainty compensation,” Mathematical Models in Engineering, Vol. 10, No. 2, pp. 75–86, Jun. 2024, https://doi.org/10.21595/mme.2024.23935
-
R. Cambow and M. Singh, “Comparative analysis of wear resistance for bearing coating using VMD,” Journal of Vibration Engineering and Technologies, Vol. 12, No. S1, pp. 93–108, Dec. 2024, https://doi.org/10.1007/s42417-024-01404-1
-
J. Isavand, A. Kasaei, A. Peplow, B. Liu, and J. Yan, “Enhanced reduced-order symptom recognition technique for vibration-based bearing condition monitoring,” Journal of Vibration Engineering and Technologies, Vol. 13, No. 1, p. 113, Jan. 2025, https://doi.org/10.1007/s42417-024-01555-1
-
R. K. Mishra, A. Choudhary, S. Fatima, A. R. Mohanty, and B. K. Panigrahi, “A fault diagnosis approach based on 2D-vibration imaging for bearing faults,” Journal of Vibration Engineering and Technologies, Vol. 11, No. 7, pp. 3121–3134, Oct. 2022, https://doi.org/10.1007/s42417-022-00735-1
-
A. Athisayam and M. Kondal, “A smart CEEMDAN, Bessel transform and CNN-based scheme for compound gear-bearing fault diagnosis,” Journal of Vibration Engineering and Technologies, Vol. 12, No. S1, pp. 393–412, Dec. 2024, https://doi.org/10.1007/s42417-024-01422-z
-
W. Gao, “Research on modulation recognition method of electromagnetic signal based on wavelet transform convolutional neural network,” Mathematical Models in Engineering, Vol. 10, No. 1, pp. 11–25, Mar. 2024, https://doi.org/10.21595/mme.2023.23746
-
Z. Meng, J. He, J. Liu, Y. Jin, J. Li, and F. Fan, “Fault diagnosis of rolling bearings based on optimal noise and optimal step length superimposed segmental bistable stochastic resonance,” Journal of Vibration Engineering and Technologies, Vol. 11, No. 7, pp. 3521–3534, Oct. 2022, https://doi.org/10.1007/s42417-022-00765-9
-
A. Chabane, S. Adjerid, and I. Meddour, “Dependability analysis in systems engineering approach using the FMECA extracted from the SysML and failure modes classification by K-means,” International Journal of Dynamics and Control, Vol. 10, No. 3, pp. 981–998, Sep. 2021, https://doi.org/10.1007/s40435-021-00855-8
-
H. Sun, X. Liu, B. Huang, W. Li, Y. Fang, and Y. Wang, “Improved mode decomposition method for vibration signal denoising of aero-engine shaft bearing,” Mechanical Systems and Signal Processing, Vol. 238, p. 113201, Sep. 2025, https://doi.org/10.1016/j.ymssp.2025.113201
-
Q. Dong, X. Liu, H. Qi, and Y. Zhou, “Vibro-acoustic prediction and evaluation of permanent magnet synchronous motors,” Proceedings of the Institution of Mechanical Engineers, Part D: Journal of Automobile Engineering, Vol. 234, No. 12, pp. 2783–2793, Oct. 2020, https://doi.org/10.1177/0954407020919659
-
Q. Dong, X. Liu, H. Qi, C. Sun, and Y. Wang, “Analysis and evaluation of electromagnetic vibration and noise in permanent magnet synchronous motor with rotor step skewing,” Science China Technological Sciences, Vol. 62, No. 5, pp. 839–848, May 2019, https://doi.org/10.1007/s11431-018-9458-5
-
Z.-S. Ma, X. Li, M.-X. He, S. Jia, Q. Yin, and Q. Ding, “Recent advances in data-driven dynamics and control,” International Journal of Dynamics and Control, Vol. 8, No. 4, pp. 1200–1221, Aug. 2020, https://doi.org/10.1007/s40435-020-00675-2
-
Y. Li, J. Zhang, S. Zhang, W. Xiao, and Z. Zhang, “Multi-objective optimization-based adaptive class-specific cost extreme learning machine for imbalanced classification,” Neurocomputing, Vol. 496, pp. 107–120, Jul. 2022, https://doi.org/10.1016/j.neucom.2022.05.008
-
H.-J. Shin, K.-W. Cho, and C.-H. Oh, “SVM-based dynamic reconfiguration CPS for manufacturing system in Industry 4.0,” Wireless Communications and Mobile Computing, Vol. 2018, No. 1, p. 5795037, 2018, https://doi.org/10.1155/2018/5795037
-
D. Filusch, B. Stapff, H.-G. Herzog, and D. Gerling, “Investigation of an analytical method for the dynamical thermal behavior of electrical machines,” in International Conference on Electrical Machines (ICEM), pp. 518–523, 2022, https://doi.org/10.1109/icem51905.2022.9910952
-
J. Jiang, Y. Hu, Y. Chen, and G. Yan, “Feature extraction and intelligent fault diagnosis of marine machinery,” Journal of Vibration Engineering and Technologies, Vol. 12, No. 1, pp. 201–211, Jan. 2023, https://doi.org/10.1007/s42417-022-00837-w
-
L. Peretti, M. Pathmanathan, O. Ikram Ul Haq, and S. Sahoo, “Robust harmonic detection, classification and compensation method for electric drives based on the sparse fast Fourier transform and the Mahalanobis distance,” IET Electric Power Applications, Vol. 11, No. 7, pp. 1177–1186, Aug. 2017, https://doi.org/10.1049/iet-epa.2016.0843
-
K. Vos, Z. Peng, C. Jenkins, M. R. Shahriar, P. Borghesani, and W. Wang, “Vibration-based anomaly detection using LSTM/SVM approaches,” Mechanical Systems and Signal Processing, Vol. 169, p. 108752, Apr. 2022, https://doi.org/10.1016/j.ymssp.2021.108752
-
L. Chen and C. Co, “Research on fault diagnosis of electric motor rolling bearings based on CMFSE-SVM,” Mathematical Models in Engineering, Vol. 11, No. 3, pp. 136–154, Sep. 2025, https://doi.org/10.21595/mme.2025.25124
-
K. Chatzitheodorou and V. Kappatos, “Hybrid extraction of multi-word terms: an application on vibration-based condition monitoring technique,” Mathematical Models in Engineering, Vol. 7, No. 1, pp. 1–9, Jan. 2021, https://doi.org/10.21595/mme.2021.21850
-
M. M. Mosa, B. N. Megdad, and S. S. Abu-Naser, “Fraudulent financial transactions detection using machine learning,” in Int. J. Acad. Inf. Syst. Res. (IJAISR), Vol. 6, No. 3, pp. 30–39, Mar. 2022, https://doi.org/10.1109/esmarta59349.2023.10293697
-
B. Asad, T. Vaimann, A. Rassõlkin, A. Kallaste, and A. Belahcen, “Review of electrical machine diagnostic methods applicability in the perspective of Industry 4.0,” Electrical, Control and Communication Engineering, Vol. 14, No. 2, pp. 108–116, 2018, https://doi.org/10.2478/ecce-2018-0013
-
M. E. Iglesias Martínez, J. A. Antonino-Daviu, L. Dunai, J. A. Conejero, and P. Fernández de Córdoba, “Higher-order spectral analysis and artificial intelligence for diagnosing faults in electrical machines: An overview,” Mathematics, Vol. 12, No. 24, p. 4032, Dec. 2024, https://doi.org/10.3390/math12244032
-
I. Chouidira, D. Khodja, and S. Chakroune, “Induction machine faults detection and localization by neural networks methods,” Revue d’Intelligence Artificielle, Vol. 33, No. 6, pp. 427–434, Dec. 2019, https://doi.org/10.18280/ria.330604
-
A. H. Boudinar, A. Bendiabdellah, and N. Benouzza, “Diagnosis of the broken rotor bars faults by Root-MUSIC method,” in Advances in Computer and Electrical Engineering, Hershey, PA, USA: IGI Global, 2019, pp. 59–88, https://doi.org/10.4018/978-1-5225-6989-3.ch003
-
C. Abdellah, C. Mama, M. R. Meflah Abderrahmane, and B. Mohammed, “Current Park’s vector pattern technique for diagnosis of broken rotor bars fault in saturated induction motor,” Journal of Electrical Engineering and Technology, Vol. 18, No. 4, pp. 2749–2758, Jul. 2023, https://doi.org/10.1007/s42835-022-01342-6
-
C. Wang, X. Cheng, S. Chen, G. Li, and H. Zhang, “A SVM-based sensitivity analysis approach for data-driven modeling of ship motion,” in IEEE International Conference on Mechatronics and Automation (ICMA), pp. 803–808, 2018, https://doi.org/10.1109/icma.2018.8484531
About this article

The authors have not disclosed any funding.
The datasets generated during and/or analyzed during the current study are available from the corresponding author on reasonable request.
Ahmed Amrane: conceptualization, methodology, investigation, and numerical simulation; data curation and processing; formal analysis of simulation results and model validation; visualization, supervision, and literature review; manuscript writing (original draft preparation, critical review, and editing); editorial revision and manuscript formatting. Ali Chabane: conceptualization, methodology, and formal analysis; data processing and analysis of simulation results; model validation, supervision, and literature review; manuscript writing (original draft preparation and critical review); editorial revision and manuscript formatting. Khaled Benfriha: supervision and validation; data processing and analysis of simulation results; manuscript writing (original draft preparation and critical review). Taha Chettibi: supervision and validation; data processing and analysis of simulation results; manuscript writing (original draft preparation and critical review).
The authors declare that they have no conflict of interest.

