Abstract
As a localized high-intensity downdraft disaster, downbursts are a significant cause of wind-rain-induced damage to transmission lines. Their unique wind field characteristics make it difficult for existing design methods to comprehensively evaluate the resistance capacity of transmission lines. Current collapse analyses of transmission lines often fail to adequately consider the wind-rain field conditions during downbursts. Therefore, this study investigates the dynamic response and collapse mechanisms of transmission lines under downburst wind-rain conditions. First, a numerical simulation model is established to explore the distribution characteristics of wind and rain. A full-scale three-dimensional computational domain model is employed to simulate the wind-rain field, which is subsequently modified. The wind-rain velocity ratio is analyzed, and a fitting formula is proposed. Subsequently, combined distributed loads are applied to the transmission line to conduct parametric analyses of the dynamic response and investigate the collapse mechanisms. The results demonstrate that the computational domain model for simulating the wind-rain field is validated using relevant models, and the Vicroy model is modified for generating wind-rain loads. The horizontal velocity of raindrops does not synchronize with wind speed variations, and the proposed fitting formula for the wind-rain velocity ratio exhibits high accuracy. Downbursts significantly influence the dynamic response of the transmission tower-line system, with the most unfavorable wind attack angles, heights, rainfall intensities, and combined conditions identified. The collapse failure mode of the transmission line is characterized by initial damage and failure of diagonal members, leading to extensive structural collapse. The critical segments vary under different wind attack angles and reference heights, while rainfall has a minor impact on the collapse process. This study provides important technical insights for the wind-resistant design and safe operation of transmission lines.
Highlights
- A full-scale 3D computational domain was established, utilizing a modified Vicroy model to accurately simulate the unique near-ground characteristics of downburst-induced wind-rain loads.
- The study revealed that the horizontal velocity of raindrops does not synchronize with wind speed due to inertial effects. Consequently, a high-accuracy, semi-empirical fitting formula for the wind-rain velocity ratio was proposed and validated.
- Extreme rainfall significantly amplifies the structural dynamic response—increasing peak ISDR by 29.1%—but has a minor influence on the fundamental macroscopic failure sequence.
1. Introduction
A downburst is a natural disaster characterized by localized high-intensity combined wind and rain loads. It features a powerful downdraft that descends from the base of a thunderstorm cloud and spreads radially outward upon impacting the ground [1-3]. Downburst disasters have become one of the significant causes of wind-rain-induced damage to transmission lines worldwide. Particularly in non-cyclonic regions, the extreme wind loads they generate pose a serious threat to the structural safety of transmission lines [4-8]. Unlike atmospheric boundary layer winds, downbursts exhibit distinct wind field characteristics, rendering existing design methods insufficient for comprehensively evaluating the ability of transmission line systems to resist downburst effects [9-10]. Therefore, systematic research on the dynamic response and collapse analysis of transmission lines under combined downburst loads is of great significance for ensuring the safe and stable operation of transmission lines.
As a localized high-intensity downdraft triggered by severe convective weather, a downburst forms a radial outflow after ground impact. Compared to traditional atmospheric boundary layer wind fields, downbursts possess unique wind field characteristics, with the maximum wind speed potentially occurring at heights close to the ground [11-15]. Research on downburst wind-rain fields primarily employs two analytical methods: impinging jet experiments and numerical simulation analyses [16-20]. Sengupta et al. [21] combined impinging jet experiments with CFD simulations, utilizing hot-wire anemometry, pressure rakes, and PIV technology to establish an empirical formula for a universal radial wind speed profile. Their results showed good agreement with CFD simulations, demonstrating the feasibility of the method and the reasonableness of the formula. Romanic et al. [22] proposed a novel scaling method for downbursts based on adjusting parameters such as jet diameter and considering ground roughness. Their results indicated that modeling according to the scaling principles and measuring wind speeds could validate the accuracy of this method. Fang et al. [23] simulated steady-state and moving downbursts for comparison, verified the accuracy of the moving model, and found that the vector superposition principle could be used to calculate wind speed, albeit within a limited applicable range. Pan et al. [24], based on the SST turbulence model, conducted a detailed analysis of the evolution of the mean wind speed in downbursts. They proposed a horizontal time-varying wind speed model and derived a new wind profile formula by integrating a generalized wind profile model with their findings. Dang et al. [25] simulated a full-scale downburst wind field using the RSM model. Comparisons revealed that empirical formulas underestimated the horizontal wind speed, leading them to propose a new empirical formula considering near-wall effects to accurately describe the vertical wind profile.
Transmission lines are highly susceptible to collapse under the intense combined wind and rain loads of downbursts, which can result in large-scale power outages [26-31]. Research on structural collapse mechanisms can accurately predict the collapse modes and ultimate bearing capacity of transmission lines, holding significant importance for enabling structures to effectively withstand downburst disasters. Vettoretto et al. [32] investigated the collapse of high-voltage transmission towers under strong winds. By extracting buckling modes and introducing geometric imperfections in simulations, they identified critical members influencing collapse and provided recommendations for wind resistance safety factors. Asgarian et al. [33] studied a 400kV transmission tower, modeling and adjusting the force distribution pattern during wind-induced collapse. Their research found that the internal force transmission path within the tower continuously changes during the collapse process, which positively mitigates progressive collapse. Mohammadi et al. [34] addressed the inherent structural uncertainties of transmission towers by proposing a modeling method. Analysis and verification confirmed that this method effectively captures behaviors such as member buckling and is suitable for collapse analysis under extreme wind loads. Tian et al. [35] investigated wind-rain loads on transmission towers in wind fields, calculated raindrop velocities, and conducted nonlinear dynamic time-history analyses. Their results indicated that under heavy rainfall, the combined action of wind and rain makes transmission towers more prone to collapse. Previous studies typically isolate downburst wind loads or limit wind-rain coupling investigations to standard atmospheric boundary layer (ABL) flows. However, unlike ABL flows, a downburst features a unique jet-like vertical profile. This distinct outflow causes a lag in the horizontal acceleration of raindrops due to inertial effects, resulting in a highly localized and non-uniform wind-rain velocity ratio. Therefore, conventional ABL wind-rain models are physically inadequate for capturing the true coupled effects of heavy rainfall during a downburst event.
Addressing the aforementioned issues, this paper conducts research on the dynamic response and collapse mechanisms of transmission lines under downburst wind-rain fields, based on methods for simulating downburst wind-rain fields and analyzing the collapse of the tower-line system. By integrating the specific kinematics of the downburst wind-rain field (CFD) with a nonlinear hysteresis damage model (FEA), this research demonstrates how the spatiotemporal non-stationarity uniquely drives the dynamic shifting of structural vulnerable segments. First, a numerical simulation model for the downburst wind-rain field is established to investigate the distribution characteristics of wind and rain within it. Subsequently, combined wind-rain loads obtained from the downburst wind field simulation are applied to the transmission tower-line system, followed by an analysis of the dynamic response and collapse mechanisms of the transmission line. The research findings summarize the failure patterns of the tower-line system in downburst wind-rain fields, providing an important technical basis for the wind disaster design and safe operation and maintenance of transmission lines.
2. Characteristics of downburst wind-rain field
2.1. Downburst wind field simulation
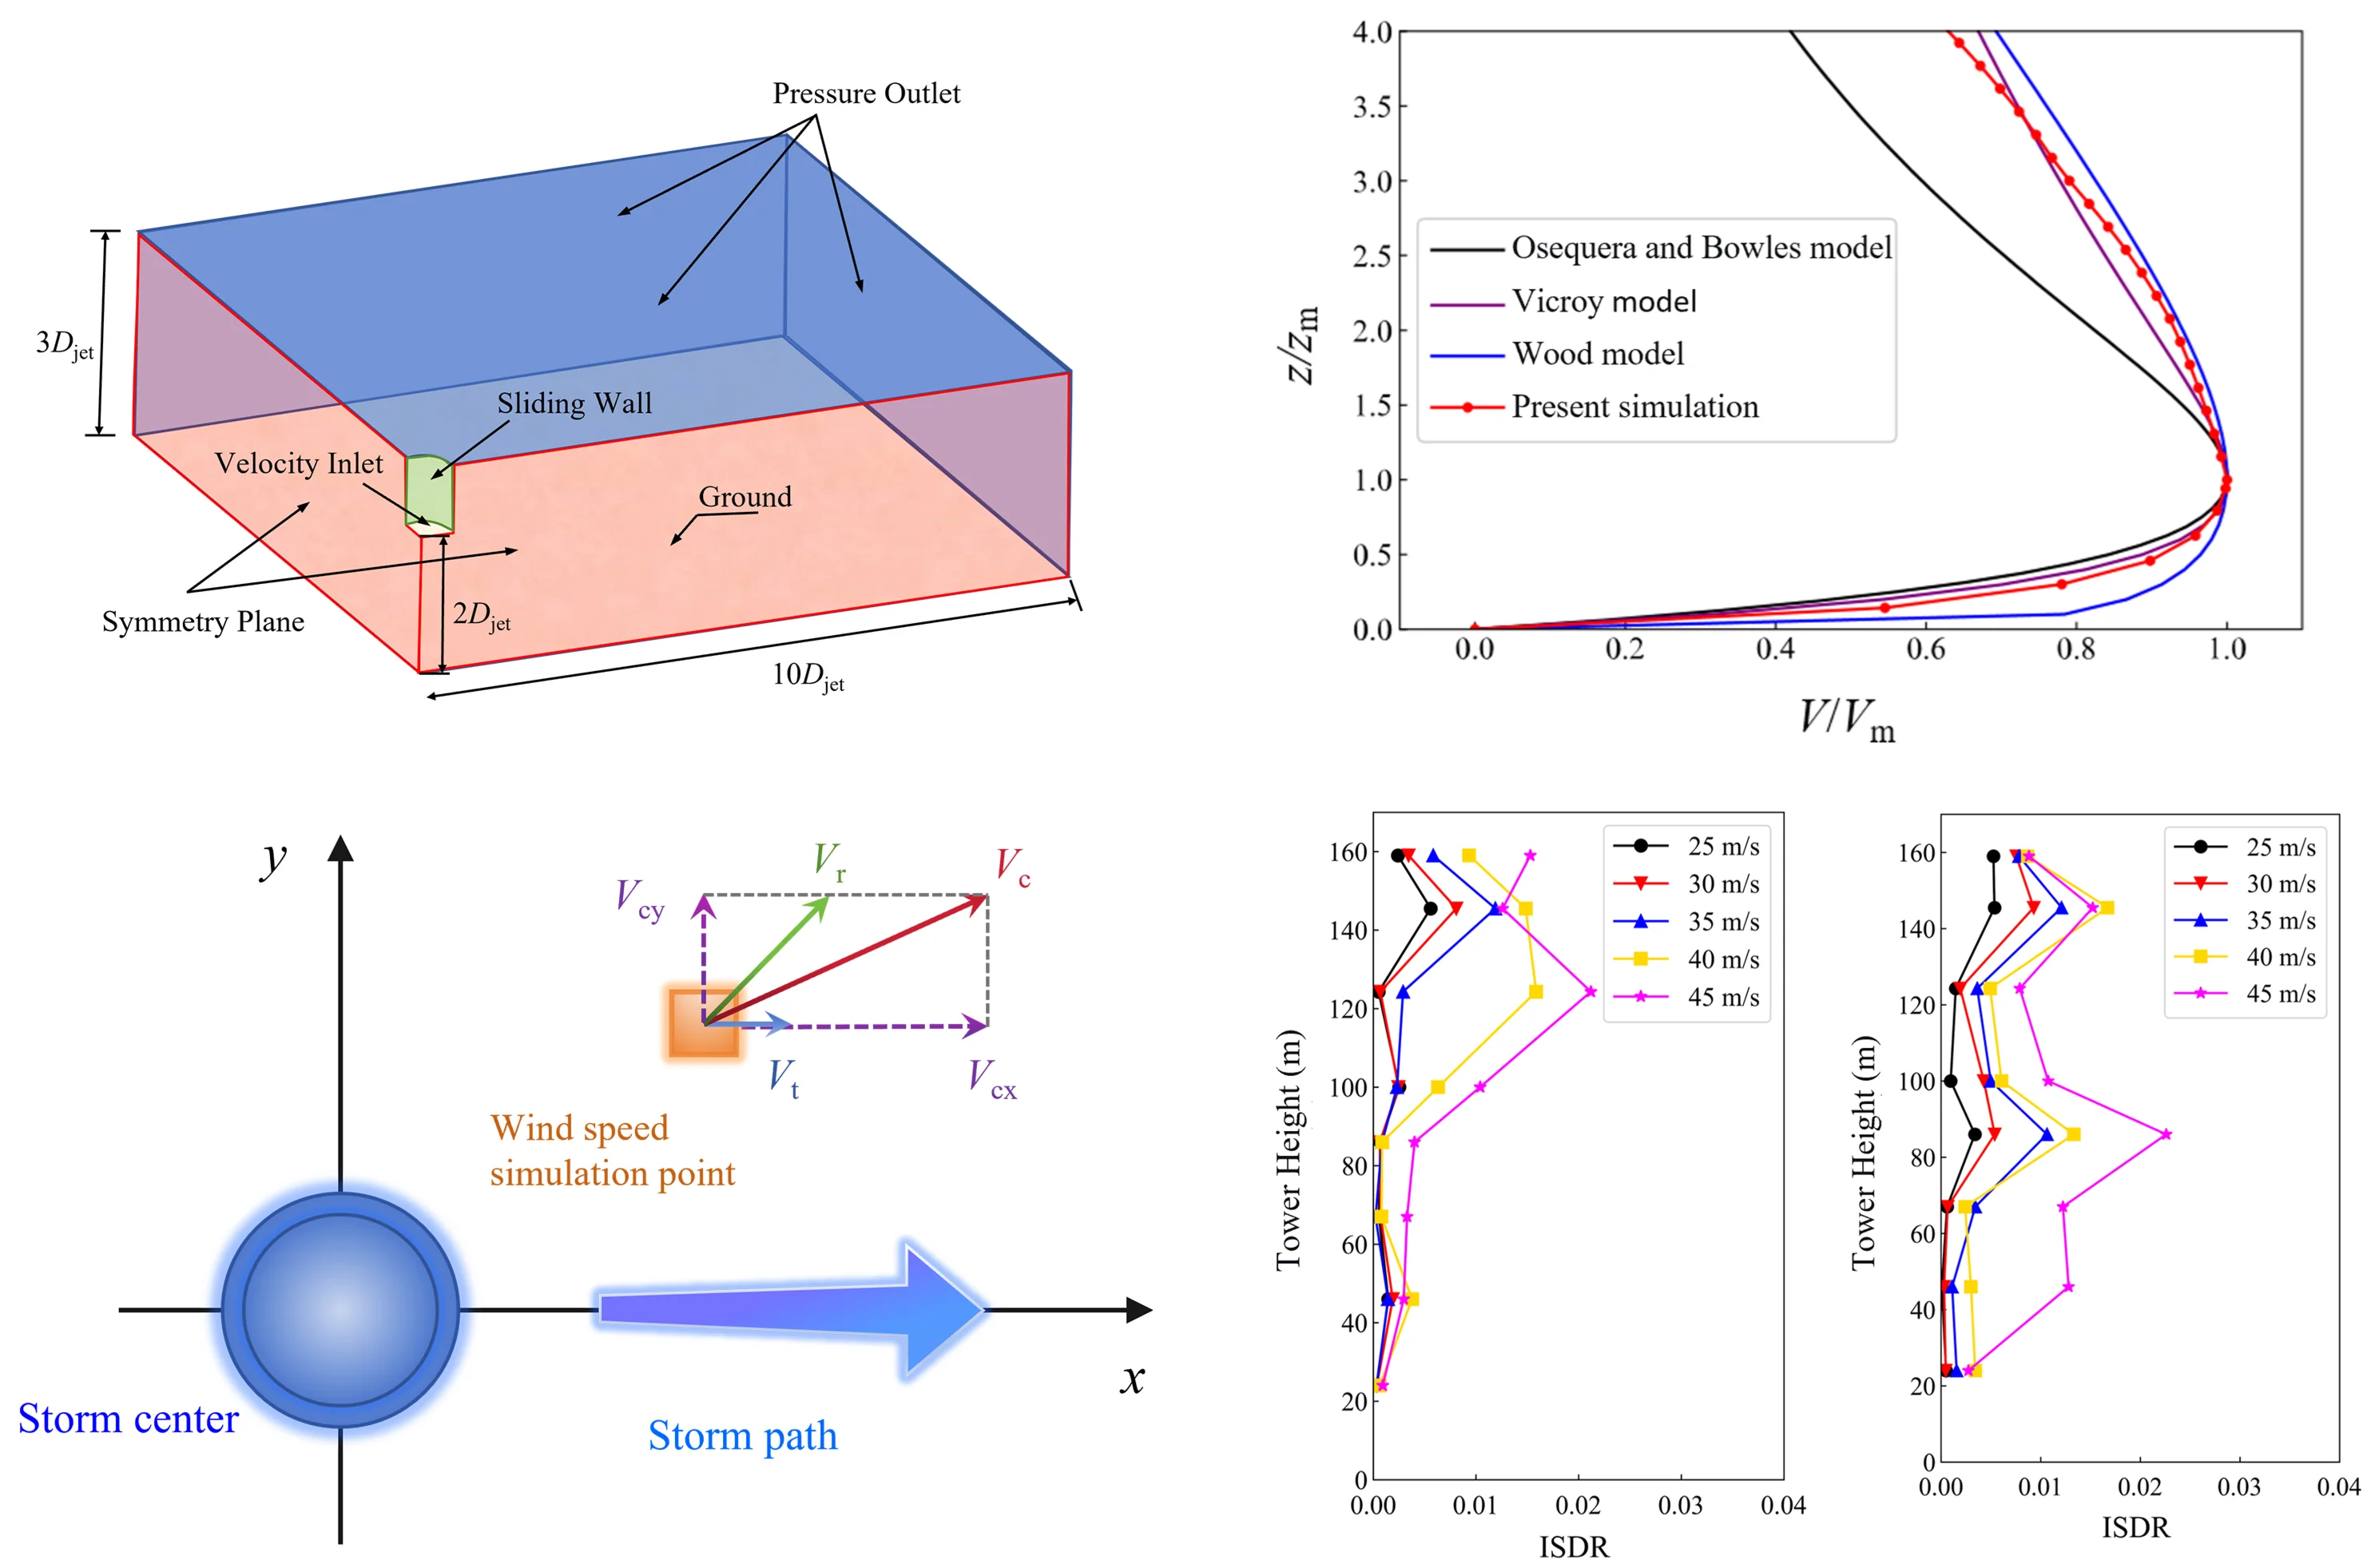
To investigate the dynamic response and collapse mechanism of transmission lines under a downburst wind-rain field, this study employs a transient simulation method for the numerical simulation of the downburst wind field. First, a full-scale three-dimensional computational domain is established, with an initial outflow diameter 600 m, initial outflow velocity 40 m/s, and outflow height . To ensure full development of turbulence, the spatial dimensions of the computational domain are set to 10×10. Considering the symmetry of the downburst wind field, a quarter of the computational domain is used for the simulation. The computational domain for the simulated wind field, along with the boundary conditions and grid, are shown in Fig. 1. Structured grids are applied to the entire flow field, with grid refinement in the localized region where the downburst occurs. To meet the requirements of the standard wall function, the height of the first layer of grids near the ground is set to 0.002 m, achieving 50. The computational domain is divided into a total of 5.2 million grids. In the simulated wind field, the domain inlet is set as a velocity inlet, the surrounding sides are set as slip walls with zero specified shear stress, the bottom surface of the domain is set as a no-slip wall, and the top surface and sides not directly connected to the velocity inlet are set as pressure outlets.
Table 1Calculational boundary condition setting
Boundary type | Boundary condition settings |
Velocity inlet | Turbulence intensity = 1%, Hydraulic diameter = |
Pressure outlet | Turbulence intensity = 1%, Hydraulic diameter = |
Sliding wall | Zero shear stress |
Symmetry plane | Symmetry |
Ground | Roughness height 0.002 Roughness constant 0.5 |
The RNG - model was selected for turbulence calculation, and the SIMPLE algorithm was adopted for pressure-velocity coupling. The second-order upwind scheme was employed for discretizing momentum, pressure, turbulent kinetic energy, and turbulent dissipation rate. The computational boundary conditions are presented in Table 1. To ensure the robustness of numerical results and minimize cognitive uncertainty, the computational setup was rigorously established. Firstly, the RNG - turbulence model was deliberately selected from multiple options due to its superior performance in handling high strain rates and the inherent streamline curvature of downwash flows. Secondly, a preliminary grid independence study was conducted prior to the full-scale simulations. Three different mesh densities (coarse, medium, and fine) were evaluated. The medium mesh strategy adopted in this study provided a discrepancy of less than 3 % in peak wind pressure compared to the fine mesh, thereby achieving an optimal balance between computational efficiency and result robustness.
Fig. 1Computational domain, boundary conditions and grids
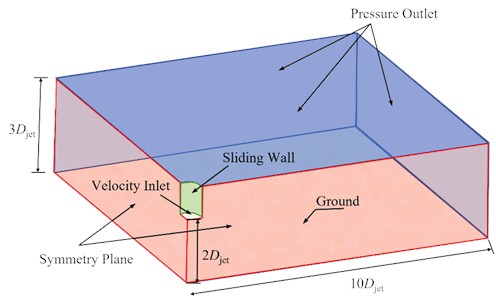
a) Schematic diagram of computational domain and boundary conditions
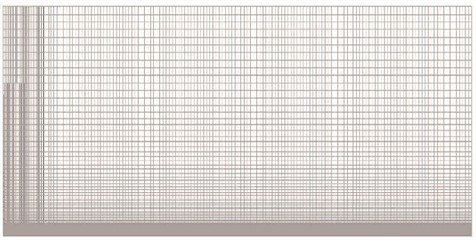
b) Front view of mesh

c) Top view of mesh
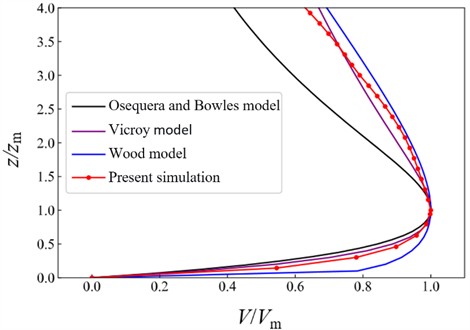
In this study, the Osequera and Bowles model [36], the Vicroy model [37], and the Wood model [16] were employed to construct a theoretical downburst wind field for validating the rationality of the simulated wind field. The vertical wind profile at a location 1.5 from the storm center and at a flow development time of 160 s was compared with empirical models. Due to differences in flow field parameter settings, both height and wind speed were normalized. The normalization method was as follows: the horizontal coordinate represents the ratio of the horizontal wind speed to the maximum horizontal wind speed , and the vertical coordinate represents the ratio of the height to the height at which the maximum horizontal wind speed occurs, as shown in Fig. 2. As height increases, within the interval of 0 < < 1, the wind speed growth in the Osequera and Bowles model and the Vicroy model is significantly faster than that in the Wood model. The simulation results lie between the Vicroy model and the Wood model, showing closer agreement with the Vicroy model. When > 1, as height increases, the wind speed in the Osequera and Bowles model decreases rapidly. The simulation results are close to the Wood model when < 2, and intersect with the Vicroy model at higher altitudes. The height is defined as the reference height for subsequent research. Considering the variation of wind-rain loads near the ground and the overall closer agreement with the Vicroy model, the Vicroy model – which was modified using measured data – was selected for generating the subsequent wind-rain loads. The Vicroy model is expressed by the following Eq. (1):
The specific coefficients in Eq. (1) were derived through non-linear curve fitting based on measured meteorological data of downburst vertical wind profiles. This empirical calibration ensures that the maximum simulated wind speed perfectly aligns with the designated reference height (), providing a mathematically transparent and physically realistic boundary condition for the subsequent simulations.
Fig. 2Verification of wind profile
2.2. Wind-rain velocity ratio in downbursts
In a downburst, raindrops descend under the influence of the downdraft, impacting the ground, while also being driven horizontally by the radial outflow, forming a large-scale wind-rain field. This inevitably imposes rain loads on structures within the affected area, making it crucial to consider the velocity characteristics of raindrops in downbursts. During their descent, the inertia of raindrops causes their horizontal velocity change to lag behind variations in wind speed, meaning they decelerate more slowly than the wind. Consequently, the horizontal velocity of raindrops generally exceeds the local wind speed at the same position. Therefore, it is inaccurate to simply equate raindrop horizontal velocity to wind speed when calculating combined wind-rain loads; instead, a specific velocity ratio relationship must be considered. Given the complexity of the vertical wind profile in downbursts, the velocity of raindrops within the wind field is analyzed to derive the wind-rain velocity ratio for subsequent load calculations.
By treating raindrop velocities in different horizontal directions collectively, the motion of a raindrop can be regarded as two-dimensional (with representing the horizontal direction and the vertical direction). The equations of motion for the raindrop are given as follows:
where, represents the air density, taken as 1.235 kg/m³; represents the raindrop density, taken as 1000 kg/m³; is the raindrop radius; is the horizontal drag coefficient, taken as 0.47; is the vertical drag coefficient. These governing equations (Eq. (2) and Eq. (3)) constitute the theoretical first-principles foundation of the raindrop kinematics. Furthermore, to ensure the physical reliability of this foundation, the critical aerodynamic parameters, particularly , are rigorously assigned based on independent, classic experimental measurements by Gunn and Kinzer [38], rather than arbitrary assumptions. is the horizontal wind speed; is the vertical wind speed. Based on these physically validated differential equations, the velocity of raindrops of different diameters at any moment in the wind field can be solved.
The wind-rain velocity ratio in a downburst is defined as the ratio of the raindrop horizontal velocity to the corresponding horizontal wind speed expressed as:
where, represents the raindrop diameter, and denotes the normalized height. Given the uncertainty in the height at which the maximum wind speed occurs in a downburst, the falling height of raindrops is normalized. This is defined as the ratio of the raindrop height to the height at which the maximum horizontal wind speed occurs, expressed as:
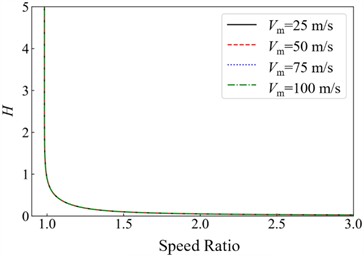
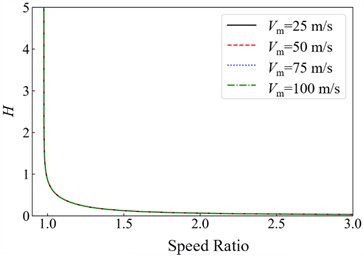
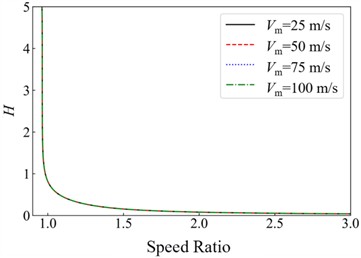
The maximum wind speed was set to 25 m/s, 50 m/s, 75 m/s, and 100 m/s; raindrop diameters were assigned according to Table 2; was set to 50 m; the raindrop generation height was defined as 10 ; and the initial raindrop velocity was set to 0 m/s. Fig. 3 presents the wind-rain velocity ratio curves under various conditions. The results indicate that, for a given raindrop diameter, variations in the maximum wind speed have no influence on the velocity ratio. When the normalized height 1, the velocity ratios for all raindrop diameters are similar but consistently less than 1. This occurs because, as the height decreases toward , the horizontal wind speed increases. However, due to inertial effects, the rate of increase in the horizontal raindrop velocity is slower than that of the wind speed. Simultaneously, the wind profile exhibits relatively gradual changes, resulting in minimal disparity between the horizontal raindrop velocity and the horizontal wind speed, which leads to a velocity ratio close to but still below 1. When the normalized height 1, the raindrops have descended past , and the horizontal wind speed decreases with further reduction in height. The rate of decrease in the horizontal raindrop velocity is slower than that of the wind speed, causing the velocity ratio to transition from below 1 to above 1 in this region. Moreover, due to the significant gradient in the wind profile during this phase, the wind speed decreases rapidly. Consequently, the velocity ratio increases sharply as the height approaches zero.
Table 2Regulation of raindrop size
Raindrop size (mm) | Diameter control range (mm) |
0.25 | 0-0.50 |
0.75 | 0.50-1.00 |
1.25 | 1.00-1.50 |
1.75 | 1.50-2.00 |
2.50 | 2.00-3.00 |
3.50 | 3.00-4.00 |
4.50 | 4.00-5.00 |
5.50 | 5.00-6.00 |
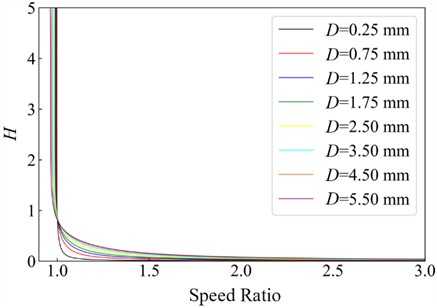
Fig. 4 presents a comparison of the wind-rain velocity ratio curves for raindrops of different diameters. The results indicate that as the raindrop diameter increases, the velocity ratio rises in the region where 1, while it decreases in the region where 1. This behavior occurs because larger raindrop diameters lead to increased mass and greater inertia, which reduces their responsiveness to the driving force of the horizontal wind speed. As a result, the change in horizontal raindrop velocity becomes less pronounced relative to the change in horizontal wind speed.
Fig. 3Wind-rain velocity ratio
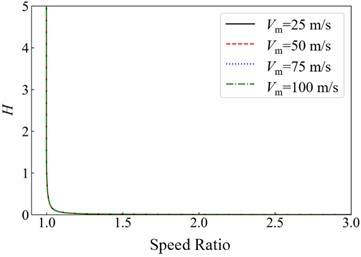
a) Raindrop diameter 0.25 mm
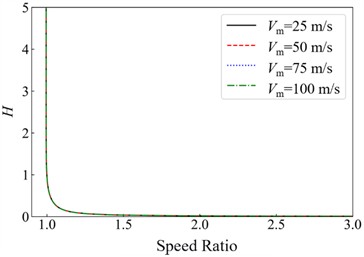
b) Raindrop diameter 0.75
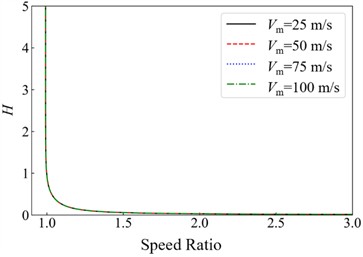
c) Raindrop diameter 1.25 mm
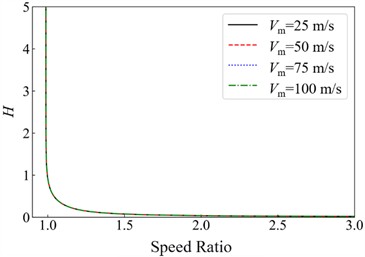
d) Raindrop diameter 1.75 mm
e) Raindrop diameter 2.50 mm
f) Raindrop diameter 3.50 mm

g) Raindrop diameter 4.50 mm
h) Raindrop diameter 5.50 mm
Fig. 4Wind-rain velocity ratio of raindrops with different diameters
Ideally, the functional form of the velocity ratio would be derived analytically directly from the first-principles Eq. (2) and Eq. (3). However, because the aerodynamic drag forces are non-linearly dependent on the relative velocity, and the driving downburst wind profile (the modified Vicroy model) follows a complex double-exponential decay, a closed-form analytical solution for the trajectory is mathematically intractable. Therefore, a semi-empirical approach – numerical integration followed by parameter fitting based on dimensional analysis – is necessitated.
Based on the analysis of the derived velocity ratio trends, it is concluded that the velocity ratio is approximately inversely proportional to height, while its relationship with raindrop diameter is more complex. Consequently, a fitting formula is derived by fitting the aforementioned curve data. To ensure dimensional consistency in accordance with the principles of dimensional analysis, the variables in the empirical formulation must be dimensionless. While the height is already normalized (), the dimensional raindrop diameter must also be non-dimensionalized. By introducing a reference droplet diameter 1 mm, a dimensionless diameter parameter is defined as . Consequently, the dimensionally consistent functional form is fitted as follows:
where, represents the normalized height of the falling raindrop, and denotes the non-dimensional raindrop diameter.
To evaluate the fitting performance, a raindrop diameter of 2.50 mm was selected, and the simulation data were compared with the results calculated using the fitting formula, as shown in Fig. 5. The two curves exhibit close agreement, indicating the high accuracy of the fitting formula. To further quantitatively assess the degree of fit, the Root Mean Square Error (RMSE) was adopted as an indicator to evaluate the fitting performance of the wind-rain velocity ratio across different raindrop diameters. The results are presented in Table 3. By applying the fitting formula, the horizontal velocity of raindrops can be directly determined in subsequent calculations, thereby enabling the derivation of the rain load acting on the structure.
It should be noted that the fundamental aerodynamic characteristics and fluid-structure interactions of transmission line components under wind-rain conditions have been experimentally validated through physical wind tunnel tests [39]. Based on this validated aerodynamic foundation, the present study utilizes numerical frameworks to overcome the physical scaling limitations of multi-phase flows in conventional wind tunnels, extending the investigation to the dynamic analysis of TTLS under downbursts.
Fig. 5Comparison of simulation results and fitting formula
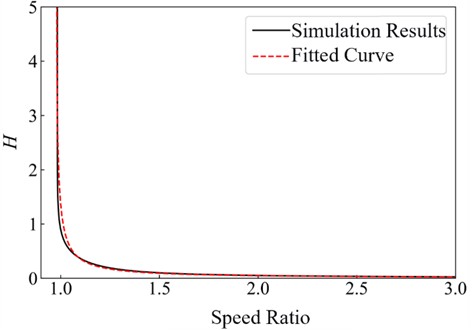
Table 3Evaluation of fitting results
Raindrop diameter (mm) | RMSE |
0.25 | 0.0048 |
0.75 | 0.0104 |
1.25 | 0.0130 |
1.75 | 0.0147 |
2.50 | 0.0181 |
3.50 | 0.0216 |
4.50 | 0.0246 |
5.50 | 0.0281 |
3. Collapse mechanism of transmission tower-line system
3.1. Finite element model
3.1.1. Model establishment
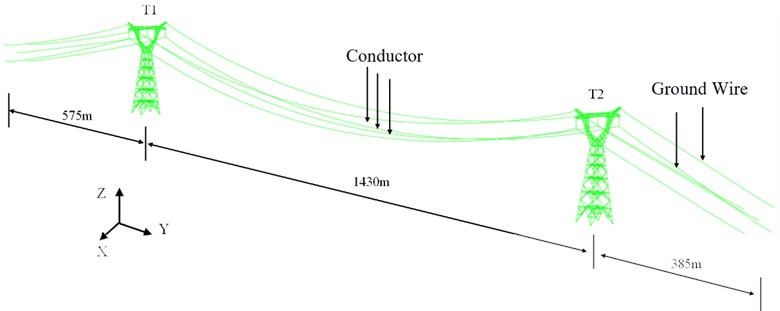
This paper selects a long-span transmission line project as the research object. The total length of the transmission line is 2390 m, with a span distribution of 575 m, 1430 m, 385 m. The two suspension towers share the same structural design, both featuring a cat-head configuration. The main members utilize Q420 steel tubes, while the bracing members employ Q355 steel tubes. The constitutive parameters of Q420 and Q355 steel pipes were rigorously calibrated using the Tian-Ma-Qu constitutive model [40]. Fig. 6. illustrates the planar design and segment description of the transmission tower. Each span of the transmission line is divided into four layers: the top layer consists of ground wires, and the lower three layers are conductors. The entire line uses JLHA1/G4A-500/230 extra-high-strength aluminum alloy conductor steel-reinforced (AACSR) for the conductors, and a 72-core OPGW-300 optical fiber composite overhead ground wire. Detailed parameters of the conductors and ground wires are provided in Table 4.
Based on the actual engineering context, a suspension tower from the simulated transmission line is selected as the research subject. A three-dimensional finite element model of a single tower and the corresponding single-circuit tower-line system is established. The direction perpendicular to the tower line is defined as the -direction, the direction along the tower line as the -direction, and the vertical direction as the -direction. The suspension tower connected to the 575 m span tension section is designated as T1, and the other as T2, as shown in Fig. 7. The modeling approach is as follows: the elastic modulus of the tower steel is set to 2.06×10⁵ MPa, the mass density to 7850 kg/m3, and Poisson’s ratio to 0.3. Tower members are simulated using B31 beam elements, while insulators and transmission conductors are modeled using T3D2 truss elements.
Table 4Parameters and specifications of conductor and ground wire
Type | Conductor | Ground Wire |
Conductor type | JLHA1/G4A-500/230 | OPGW-300 |
Elastic modulus (GPa) | 97.0 | 170.1 |
Cross-sectional area (mm²) | 727.93 | 295.40 |
Outer diameter (mm) | 35.13 | 22.90 |
Calculated mass (kg/km) | 3173.5 | 2166.0 |
Coefficient of expansion (1/°C) | 16.0×10⁻⁶ | 13.0×10⁻⁶ |
Rated breaking force (kN) | 535.8 | 464.5 |
Maximum working stress (N/mm²) | 233.09 | 393.11 |
Fig. 6Planar design illustration of the transmission tower (unit: mm)
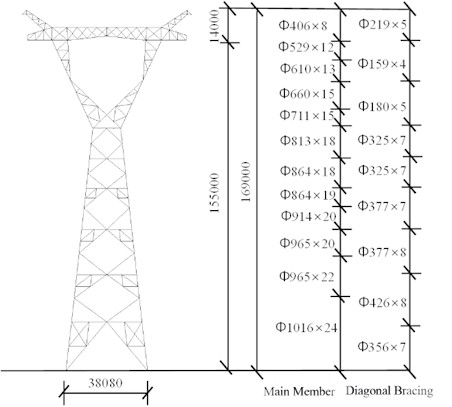
Fig. 7Three-dimensional finite element model of transmission tower-line system
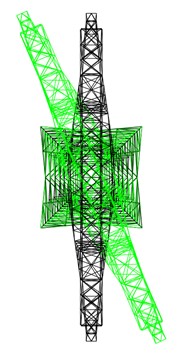
Dynamic characteristic analyses were conducted for both the single tower and the tower-line system. The mode shapes of the single tower are shown in Fig. 8, where the first and second modes correspond to overall bending in the and directions of the tower, respectively, and the third mode is a torsional mode. The global mode shapes of the tower-line system are presented in Fig. 9, and its natural vibration characteristics are summarized in Table 5. Due to the influence of the mass and stiffness of the transmission conductors, the natural frequencies of the tower-line system in its global modes are lower than those of the single tower.
Fig. 8Vibration mode of the transmission tower
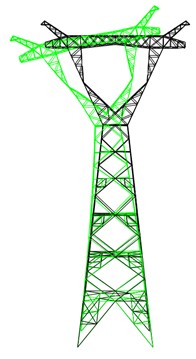
a) First-order mode shape
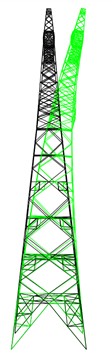
b) Second-order mode shape
c) Third-order mode shape
Fig. 9Vibration mode of transmission tower-line system
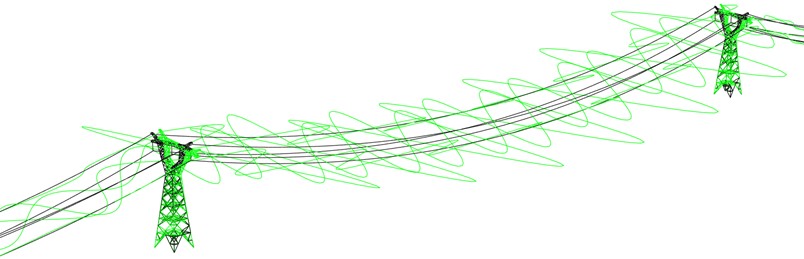
a) First-order mode shape
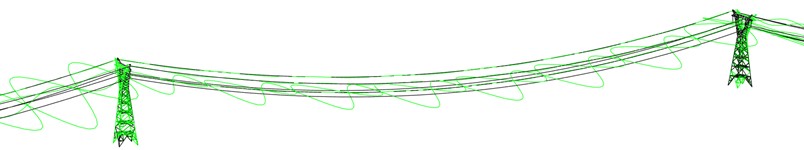
b) Second-order mode shape
Table 5The natural frequency and period of transmission tower and transmission tower-line system
Type | Mode | Frequency (Hz) | Period (s) |
Transmission tower | 1 | 0.826 | 1.211 |
2 | 0.929 | 1.076 | |
3 | 1.102 | 0.907 | |
Tower-line coupling system | 1 | 0.774 | 1.292 |
2 | 0.887 | 1.127 |
To formally validate the macroscopic structural model, the extracted dynamic characteristics were compared against established empirical evaluations for transmission towers. According to standard structural engineering practices, the fundamental period of a transmission tower can be estimated using the empirical formula:
where is the total height of the tower. For the transmission tower analyzed in this study ( = 169 m), the theoretical fundamental period should range from 1.183 s to 2.197 s. As shown in Table 5, the computed fundamental period of the single transmission tower is 1.211 s, which falls perfectly within this empirical range. This excellent agreement robustly validates the accuracy of the mass and stiffness distribution in the established finite element model.
3.1.2. Simulation of downburst wind-rain loads
The entire surface of the tower-line system structure is discretized to simulate the wind and rain loads considering spatiotemporal variability. For the calculation of these loads, the transmission tower is divided into eight segments, with the windward areas of each segment provided in Table 6. The simulated wind speed at each segment is taken as the overall representative wind speed for that corresponding segment, as illustrated in Fig. 10. Concurrently, the conductor is divided into elements with a length of 10 m. The time history of wind and rain load is simulated based on the position of the center of each element, and the equivalent wind and rain loads are applied at the nodes.
Fig. 10Segmentation of wind load simulation and intersegment
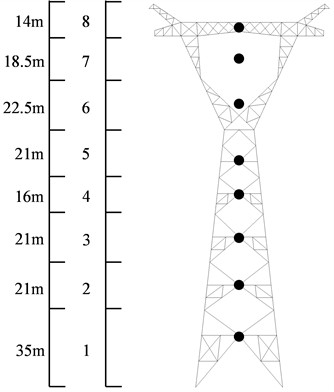
Table 6The height of wind speed simulation point and windward area of each internode
Section number | Simulation point height (m) | Windward area in -direction (m2) | Windward area in -direction (m2) |
1 | 24 | 141.94 | 141.94 |
2 | 46 | 79.30 | 79.30 |
3 | 67 | 72.43 | 72.43 |
4 | 86 | 51.03 | 51.03 |
5 | 100 | 59.58 | 59.58 |
6 | 124.3 | 64.53 | 85.51 |
7 | 145.5 | 38.23 | 50.24 |
8 | 159 | 33.60 | 156.38 |
This study investigates the impact of variations in the movement direction of the downburst storm center on the transmission line. Based on the horizontal wind speed at the center of the line, the wind attack angle along the -direction (perpendicular to the tower-line direction) is defined as 0°, and the wind attack angle along the -direction (parallel to the tower-line direction) is defined as 90°, as illustrated in Fig. 11. According to the wind-rain time history simulation method summarized in Section 2.5, the wind speed time history for the studied tower-line system is simulated. The relevant parameters of the downburst wind field are listed in Table 7. With = 60 m/s and = 80 m, a simulation time history of 600 s is adopted. The storm center moves along the 90° wind attack angle in the positive -direction toward transmission tower , with its initial position located 3500 m from the center of the transmission line.
Fig. 11Definition of wind attack angle
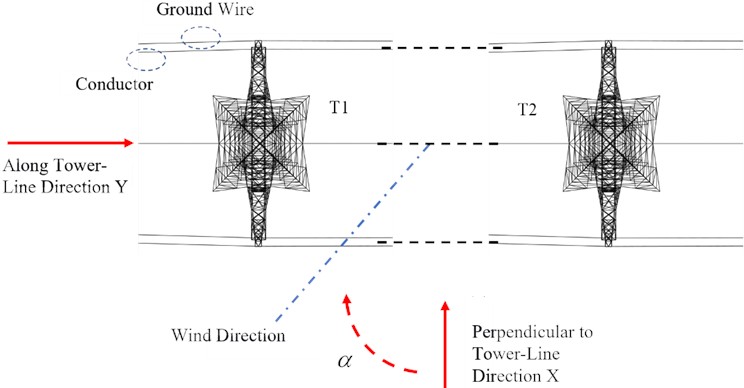
Table 7Simulation parameters of time-varying wind time history
(m/s) | (m/s) | (m) | (m) |
47 | 10 | 1000 | 700 |
Fig. 12. presents the wind speed time histories at the simulated points of segments 8 of transmission tower under the downburst, along with a comparison between the target wind spectrum and the simulated spectrum at these points. As shown in the Fig. 12, the trend of the wind speed time history aligns with the storm movement pattern, and the simulated fluctuating wind spectrum exhibits good overall agreement with the target spectrum. This validates the effectiveness of the wind speed time history simulation, confirming its suitability for subsequent analysis.
Fig. 12Wind speed time history simulation and rationality verification
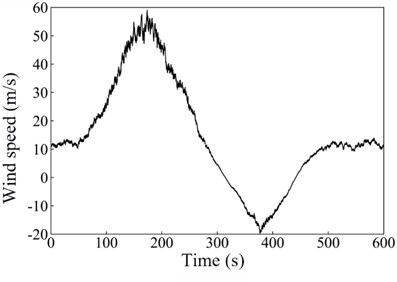
a) Downburst wind speed time history
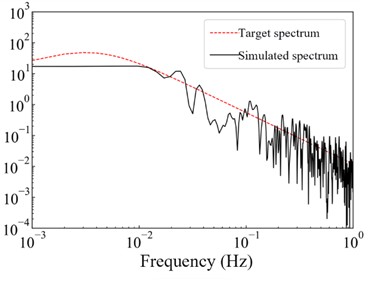
b) Comparison between target spectrum and simulated spectrum
3.2. Dynamic response analysis tower-line system
3.2.1. Parametric analysis of dynamic response
The maximum wind speed () and its corresponding height () are selected to characterize the downburst's wall-jet profile. Based on meteorological records, is evaluated from 25 to 100 m/s; lower speeds cause no plastic damage, while higher speeds are redundant post-collapse. To capture localized shear on the 169 m tower, ranges from 40 to 200 m. Heights below 40 m (distorted by ground friction) and above 200 m (bypassing the structure) are excluded to strictly focus on downburst-specific failure mechanisms. Additionally, the wind attack angle is selected because it directly dictates the frontal projection area and aerodynamic coefficients, governing the load transfer from the long-span conductors to the tower. Finally, rainfall intensity is included as it critically alters the multiphase impact forces and the near-ground wind-rain velocity ratio.
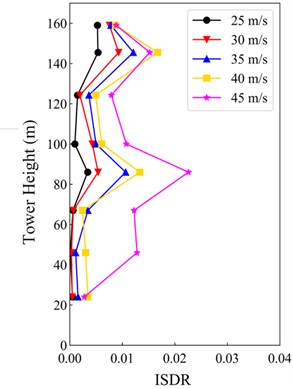
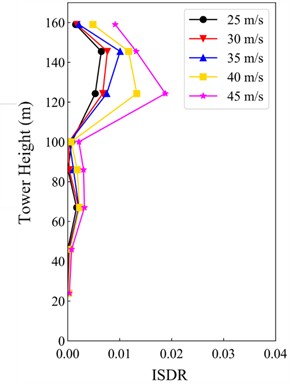
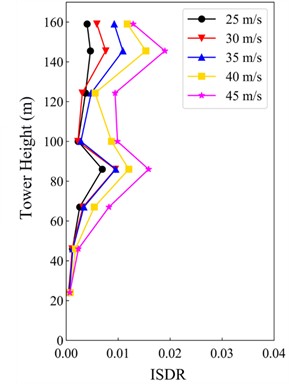
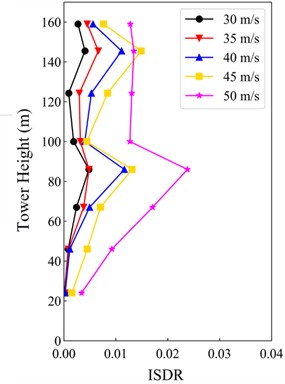
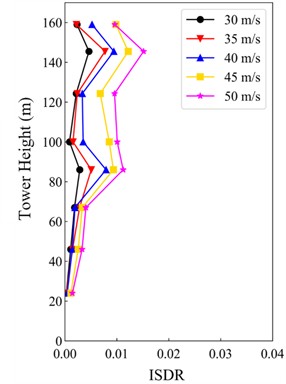
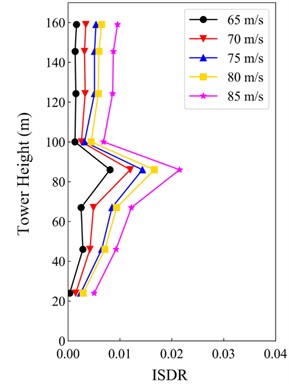
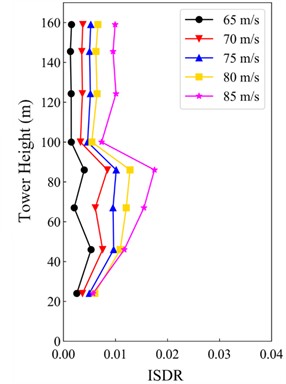
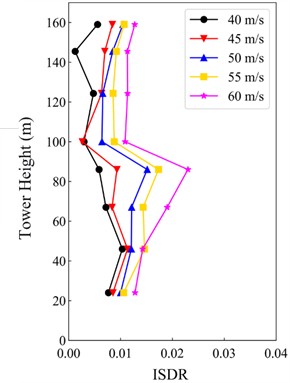
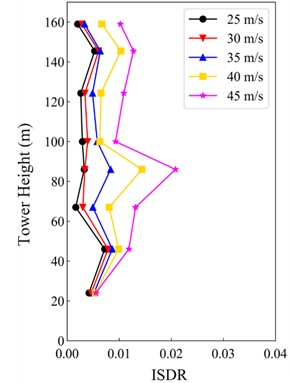
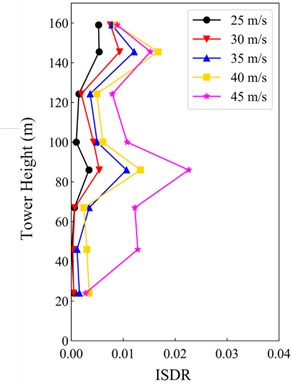
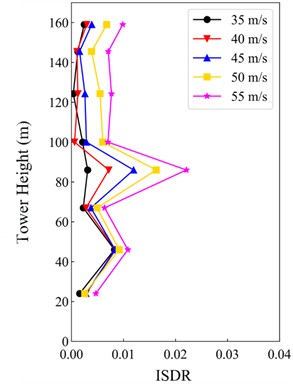
30° wind attack angle (Fig. 14): At low wind speeds, the tower behaves elastically with minimal ISDR increase, and lower segments show smaller ISDR values. At 45 m/s, the ISDR of Segment 4 (86 m) of suddenly exceeds the limit, while the ISDR of increases steadily, with the maximum value occurring in Segment 7. The vulnerable segments are Segment 4 for and Segment 7 for , with Segment 7 exhibiting relatively large ISDR values and Segment 4 of showing a sudden jump. At 45 m/s, the maximum ISDR of is 0.0226, leading to collapse in the middle section of the tower, while that of is 0.0190, 15.9 % lower than , with no collapse despite a sudden change at the tower top. 45° wind attack angle (Fig. 15): At low wind speeds, the tower remains elastic with minimal ISDR increase, and lower segments exhibit smaller ISDR values. At 50 m/s, the ISDR of Segment 4 (86 m) of T1 suddenly exceeds the limit, while the ISDR of increases steadily, with the maximum value in Segment 7. The vulnerable segments are Segment 4 for and Segment 7 for , with Segment 7 showing relatively large ISDR values. At 50 m/s, the maximum ISDR of is 0.0238, causing collapse in the middle section of the tower, while that of is 0.0152, 36.9 % lower than T1, with no collapse occurring. 90° wind attack angle (Fig. 16.): At the same wind speed, the tower remains elastic, with uniform ISDR variations and small differences between segments. At 85 m/s, the ISDR of Segment 4 (86 m) of both towers exceeds the limit, while Segment 7 shows no significant difference compared to adjacent segments. The vulnerable location for both towers is Segment 4. At 85 m/s, the maximum ISDR of is 0.0215, while that of is 0.0175.
Fig. 13ISDR under 0° wind attack angle
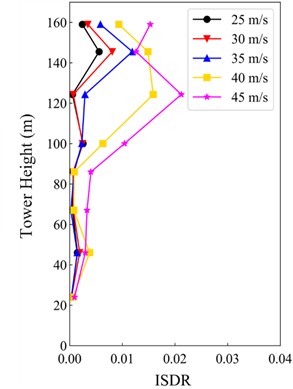
a) Transmission tower
b) Transmission tower
Fig. 14ISDR under 30° wind attack angle
a) Transmission tower
b) Transmission tower
Fig. 15ISDR under 45° wind attack angle
a) Transmission tower
b) Transmission tower
As shown in Fig. 13-16, except for the 0° wind attack angle, the peak ISDR values of transmission tower under other wind attack angles are significantly lower than those of . This is because the initial position of the downburst center is closer to . As the storm center moves, is subjected to the extreme wind-rain load earlier. Over time, the average wind speed in the field gradually decays, resulting in a lower extreme wind-rain load on compared to , which ultimately leads to a smaller structural response in . Therefore, in subsequent analyses, transmission tower , which exhibits larger ISDR values, is selected as the study subject. Under the 0°, 30°, 45°, and 90° wind attack angles, collapse occurs when increases to 45 m/s, 45 m/s, 50 m/s, and 85 m/s, respectively. The tower-line system under the 0° and 30° wind attack angles collapses earliest as the wind speed increases. The maximum ISDR under the 0° wind attack angle is 0.0212, while under the 30° wind attack angle, it is 0.0226. This indicates that the 30° wind attack angle is the most critical for the collapse of the tower-line system and should be given particular attention.
For different reference height conditions, considering the domestic extreme rainfall intensity record of 709.2 mm/h and the most critical wind attack angle of 30°, a simulation duration of 600 s is adopted. The wind speed is gradually increased in 5 m/s increments, and wind-rain loads are applied to the tower-line system to conduct nonlinear dynamic time-history analyses. The dynamic responses of the tower-line system under different values are obtained, and the vulnerable locations are identified through ISDR analysis. The studied transmission tower has a height of 169 m. In this study, values of 40 m, 80 m, 120 m, 160 m, and 200 m are selected for comparative analysis.
Fig. 16ISDR under 90° wind attack angle
a) Transmission tower
b) Transmission tower
Fig. 17. shows the variation of ISDR for different segments of transmission tower T1 under different values. The results indicate that when does not exceed 80 m, the ISDR at the tower leg is generally larger than that at the tower top. When exceeds 80 m, the ISDR at the tower leg is generally smaller than that at the tower top. This demonstrates that has a significant influence on the dynamic response of segments near its height. When = 120 m, the ISDR suddenly increases at Segment 7 (145.5 m), leading to collapse. Under other conditions, the ISDR suddenly increases at Segment 4 (86 m), resulting in collapse. This is consistent with the previous findings, indicating that Segment 4 and Segment 7 are the vulnerable locations under this wind attack angle.
Clearly, under = 40 m, 80 m, 120 m, 160 m, and 200 m, collapse occurs when increases to 60 m/s, 45 m/s, 45 m/s, 50 m/s, and 55 m/s, respectively. The transmission tower is least prone to collapse when = 40 m, while = 80 m and 120 m are critical heights for collapse. The collapse wind speed of the tower-line system first decreases and then increases as increases. The maximum ISDR at = 120 m is 0.0226, while at = 80 m, it is 0.0208, representing an 8.0 % decrease. This indicates that the most critical for the collapse of the tower-line system is 120 m, which should be given particular attention.
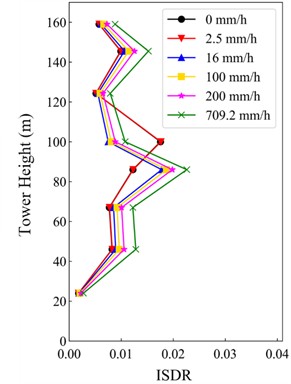
Regarding the influence of rainfall intensity, the most critical wind attack angle of 30° and reference height = 120 m were selected, with a simulation duration of 600 s. Rainfall intensities of 0 mm/h, 2.5 mm/h, 16 mm/h, 100 mm/h, 200 mm/h, and 709.2 mm/h were chosen as different working conditions. Dynamic time-history analysis of the wind-rain-induced vibration response of the tower-line system was conducted based on a wind speed = 45 m/s. Fig. 18 shows the variation of the inter-story drift ratio (ISDR) of transmission tower under different rainfall intensities. The results indicate that as the rainfall intensity increases, the ISDR of the transmission tower gradually increases.
Fig. 17ISDR under different zm
a) =40 m
b) =80 m
c) =120 m
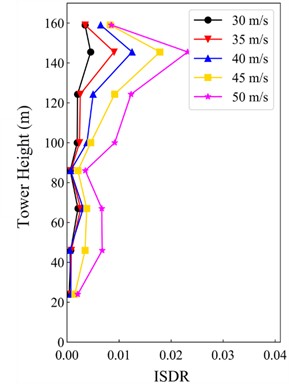
d) =160 m
e) =200 m
When the rainfall intensity increases from 0 mm/h to 2.5 mm/h, the ISDR shows a sudden change at Segment 5 (100 m). When the rainfall intensity exceeds 2.5 mm/h, the location of the sudden ISDR change shifts, occurring at Segment 4 (86 m). This demonstrates that rainfall intensity significantly affects the failure location of the transmission tower segments, with increased rainfall intensity causing the sudden change location to move downward. This is because the reduction in height leads to an increase in the wind-rain velocity ratio, resulting in a much greater increase in rain load on the lower part of the tower compared to the upper part, thereby increasing the likelihood of failure in the lower segments. When the rainfall intensity does not exceed 2.5 mm/h, the maximum ISDR of the transmission tower remains almost unchanged as the rainfall intensity increases, indicating that rain loads are minimal and negligible under light rainfall conditions. However, when the rainfall intensity exceeds 2.5 mm/h, the maximum ISDR of the transmission tower changes more significantly with increasing rainfall intensity. Under downburst wind action alone, the maximum ISDR is 0.0175, while under a rainfall intensity of 709.2 mm/h, the maximum ISDR reaches 0.0226, an increase of 29.1 %. This indicates that the excitation from rain load cannot be ignored and plays a critical role in assessing the wind resistance capacity of the tower-line system.
Fig. 18ISDR under different rainfall intensity
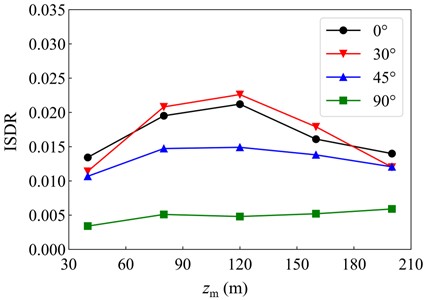
Considering the significant influence of variations in wind attack angle and reference height on the dynamic response of the tower-line system under downburst wind-rain conditions, these two parameters were combined for analysis to further investigate the impact of coupled wind-rain field parameters on the structural response of the transmission line. With set at 45 m/s and rainfall intensity at 709.2 mm/h, four wind attack angles and five conditions were combined, resulting in 20 coupled working conditions of wind attack angle and . Nonlinear dynamic time-history analyses of the tower-line system were conducted for these conditions, and the peak ISDR values extracted from each case are shown in Fig. 19. The results indicate that the maximum ISDR of 0.0226 occurs under the working condition of 30° wind attack angle and = 120 m, identifying this as the most critical condition for the collapse of the tower-line system under combined downburst wind and rain loads. When the wind attack angle is relatively small, the peak ISDR varies considerably with increasing . As the wind attack angle increases, the variation amplitude of the peak ISDR with increasing decreases, and under the 90° wind attack angle, the peak ISDR remains almost constant. Overall, except for the 90° wind attack angle condition, the peak ISDR exhibits a similar trend across other angles, initially increasing and then decreasing with the increase of .
Fig. 19Peak value of ISDR
3.2.2. Study on collapse mechanism
To further investigate the disaster-induced failure mechanisms of the transmission tower-line structure under downburst wind-rain conditions, a study on the collapse failure mechanism of the tower-line structure is conducted. To further analyze the cumulative damage effect of the transmission tower-line system and clarify the process of its progressive collapse, this section quantitatively evaluates the degradation of the structural members. Within the finite element framework, a solution-dependent state variable (SDV4) is defined strictly as a macroscopic damage parameter () to track the material's degradation status [41]. The value of this SDV4 parameter increases progressively with the equivalent plastic strain in a monotonic and irreversible manner. A value of SDV4 = 0 indicates an intact member, whereas SDV4 = 1 signifies that the member has completely fractured and is subsequently removed from the analysis. For full mathematical transparency, the fundamental damage evolution dictating the accumulation of this SDV4 parameter is governed by the ductile damage formulation:
where is the increment of equivalent plastic strain, and is the critical fracture strain of the specific steel grade (Q420 and Q355). By adopting this phenomenological damage parameter, the non-linear degradation mechanism is rigorously captured.
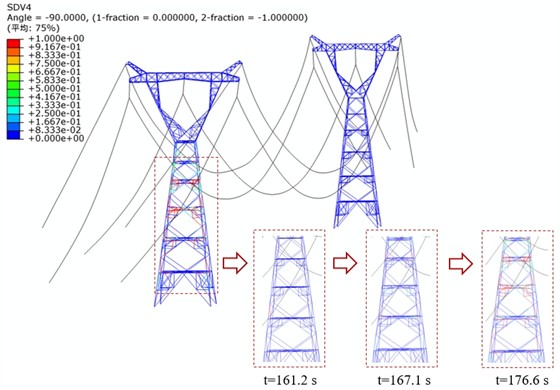
Based on the parametric analysis of dynamic response working conditions, Fig. 20 shows the damage nephograms under different wind attack angles. The failure mode of the transmission tower-line system is as follows: first, the increasing wind-rain load causes the accumulation of internal member forces and deformations, with a small number of bracing members initially entering plastic damage. Some of these bracing members reach a damage value of 1 and are eliminated, triggering internal force redistribution. The stress in surrounding members increases, leading them to enter plasticity, resulting in the failure of a large number of members (including main members) and ultimately the collapse of the tower structure. 0° wind attack angle (Fig. 20(a)): At 232.9 s, bracing members in Segment 7 of incurred damage; At 237.0 s, these bracing members failed; At 245.7 s, a large number of members in Segments 6-7 of failed, the cross-arm was damaged, and the upper tower structure collapsed. exhibited similar damage locations but to a lesser degree, with no collapse occurring. 30° wind attack angle (Fig. 20(b)): At 209.5 s, bracing members in Segments 1-2 of incurred damage; At 222.1 s, these bracing members failed; At 235.4 s, a large number of members in Segments 1-5 of failed, with Segment 4 experiencing the most severe deformation, leading to the collapse of the middle tower section. sustained minor damage with no collapse. 45° wind attack angle (Fig. 20(c)): At 197.2 s, bracing members in Segment 2 of incurred damage; At 201.7 s, bracing members in Segment 3 failed, with multiple surrounding members damaged; At 207.7 s, a large number of members in Segments 1-5 of failed, with Segment 4 experiencing the most severe deformation, causing the middle tower section to collapse. sustained minor damage without collapse. 90° wind attack angle (Fig. 20(d)): At 161.2 s, bracing members in Segment 2 of incurred damage; At 167.1 s, bracing members in Segments 2-4 failed; At 176.6 s, a large number of members in Segments 1-5 of failed, with Segment 4 experiencing the most severe deformation, resulting in the collapse of the middle tower section. sustained relatively minor damage without causing collapse. Under the 0° wind attack angle, the tower collapsed due to large deformations in Segment 6, while under other wind attack angles, severe damage occurred in Segment 4. The damage range in upper segments was small (concentrated in Segments 6-7), while the damage range in middle and lower segments was large (with member failures occurring in Segments 1-5).
The aforementioned collapse processes reveal a fundamental theoretical insight: unlike synoptic atmospheric boundary layer winds, which typically induce static and predictable failure locations, the non-stationary spatiotemporal nature of a downburst dictates a dynamic transfer of critical vulnerable segments.
According to the conclusions in Section 3.2.1, the failure patterns under other conditions are similar to that of = 120 m, while the critical segment is Segment 7 when = 160 m. Therefore, Fig. 21 only presents the damage nephogram of the transmission tower-line system under downburst wind-rain excitation for the = 160 m condition discussed in Section 3.4.2 for analysis. It can be observed that at 194.9 s, bracing members in Segment 7 of transmission tower incurred damage; at 197.9 s, the damage value of the bracing members in Segment 7 reached 1, and they were eliminated from the simulation; at 220.1 s, a large number of members in Segments 1 to 8 of transmission tower failed, with the most severe deformation occurring in Segment 7, ultimately leading to the collapse of the upper tower section as it could no longer bear the load. Transmission tower sustained relatively minor damage and did not collapse. Compared to the = 120 m condition, the range of member failures is larger, indicating a more significant impact of the load on the upper tower structure.
Fig. 20Damage cloud diagram of TTLS under different wind attack angles
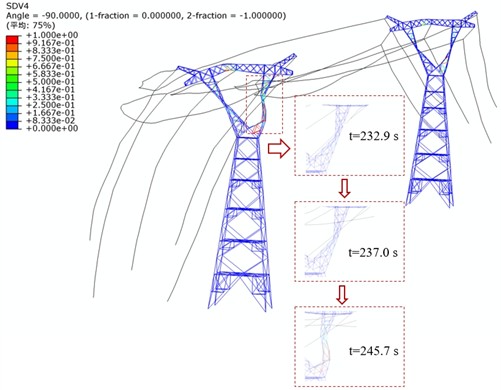
a) Collapse process at 0° wind attack angle
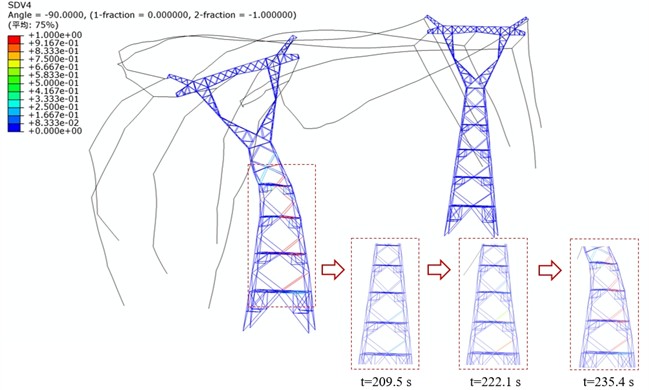
b) Collapse process at 30° wind attack angle
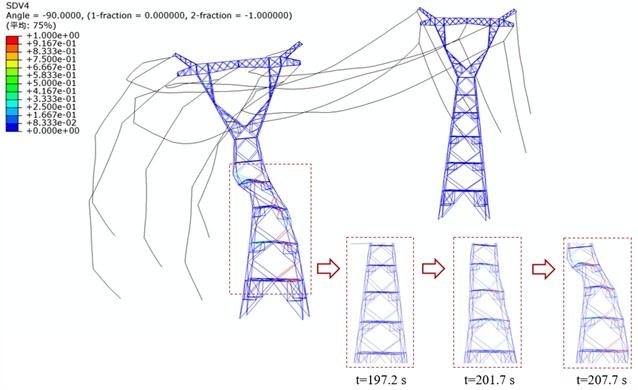
c) Collapse process at 45° wind attack angle
d) Collapse process at 90° wind attack angle
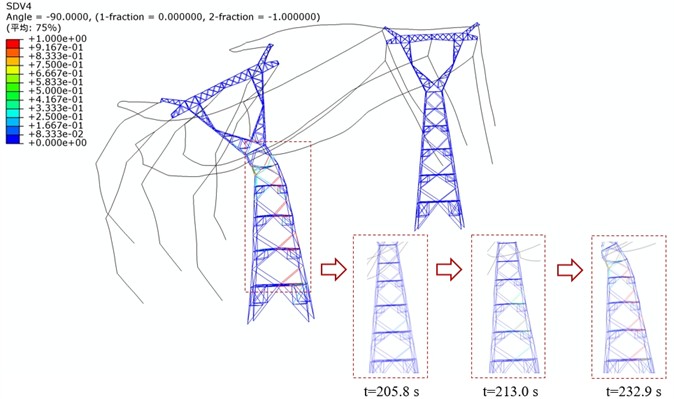
To investigate the influence of rainfall on the collapse process of the tower-line system, Fig. 22. shows the damage nephogram of the system under downburst wind-rain excitation for a rainfall intensity of 0 mm/h. It can be observed that at 205.8 s, bracing members in Segments 1 and 2 of transmission tower incurred damage; at 213.0 s, the damage value of the bracing members in Segment 2 reached 1, and they were eliminated from the simulation; at 232.9 s, a large number of members in Segments 1 to 5 of transmission tower failed, with the most severe deformation occurring in Segment 5, ultimately leading to the collapse of the middle tower section as it could no longer bear the load. Transmission tower sustained relatively minor damage and did not collapse. Compared to the condition with rainfall intensity of 0 mm/h, the range of member failures is similar, and the failure process and redistribution of internal forces are consistent. Therefore, while rainfall significantly amplifies the displacement magnitude, it exerts only a minor influence on the structural failure sequence and internal force redistribution pathways of the tower-line system.
Fig. 21Damage cloud diagram of TTLS when zm =160 m
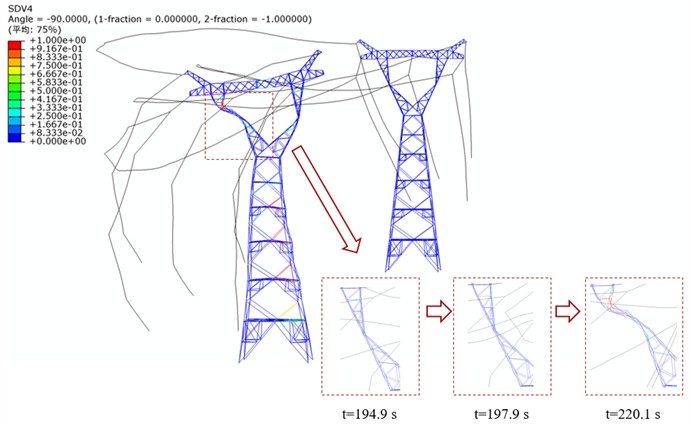
Fig. 22Damage cloud diagram of TTLS when rainfall intensity is 0 mm/h
4. Conclusions
Addressing the limitations of previous studies that either isolated downburst wind loads or restricted wind-rain coupling to standard boundary layer flows, this study established a full-scale three-dimensional computational domain model to simulate the physically distinct downburst wind-rain field, which was further refined using theoretical empirical formulas and measured data. The wind-rain velocity ratio under the downburst wind-rain field was investigated, and a corresponding fitting formula was proposed. Based on an actual engineering project, a parametric analysis of the dynamic response and a study on the collapse mechanism of a transmission tower-line system under a downburst wind-rain field were conducted. The specific conclusions are as follows:
A computational domain model for simulating the wind-rain field was established, and its validity was verified using the Osequera and Bowles model, the Vicroy model, and the Wood model. Considering the variation of wind-rain loads near the ground, the Vicroy model was modified for generating downburst wind-rain loads.
In a downburst, the horizontal velocity of raindrops does not synchronize with changes in wind speed. By constructing two-dimensional raindrop motion equations and setting parameters to calculate the wind-rain velocity ratio under different conditions, it was found that the ratio varies specifically with normalized height and is influenced by raindrop diameter. A fitted wind-rain velocity ratio formula was derived, and its high accuracy was confirmed through comparison with simulated data and evaluation using the root mean square error.
The downburst significantly affects the dynamic response of the tower-line system: Regarding the wind attack angle, T1 responds to extreme load values earlier, making 30° the most critical wind attack angle (collapse at 45 m/s, maximum ISDR 0.0226). A height of 120 m is the most critical, with the collapse wind speed first decreasing and then increasing with height. When the rainfall intensity exceeds 2.5 mm/h, the ISDR increases and the location of sudden change shifts downward. At 709.2 mm/h, the ISDR increases by 29.1 % compared to the no-rain condition. Combined analysis shows that the 30° wind attack angle and 120 m reference height represent the most critical condition (ISDR 0.0226), with Segments 4 and 7 being the most vulnerable sections of the tower.
The collapse failure mode of the transmission line is as follows: Increasing wind-rain loads cause initial damage and failure of bracing members, leading to redistribution of internal forces in the tower and subsequent failure of a large number of members, resulting in collapse. In terms of wind attack angle, collapses at Segment 6 under 0°, but at Segment 4 under other wind attack angles. The damage range is smaller in the upper segments and larger in the middle and lower segments. At a reference height of 160 m, the vulnerable segment of is Segment 7, and the failure range is larger than under the 120 m condition. Regarding rainfall effects, extreme rainfall significantly amplifies the magnitude of the structural dynamic response (increasing the peak ISDR by 29.1 %). However, it exerts a minor influence on the macroscopic topological sequence of the progressive collapse, as the fundamental failure path and internal force redistribution remain consistent with the no-rain scenario.
Finally, the findings of this study offer direct and critical guidance for engineering practice. The identification of 30° as the most unfavorable wind attack angle and 120 m as the critical downburst jet height provides a solid theoretical basis for refining current wind resistance design specifications for power transmission lines. Furthermore, revealing that the structural vulnerable points dynamically shift, specifically highlighting Segments 4 and 7 as the most critical sections under coupled wind-rain conditions, offers a highly targeted framework for the vulnerability assessment and structural retrofitting of existing lines. In practical applications, pinpointing these specific vulnerable segments can directly guide and optimize the sensor layout for Structural Health Monitoring (SHM) systems, ensuring that limited monitoring resources are precisely deployed at the true initiation points of progressive collapse.
References
-
T. T. Fujita, “Manual of downburst identification for Project NIMROD,” NASA, CR-156953, May 1978.
-
J. Mccarthy, J. W. Wilson, and T. T. Fujita, “The joint airport weather studies project,” Bulletin of the American Meteorological Society, Vol. 63, No. 1, pp. 15–15, Jan. 1982, https://doi.org/10.1175/1520-0477(1982)063<0015:tjawsp>2.0.co;2
-
M. R. Hjelmfelt, “Structure and life cycle of microburst outflows observed in Colorado,” Journal of Applied Meteorology, Vol. 27, No. 8, pp. 900–927, Aug. 1988, https://doi.org/10.1175/1520-0450(1988)027<0900:salcom>2.0.co;2
-
C. Zhu, Q. Yang, D. Wang, G. Huang, and S. Liang, “Fragility analysis of transmission towers subjected to downburst winds,” Applied Sciences, Vol. 13, No. 16, p. 9167, Aug. 2023, https://doi.org/10.3390/app13169167
-
Y. Zhong, S. Li, Z. Yan, X. Liu, J. Luo, and W. Jin, “Study on stability of transmission tower-line system under a downburst,” Buildings, Vol. 12, No. 9, p. 1338, Aug. 2022, https://doi.org/10.3390/buildings12091338
-
E.-S. Abd-Elaal, J. E. Mills, and X. Ma, “A review of transmission line systems under downburst wind loads,” Journal of Wind Engineering and Industrial Aerodynamics, Vol. 179, pp. 503–513, Aug. 2018, https://doi.org/10.1016/j.jweia.2018.07.004
-
Z. Fang, Z. Wang, R. Zhu, and H. Huang, “Study on Wind-Induced Response of Transmission Tower-Line System under Downburst Wind,” Buildings, Vol. 12, No. 7, p. 891, Jun. 2022, https://doi.org/10.3390/buildings12070891
-
X. Meng, L. Tian, J. Liu, Q. Jin, and F. Yang, “Wind-ice-induced damage risk analysis for overhead transmission lines considering regional climate characteristics,” Engineering Structures, Vol. 329, p. 119844, Apr. 2025, https://doi.org/10.1016/j.engstruct.2025.119844
-
Z. Wu, Y. Iida, and Y. Uematsu, “The flow fields generated by stationary and travelling downbursts and resultant wind load effects on transmission line structural system,” Journal of Wind Engineering and Industrial Aerodynamics, Vol. 210, p. 104521, Mar. 2021, https://doi.org/10.1016/j.jweia.2021.104521
-
G. Zhang, L. Li, Y. Dong, D. Li, C. Zhou, and J. Liu, “Sensitivity analysis and probabilistic performance assessment of transmission tower-line systems subjected to downbursts,” Advances in Structural Engineering, p. 13694332251375210, Sep. 2025, https://doi.org/10.1177/13694332251375210
-
S. Zhang, K. Guo, Q. Yang, and X. Xu, “Review of wind field characteristics of downbursts and wind effects on structures under their action,” Buildings, Vol. 14, No. 9, p. 2653, Aug. 2024, https://doi.org/10.3390/buildings14092653
-
Y. He, J. Cai, R. Wang, X. He, P. Chan, and J. Fu, “Observation of downburst wind characteristics using the Doppler profiler and near-ground measurements,” Natural Hazards, Vol. 120, No. 5, pp. 4829–4851, 2024, https://doi.org/10.1007/s11069-024-06410-w
-
S. Zhang et al., “Wind field characteristics of the 13 June 2014 downburst event in Beijing based on meteorological tower records,” Atmosphere, Vol. 16, No. 1, p. 27, Dec. 2024, https://doi.org/10.3390/atmos16010027
-
H. Pan, C. Li, H.-N. Li, J. Hu, and R. Ma, “Underwater shaking table test and seismic fragility assessment of free-spanning submarine pipelines under offshore spatial motions,” Thin-Walled Structures, Vol. 213, p. 113276, Aug. 2025, https://doi.org/10.1016/j.tws.2025.113276
-
B. Chen and X. Qian, “Explainable data-driven analysis of uncertainty propagation in 3D concrete printing via adaptive polynomial chaos expansion,” Automation in Construction, Vol. 178, p. 106414, Oct. 2025, https://doi.org/10.1016/j.autcon.2025.106414
-
G. S. Wood, K. C. S. Kwok, N. A. Motteram, and D. F. Fletcher, “Physical and numerical modelling of thunderstorm downbursts,” Journal of Wind Engineering and Industrial Aerodynamics, Vol. 89, No. 6, pp. 535–552, May 2001, https://doi.org/10.1016/s0167-6105(00)00090-8
-
J. D. Holmes and S. E. Oliver, “An empirical model of a downburst,” Engineering Structures, Vol. 22, No. 9, pp. 1167–1172, Sep. 2000, https://doi.org/10.1016/s0141-0296(99)00058-9
-
Z. Xu and H. Hangan, “Scale, boundary and inlet condition effects on impinging jets,” Journal of Wind Engineering and Industrial Aerodynamics, Vol. 96, No. 12, pp. 2383–2402, Dec. 2008, https://doi.org/10.1016/j.jweia.2008.04.002
-
H. Hangan, J.-D. Kim, and Z. Xu, “The simulation of downbursts and its challenges,” in Structures 2004, pp. 1–8, Apr. 2004, https://doi.org/10.1061/40700(2004)170
-
M. S. Mason, G. S. Wood, and D. F. Fletcher, “Numerical investigation of the influence of topography on simulated downburst wind fields,” Journal of Wind Engineering and Industrial Aerodynamics, Vol. 98, No. 1, pp. 21–33, Jan. 2010, https://doi.org/10.1016/j.jweia.2009.08.011
-
A. Sengupta and P. P. Sarkar, “Experimental measurement and numerical simulation of an impinging jet with application to thunderstorm microburst winds,” Journal of Wind Engineering and Industrial Aerodynamics, Vol. 96, No. 3, pp. 345–365, Mar. 2008, https://doi.org/10.1016/j.jweia.2007.09.001
-
D. Romanic, E. Nicolini, H. Hangan, M. Burlando, and G. Solari, “A novel approach to scaling experimentally produced downburst-like impinging jet outflows,” Journal of Wind Engineering and Industrial Aerodynamics, Vol. 196, p. 104025, Jan. 2020, https://doi.org/10.1016/j.jweia.2019.104025
-
Z. Fang, Z. Wang, H. Huang, L. Yang, and Y. Guo, “Numerical simulations of downburst wind fields: A comparative analysis of stationary and moving storms using the impinging jet model,” Physics of Fluids, Vol. 36, No. 8, p. 087162, Aug. 2024, https://doi.org/10.1063/5.0216182
-
Y. Pan, M. Liu, C. Zhang, and Z. Xie, “Temporal variability wind characterization analysis and model construction of moving downbursts,” Physics of Fluids, Vol. 37, No. 1, p. 017178, Jan. 2025, https://doi.org/10.1063/5.0251780
-
H. Dang, G. Xing, H. Wang, D. Harmanto, and W. Yao, “A novel empirical model for vertical profiles of downburst horizontal wind speed,” Wind Energy, Vol. 27, No. 4, pp. 403–424, Jan. 2024, https://doi.org/10.1002/we.2895
-
F. Y. Wang, Y. L. Xu, and W. L. Qu, “Multi-scale failure analysis of transmission towers under downburst loading,” International Journal of Structural Stability and Dynamics, Vol. 18, No. 2, p. 1850029, Feb. 2018, https://doi.org/10.1142/s0219455418500293
-
H.-D. Zheng and J. Fan, “Progressive collapse analysis of a truss transmission tower-line system subjected to downburst loading,” Journal of Constructional Steel Research, Vol. 188, p. 107044, Jan. 2022, https://doi.org/10.1016/j.jcsr.2021.107044
-
C. Zhou, L. Li, and Y. Liu, “Characteristics of rainfall in wind field of a downburst and its effects on motion of high-voltage transmission line,” Shock and Vibration, Vol. 2017, No. 1, pp. 1–11, Jan. 2017, https://doi.org/10.1155/2017/7350369
-
C. Zhou and Y. Liu, “Analytical model of high-voltage transmission line subjected to the downburst wind with rainfall,” Advances in Mechanical Engineering, Vol. 7, No. 3, p. 1687814015575435, Mar. 2015, https://doi.org/10.1177/1687814015575435
-
X. Meng, L. Tian, R. Ma, L. Zhang, J. Liu, and X. Dong, “Typhoon-induced failure analysis of electricity transmission tower-line system incorporating microtopography,” Engineering Failure Analysis, Vol. 163, p. 108556, Sep. 2024, https://doi.org/10.1016/j.engfailanal.2024.108556
-
X. Meng, L. Tian, J. Liu, and Q. Jin, “Framework for assessing the performance of overhead transmission lines under wind-temperature effects,” Journal of Constructional Steel Research, Vol. 220, p. 108838, Sep. 2024, https://doi.org/10.1016/j.jcsr.2024.108838
-
G. Vettoretto, Z. Li, and C. Affolter, “Evaluation of the ultimate collapse load of a high-voltage transmission tower under excessive wind loads,” Buildings, Vol. 13, No. 2, p. 513, Feb. 2023, https://doi.org/10.3390/buildings13020513
-
B. Asgarian, S. Dadras Eslamlou, A. E. Zaghi, and M. Mehr, “Progressive collapse analysis of power transmission towers,” Journal of Constructional Steel Research, Vol. 123, pp. 31–40, Aug. 2016, https://doi.org/10.1016/j.jcsr.2016.04.021
-
Y. Mohammadi Darestani, A. Shafieezadeh, and K. Cha, “Effect of modelling complexities on extreme wind hazard performance of steel lattice transmission towers,” Structure and Infrastructure Engineering, Vol. 16, No. 6, pp. 898–915, Jun. 2020, https://doi.org/10.1080/15732479.2019.1673783
-
L. Tian, Y.-J. Zeng, and X. Fu, “Velocity ratio of wind-driven rain and its application on a transmission tower subjected to wind and rain loads,” Journal of Performance of Constructed Facilities, Vol. 32, No. 5, p. 04018065, Oct. 2018, https://doi.org/10.1061/(asce)cf.1943-5509.0001210
-
R. M. Oseguera and R. L. Bowles, “A simple, analytic 3-dimensional downburst model based on boundary layer stagnation flow,” NASA, TM-100632, Jul. 1988.
-
D. D. Vicroy, “A simple, analytical, axisymmetric microburst model for downdraft estimation,” NASA, TM-104053, Feb. 1991.
-
R. Gunn and G. D. Kinzer, “The terminal velocity of fall for water droplets in stagnant air,” Journal of Meteorology, Vol. 6, No. 4, pp. 243–248, Aug. 1949, https://doi.org/10.1175/1520-0469(1949)006%3c0243:ttvoff%3e2.0.co;2
-
W. Bi, L. Tian, X. Dong, and J. Wang, “Experimental study on rain-wind-induced vibration of overhead transmission line conductors,” International Journal of Structural Stability and Dynamics, Vol. 26, No. 10, May 2026, https://doi.org/10.1142/s0219455426500690
-
L. Tian, X. Zhang, and X. Fu, “Collapse simulations of communication tower subjected to wind loads using dynamic explicit method,” Journal of Performance of Constructed Facilities, Vol. 34, No. 3, p. 04020024, Jun. 2020, https://doi.org/10.1061/(asce)cf.1943-5509.0001434
-
G.-D. Shao et al., “Seismic performance and collapse fragility of a 765 kV transmission tower-line system,” Buildings, Vol. 15, No. 22, p. 4206, Nov. 2025, https://doi.org/10.3390/buildings15224206
About this article

The authors have not disclosed any funding.
The datasets generated during and/or analyzed during the current study are available from the corresponding author on reasonable request.
Guodong Shao: data curation, formal analysis, writing-original draft preparation, and software. Chongyang Zhang: formal analysis, investigation, and software. Yuanchao Jia: formal analysis, investigation, and software. Mingxuan Zhu: investigation, data curation. Syed Hassan Farooq: formal analysis, data curation. Oryngozhin Yernaz: formal analysis, data curation. Zhengyu Ren: writing-original draft, software, and formal analysis. Siyao Zhang: methodology, writing-review and editing, investigation, and validation. Juncai Liu: conceptualization, writing-review and editing, visualization.
The authors declare that they have no conflict of interest.
