Abstract
When dealing with complex spatiotemporal patterns affected by multi-factor coupling, there are significant limitations in the cross-layer feature fusion ability of the model, making it difficult to effectively handle the high-dimensional spatiotemporal correlations and redundant information in building energy consumption data, resulting in insufficient capture of the multi-scale dynamic changes in the spatiotemporal features of regional building energy consumption. Therefore, a method for extracting spatiotemporal features of regional building energy consumption combining Residual Network (ResNet) and convolutional attention mechanism is proposed. First, the multi-layer structure of the residual network is used to extract the temporal and spatial features of building energy consumption respectively, and skip connections and downsampling modules are used to enhance the cross-layer feature fusion ability of the model. Then, a graph attention module and a channel attention mechanism are introduced. Taking the building monitoring area as nodes and the energy consumption correlation as edges, the weight distribution of key spatiotemporal features is dynamically learned, so as to suppress redundant information and strengthen the feature expression ability. Finally, the advancement of the proposed method is verified through experiments. The experimental results show that this method can accurately capture the hourly fluctuation law and spatial heterogeneity of building energy consumption, with a prediction deviation as low as 2.41 % and an average energy saving rate of 33.20 %, significantly superior to the traditional U-Net encoder and histogram analysis method, and has good application effects.
Highlights
- ResNet–attention fusion method: A spatiotemporal feature extraction approach combines ResNet with convolutional attention, using multi-layer structures, skip connections, and downsampling to strengthen cross-layer feature fusion in building energy data.
- Dynamic attention weighting: A graph attention module and channel attention mechanism treat monitoring areas as nodes and energy correlations as edges, dynamically weighting key spatiotemporal features to suppress redundancy and enhance expression.
- Verified accuracy and savings: Experiments show the method captures hourly fluctuations and spatial heterogeneity, with prediction deviation as low as 2.41% and average energy savings of 33.20%, outperforming U-Net and histogram methods.
1. Introduction
As a key variable in the urban energy structure, the dynamic change law of regional building energy consumption directly affects the operation efficiency and sustainable development process of the urban energy system. Deeply exploring the spatiotemporal evolution characteristics of building energy consumption can not only reveal the spatial differences in building energy consumption in different regions, but also grasp its dynamic law of change over time. This dual characteristic provides a new research perspective for the refined management of urban energy [1, 2]. By systematically analyzing the spatiotemporal distribution pattern of building energy consumption, the generation mechanism and development trend of abnormal energy consumption can be accurately identified, providing a scientific basis for optimizing the urban energy allocation. Current research shows that considering the influence of multiple parameters such as building form, usage function and environmental factors can more accurately predict the change law of building energy consumption [3]. This analysis method based on spatiotemporal features not only provides technical support for formulating differentiated building energy-saving policies but also lays a theoretical foundation for constructing a smart energy management system. In the context of promoting green and low-carbon development, in-depth study of the spatiotemporal features of energy consumption is of great practical significance for realizing the optimization and upgrading of the urban energy system.
In response to the above challenges, many scholars have conducted research and achieved certain results. Traditional statistical methods such as histogram analysis and time series fitting are simple and interpretable but fail to capture nonlinear spatiotemporal variations and multi-source data coupling effects. Physical mechanism models represented by EnergyPlus and DeST boast clear physical interpretability yet rely on detailed building parameters and suffer from high modeling costs, making them unsuitable for large-scale regional building clusters. Conventional machine learning methods including support vector regression and random forest can alleviate partial nonlinear fitting problems but lack explicit spatiotemporal modeling structures and exhibit limited capabilities in mining deep correlations. In recent years, deep learning methods such as improved U-Net encoders, deep self-organizing mapping networks, and graph neural networks have been gradually applied. Nevertheless, existing methods still suffer from insufficient cross-layer feature fusion, weak ability to capture multi-scale dynamic spatiotemporal changes, poor suppression of redundant information, and inadequate handling of multi-source heterogeneous data, leading to limited accuracy in characterizing the spatiotemporal evolution of regional building energy consumption.
However, regional building energy consumption data presents obvious spatiotemporal heterogeneity, multi-factor coupling and high-dimensional redundancy characteristics, and the core research problem to be solved in this paper is: traditional methods have weak cross-layer feature fusion ability, cannot effectively mine high-dimensional spatiotemporal correlation of energy consumption data, fail to suppress redundant information, and cannot capture multi-scale dynamic changes of spatiotemporal features, resulting in large deviation of energy consumption prediction and low efficiency of energy-saving management. In response to the above challenges, many scholars have conducted research and achieved certain research results. For example, Farhadi, H. et al. [4] first collected Sentinel-1, Sentinel-2, and SRTM digital elevation model (DEM) data of regional buildings to construct a spatio-temporal data cube containing radar backscattering characteristics, spectral indices, and terrain information. Then, a new radar index was calculated based on Sentinel-1 data, and the distribution characteristics of NRI were quantified through histogram analysis. Combining the unimodal threshold technique, the optimal segmentation threshold was dynamically determined to extract the spatio-temporal distribution of primary building footprints. Vegetation indices, water body indices, and building indices were calculated using Sentinel-2 images to construct a multi-dimensional spectral feature set for characterizing the potential impact of the building’s surrounding environment on energy consumption. Finally, the spatio-temporal distribution of primary building footprints was spatially overlaid with the spectral feature set to generate a composite feature map integrating radar-spectral-terrain to effectively extract the energy consumption characteristics of regional buildings. The unimodal threshold technique in this method has insufficient segmentation robustness for complex scenarios where high-density building areas coexist with low-density suburbs, and its cross-layer feature fusion ability is not strong enough to handle the multi-modal characteristics presented in mixed pixels such as the intersection of buildings and roads, affecting the final extraction effect of the spatio-temporal characteristics of regional building energy consumption. Another example is Sakkari, M. et al. [5]. They first collected multi-source spatio-temporal data of regional buildings, generated spatio-temporal data patches with different resolutions through a dynamic subsampling module, constructed multiple groups of parallel deep self-organizing mapping networks, each corresponding to a specific spatial scale or time scale. Through a competitive learning mechanism, the input data was mapped to a low-dimensional topological space to generate a discretized feature representation. Then, a convolutional autoencoder was introduced between the input layer and the output layer of each group of deep self-organizing mapping networks. Finally, the spatio-temporal characteristics of regional buildings were compactly reconstructed and input into the energy consumption prediction model to complete the mapping from the spatio-temporal characteristics of regional buildings to energy consumption values. This method independently learns the spatio-temporal characteristics of regional buildings at different scales through deep self-organizing mapping networks, without considering the interaction relationship between the spatio-temporal characteristics of regional buildings at different scales. The redundancy problem in the finally extracted spatio-temporal characteristics of regional building energy consumption has not been solved, and the application effect is not good. Vijayan, L. et al. [6] first adopted an improved U-Net encoder structure, input multi-source spatio-temporal data of regional buildings, and gradually extracted spatio-temporal characteristics from local to global through stacked convolutional layers. Then, an enhanced multi-scale feature fusion module was introduced at the lowest layer of the encoder. Dilated convolutions with different dilation rates were applied to the input feature map to capture multi-scale context. The features were dynamically weighted through lightweight atrous spatial pyramid pooling and channel spatial attention mechanisms to highlight energy consumption sensitive areas and extract fine-grained spatio-temporal characteristics. Finally, the feature map was divided into multiple subgroups through grouped convolutions, and each group independently learned the channel weights to capture the differences in energy consumption contributions of features at different scales. Deformable convolutions were introduced to focus the spatial attention on energy consumption abnormal areas, and a feature vector integrating multi-scale spatio-temporal information was output. The enhanced multi-scale feature fusion module applied in this method depends on the fine-grained features of the lowest encoder layer, is vulnerable to noise interference in regional building energy consumption, and may introduce biases during the fusion process, affecting the accuracy of the finally extracted spatio-temporal characteristics of regional building energy consumption. Chauhan, N. et al. [7] first used a drone equipped with a high-resolution sensor to synchronously collect multi-source spatio-temporal data of regional buildings. An object-based image analysis method was adopted. For different feature types of buildings and roads, the optimal segmentation scale and shape factor were respectively defined. Similar feature objects were merged into larger units through a region merging algorithm to reduce the complexity of subsequent analysis. Then, multi-dimensional spatio-temporal characteristics of the segmented objects were extracted, including geometric characteristics, elevation characteristics, temporal characteristics, etc. The fractal dimension of the object boundary was calculated through the box-counting method to quantify the boundary complexity. Finally, the screened object features were input into a lightweight graph neural network to achieve the mapping from spatio-temporal characteristics to energy consumption values. Fixed segmentation parameters were adopted in this method, but the building density varies significantly in different regions, which may lead to situations such as dense buildings being merged or single buildings being split. Moreover, it did not solve the problem of redundant information, affecting the effect of subsequent extraction of spatio-temporal characteristics of regional building energy consumption.
Although the aforementioned methods have advanced the extraction of spatiotemporal features in building energy consumption to some extent, their comparisons remain largely confined to traditional baselines such as U-Net encoders and histogram analysis, lacking systematic benchmarking against more sophisticated spatiotemporal sequence prediction architectures. Recent studies have demonstrated that attention-enhanced recurrent networks can significantly improve state estimation accuracy under parameter-adaptive schemes, as exemplified by Jin et al. [8], who proposed a parameter-adaptive, non-model-based state estimation method combining an attention mechanism with LSTM, providing strong theoretical support for modeling spatiotemporal dynamics in non-stationary environments. Furthermore, dual-attention mechanisms have proven effective in visual monitoring tasks, where Ahmad et al. [9] adopted a dual-attention-driven optimized YOLOv5 framework, achieving superior detection performance compared to classic YOLO variants, suggesting that similar attention strategies could enhance feature discrimination in building energy consumption analysis. In the domain of video action recognition, Wang and Yi [10] designed a spatiotemporal feature soft correlation concatenation aggregation structure capable of capturing fine-grained temporal dependencies while suppressing redundant information, offering methodological insights for handling high-dimensional energy consumption sequences. Additionally, federated learning mechanisms have recently been employed for privacy-preserving feature optimization, as demonstrated by Wang et al. [11], who realized federated learning privacy protection via training randomness, expanding the theoretical toolbox for collaborative spatiotemporal modeling across distributed building data sources. Collectively, these advanced spatiotemporal sequence prediction models address several key limitations of prior arts – such as weak cross-scale interaction, insufficient attention to dynamic correlations, and lack of adaptability to heterogeneous data – yet they have not been systematically explored for regional building energy consumption feature extraction.
This paper proposes an innovative regional building energy consumption spatiotemporal feature extraction method to address the shortcomings of existing methods in cross-layer feature fusion, multi-scale dynamic feature capture, redundant information suppression, and poor adaptability to spatiotemporal heterogeneity of building energy consumption. The core innovation of this study lies in: 1) proposing a “divide and conquer fusion” paradigm for spatiotemporal feature processing, innovatively coupling residual networks (ResNet) with convolutional attention mechanisms (CBAM) in depth, rather than simply series or parallel. By independently and fully learning the periodic fluctuation characteristics and spatial distribution heterogeneity characteristics of time series through residual networks, and then using attention mechanisms for adaptive weight fusion, the problem of spatiotemporal feature interference or insufficient fusion in traditional methods is solved. 2) A dynamic attention learning mechanism for building energy consumption spatiotemporal maps has been designed. Unlike general graph attention networks, this paper explicitly defines a graph structure with building entities as nodes and multi-dimensional correlations as edges, and dynamically calculates attention weights on this structure, enabling the model to accurately capture the energy interactions and dependencies between building clusters that evolve over time, achieving true spatiotemporal collaborative modeling. I hope to use this research to extract key parts of the spatiotemporal characteristics of regional building energy consumption, providing good data support for subsequent analysis of regional building energy consumption.
2. Spatio-temporal feature extraction of regional building energy consumption
Spatio-Temporal Analysis and Data Acquisition of Regional Building Energy Consumption
Regional building energy consumption refers to the total amount of energy consumed by various buildings in a specific region during operation. Conducting spatio-temporal analysis of regional building energy consumption can clarify the impact of time-dimensional and space-dimensional related data on regional building energy consumption [12-14], which helps with subsequent extraction of spatio-temporal characteristics of regional building energy consumption. This paper conducts analysis from the time dimension and the space dimension respectively, as follows.
2.1. Time dimension analysis and data acquisition of regional building energy consumption
Analyzing the impact of building operation data in different time dimensions on regional building energy consumption can reveal the dynamic change law of regional building energy consumption over time [15]. The results of the actual time dimension analysis and data collection of regional building energy consumption are shown in Table 1.
As shown in Table 1, the time dimension data affecting regional building energy consumption can be obtained, providing time dimension information for subsequent extraction of spatio-temporal characteristics of regional building energy consumption.
Table 1Time dimension analysis and data collection of regional building energy consumption
Time scale | Data | Details |
Diurnal variation | Duration of sunlight x1 | The duration of direct sunlight on the ground within a day determines the energy consumption for lighting and heating |
Temperature difference between indoors and outdoors x2 | The difference between the indoor design temperature and the real-time outdoor temperature determines the energy consumption for heating | |
Staff working hours x3 | The activity patterns of users within a building determine the energy consumption of equipment such as lighting and air conditioning | |
Weekly variation | Social activity model x4 | The energy consumption of buildings varies significantly between weekdays and weekends, with office buildings consuming more energy on weekdays |
Commercial economic behavior x5 | Commercial and residential buildings consume more energy on weekends | |
Seasonal variation | Temperature x6 | Atmospheric temperature determines the energy consumption of buildings that require air conditioning for cooling or heating |
Humidity x7 | The water vapor content in the air determines the energy consumption of dehumidification and humidification equipment | |
Solar radiation x8 | The energy directly emitted by the sun on the ground determines the energy consumption for heating |
2.2. Space dimension analysis and data acquisition of regional building energy consumption
In order to reveal the geographical distribution characteristics, spatial aggregation patterns and regional differences of building energy consumption, a space dimension analysis of regional building energy consumption is carried out, which can effectively explore the impact of building space dimension data on regional building energy consumption. Thus, the results of the space dimension analysis and data collection of regional building energy consumption are shown in Table 2.
As shown in Table 2, the results of the space dimension analysis and data collection of regional building energy consumption can obtain the spatial distribution factors affecting regional building energy consumption, providing space dimension information for subsequent extraction of spatio-temporal characteristics of regional building energy consumption.
Table 2Spatial dimension analysis and data collection of regional building energy consumption
Spatial scale | Data | Details |
Energy consumption intensity | Energy consumption intensity x9 | The total energy consumption per unit area of a building |
Heating heat consumption x10 | The heat consumed by a building space to provide heat and achieve a suitable indoor temperature and humidity environment | |
Building characteristic indicators | Architectural category x11 | Various types of buildings such as commercial buildings, residential buildings, and office buildings |
Exterior wall structure x12 | The design structure of the exterior walls of buildings | |
Building height x13 | The height of a building affects its thermal balance | |
Orientation of the building x14 | It is usually oriented in a north-south or east-west direction, which affects the duration of daylight | |
Window-to-wall ratio x15 | The ratio of the area of the window opening to the total area of the facade facing that direction affects the indoor temperature loss value |
2.3. Spatio-temporal feature extraction of regional building energy consumption based on residual network and convolutional attention mechanism
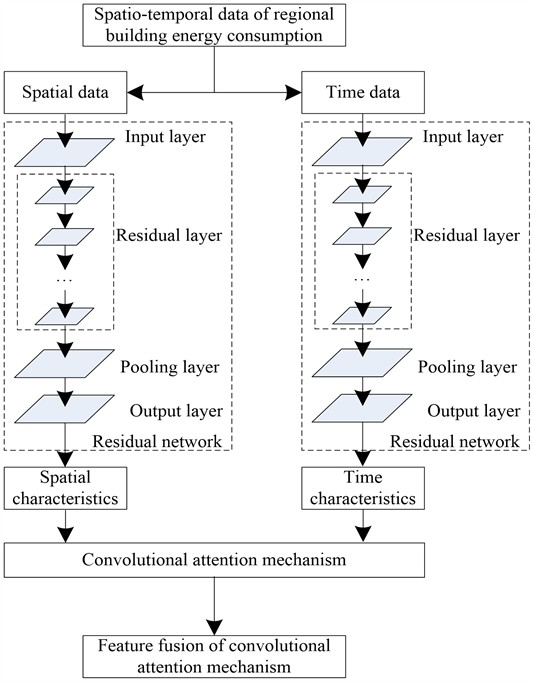
According to the collection method in Subsection 2.1, the spatial distribution characteristics and time series data of regional building energy consumption can be obtained. These data have significant multi-scale characteristics and non-linear features, which can reflect the dynamic evolution law of the building group in the time dimension and the heterogeneous distribution characteristics in the spatial dimension. In response to the feature extraction requirements of such complex spatio-temporal data, this study uses the Residual Network (ResNet) as the basic architecture. This network effectively alleviates the problem of gradient disappearance in deep networks through skip connections, and can adaptively extract spatio-temporal features of different scales in building energy consumption data and completely retain its multi-level feature information [16, 17]. At the same time, considering the periodic fluctuations of building energy consumption in the time dimension and the heterogeneous distribution in the spatial dimension, the Convolutional Block Attention Module (CBAM) is introduced to enhance the feature extraction ability of the model - this mechanism focuses on key feature channels through the channel attention module and locates important regional features through the spatial attention module, so as to achieve the collaborative capture of local details and global patterns in the spatio-temporal data of regional building energy consumption [18]. To overcome the shortcomings of existing methods in spatiotemporal feature fusion, multi-scale capture, and redundancy suppression, this study innovatively designed the integration method of ResNet and CBAM, and constructed the ResNet CBM fusion model as shown in Fig. 1. Its innovation is mainly reflected in the following three aspects: firstly, parallel dual stream residual networks are used to process time series data and spatial raster data separately, and the deep network independently learns temporal dynamic patterns and spatial structural features, avoiding feature confusion that may be caused by early fusion. Then, innovatively mapping the extracted spatiotemporal features into a “building energy consumption spatiotemporal graph”, where nodes are building entities, node attributes are their temporal features, and edge weights are dynamically calculated based on the spatial distance, functional similarity, and historical energy consumption correlation between buildings [19]. Finally, a two-stage attention fusion mechanism was designed: in the first stage, a Graph Attention Network (GAT) was applied to the graph structure to learn dynamic spatial dependencies between nodes; In the second stage, channel attention (CBAM) is applied to the feature map output by GAT, and the weights of each feature channel are adaptively recalibrated to enhance the most critical dimension for energy consumption prediction. The architecture of “independent extraction → graph structure modeling → attention collaborative optimization” is the core of this method for achieving high-precision feature extraction.
As shown in Fig. 1, the obtained initial spatio-temporal data of regional building energy consumption is represented as , which is divided into time data and spatial data . Feature extraction is carried out respectively according to the residual network, and finally the spatio-temporal features of regional building energy consumption are fused through the convolutional attention mechanism. The specific design is as follows:
The proposed method is grounded in graph neural networks (GNNs) and residual learning. GNNs provide a principled framework for modeling non-Euclidean relationships in urban systems, where buildings serve as nodes and their dependencies – such as spatial proximity, functional similarity, and shared infrastructure – are represented as edges [20]. Through iterative message passing, each node aggregates information from its neighbors, enabling the capture of spatial autocorrelation, indirect dependencies, and time-varying interactions among buildings. Residual networks, on the other hand, address the vanishing gradient problem in deep architectures via skip connections, allowing the effective extraction of multi-scale temporal patterns and hierarchical spatial features from individual building data [21]. The synergy of these two components lies in their complementarity: residual networks extract deep, fine-grained features from each building, while graph attention mechanisms model higher-order interactions across buildings, with the two-stage attention mechanism providing adaptive feature fusion tailored to spatiotemporal data.
Fig. 1Structural framework for spatio-temporal feature extraction of regional building energy consumption
2.4. Spatio-temporal feature extraction of regional building energy consumption based on residual network and convolutional attention mechanism
The residual network is based on the convolutional neural network. The time data and spatial data of regional building energy consumption are respectively input into the input layer of the residual network, and are processed respectively according to the residual layer, pooling layer, and output layer. Finally, the time features and spatial features of regional building energy consumption can be extracted [22]. Convolution operations are performed on the time data and spatial data of regional building energy consumption input into the residual network to deeply extract the features of the time data and spatial data of regional building energy consumption. The results obtained after passing through the convolutional layer are respectively represented as:
where, and respectively represent the results of the time data and space data of the regional building energy consumption at the moment after being processed by the convolutional layer. represents the number of layers of the current layer in the residual network, and respectively represent the time data and space data of the regional building energy consumption of the input layer, represents the convolutional kernel of the layer, represents the convolutional operation, represents the bias of the layer, represents the Swish activation function. Let , , the Swish activation function is expressed as:
where, represents the value of the trainable parameter.
Transmit the preliminarily extracted time and space features of the regional building energy consumption to the residual layer, and use the downsampling residual module for processing. The output results after the residual processing are [23], which are respectively expressed as:
where, and respectively represent the time data of the regional building energy consumption of the th and the space data of the regional building energy consumption of the th input, and both represent the residual mapping amount, and represents the total number of layers of the convolutional layer.
Through the downsampling residual module, the ability of the model to extract fine features in the time and space data of the regional building energy consumption can be effectively improved [24]. Calculate the mapping process of the multi-scale hybrid residual block, which are respectively expressed as:
where, and respectively represent the input of the time data of the regional building energy consumption and the output of the time features of the regional building energy consumption of the residual layer, and respectively represent the input of the space data of the regional building energy consumption and the output of the space features of the regional building energy consumption of the residual layer, and both represent the residual mapping.
The time characteristics and spatial characteristics of regional building energy consumption obtained after processing the residual layer according to the flattening process are converted into a one-dimensional form and output, which are respectively represented as and .
The pooling layer of the residual network extracts the input time characteristics and spatial characteristics of regional building energy consumption through max-pooling to retain more significant time characteristics and spatial characteristics of regional building energy consumption [25], which are respectively represented as:
where, represents the max-pooling processing function.
2.5. Enhancement of key spatiotemporal characteristics of regional building energy consumption based on convolutional attention mechanism
In the designed structural framework for extracting spatiotemporal characteristics of regional building energy consumption, a convolutional attention mechanism is introduced to further enhance the spatiotemporal characteristics of regional building energy consumption extracted by the residual network, thereby strengthening the key spatiotemporal characteristics of regional building energy consumption [26-27]. The convolutional attention mechanism adopted in this paper mainly includes a graph attention module and a channel attention module, and the specific design is as follows:
Firstly, construct the spatiotemporal structure of building energy consumption. In this study, each independent building or a group of buildings with similar energy consumption patterns is defined as a node . The node feature vector is formed by concatenating the temporal features extracted by the residual network from the building’s multi-dimensional time-series energy consumption data and the spatial features extracted from its static attributes (e.g., building type, exterior wall structure, window-to-wall ratio, orientation). The edge between nodes is defined as the energy consumption correlation between buildings, which is determined by integrating spatial distance, functional similarity, and historical energy consumption correlation. The graph structure constructed from this can explicitly model the spatial dependence of building energy consumption. Next, embed the temporal data into the graph attention mechanism. For each time step , the node feature corresponds to its energy consumption related feature representation at that time. The graph attention module dynamically learns the mutual influence weights of different building nodes at different time steps by linearly transforming node features and calculating attention coefficients. Specifically, for nodes and , their attention coefficients are calculated as follows:
Among them, is the learnable weight matrix and is the attention vector. Afterwards, the attention coefficient is normalized using the softmax function:
Ultimately, the updated feature of node at time step is the weighted sum of the features of all its neighboring nodes:
Through the above methods, the graph attention module can simultaneously capture the spatial dependence and dynamic evolution of building energy consumption over time, achieving collaborative modeling of spatiotemporal features. The spatial graph convolution formula is expressed as:
where, represents the graph attention matrix at time , represents the data-driven graph matrix, represents the spatiotemporal feature data of building energy consumption in the input area at time , where exists and represents the convolution weight.
After passing through the graph attention module, the key spatio-temporal features of building energy consumption are initially extracted, and the attention mechanism in the channel domain is further introduced. In the convolutional layer, the contribution of each channel to the extraction of the key spatio-temporal features of regional building energy consumption is different. A weight is added to the signal of each channel to represent the correlation between the channel and the key features. The greater the weight, the higher the correlation of the channel to the extraction of the key spatio-temporal features of regional building energy consumption [28], and more attention needs to be paid to this channel. The structure of the channel attention mechanism is shown in Fig. 2.
Fig. 2Structure of channel attention mechanism
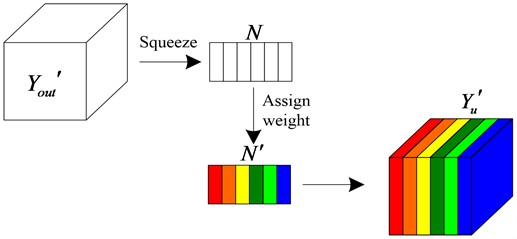
As shown in Fig. 2, is used as the input of the channel attention module for the squeezing operation to realize the embedding of the global information of the key spatio-temporal features of regional building energy consumption, which is expressed as:
where, represents the element of the output matrix . This formula represents the average pooling operation in the time and space dimensions, and is transformed, which is expressed as:
where, and respectively represent the two weight matrices of the fully connected layer, represents the activation function, represents the ReLU activation function. Therefore, needs to be processed by the fully connected layer and the ReLU activation function first, and then processed by the fully connected layer and the sigmoid activation function. Finally, the output matrix is obtained. Multiply by the spatio-temporal feature map of regional building energy consumption and add it to the original output spatio-temporal features of regional building energy consumption in a residual manner to obtain the final output of the channel attention module. Multiply the signals of different channels by the weights to enhance the attention of the key channels of the network and extract more key spatio-temporal features of regional building energy consumption [29, 30].
Based on the introduction of the convolutional attention mechanism, the spatio-temporal features of regional building energy consumption are extracted. By multiplying the input spatio-temporal features of regional building energy consumption with the spatio-temporal feature map of regional building energy consumption , the final spatio-temporal features of regional building energy consumption are obtained, which are expressed as:
where, represents the attention network, and is the key feature result extracted.
Through the above process, effective extraction of spatio-temporal features of regional building energy consumption can be achieved.
3. Experimental analysis
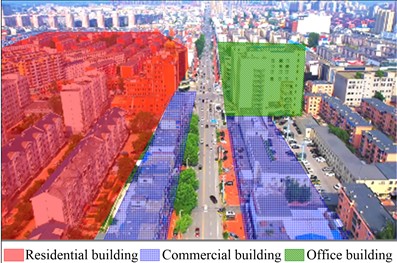
To verify the effectiveness of the proposed method for extracting spatiotemporal features of regional building energy consumption, a study is conducted using buildings in a central urban area of a certain city as an example. The study area covers approximately 12.5 km2 and includes a total of 147 buildings, which are classified into six types: commercial buildings, residential buildings, office buildings, small shop buildings, cultural facility buildings, and mixed-use buildings. Among them, there are 23 commercial buildings, 68 residential buildings, 19 office buildings, 12 small shop buildings, 8 cultural facility buildings, and 17 mixed-use buildings. The dataset spans 24 months, from January 2022 to December 2023, with an hourly temporal resolution. It comprises three categories of features: temporal features, spatial features, and environmental features. Temporal features include hourly energy consumption data and the meteorological variables listed in Table 1. Spatial features include the building attributes listed in Table 2. Environmental features include land cover and surface temperature information extracted from remote sensing data. For data preprocessing, missing data, which account for less than 3 % of the total, are imputed using linear interpolation. All continuous features are normalized using min-max scaling. Temporal features are expanded with lagged variables to capture daily, weekly, and monthly periodic patterns. The dataset is chronologically divided into training, validation, and testing sets, with the first 18 months used for training, the subsequent 3 months for validation, and the final 3 months for testing. Based on the regional building images collected by drones, spatial-related data of the regional buildings are obtained. The actual process of drone collection and the actual scene map of the test area buildings are shown in Fig. 3(a) and 3(b), respectively.
Fig. 3Actual building scene in the test area
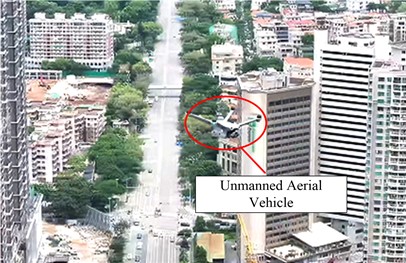
a) UAV acquisition of regional building process
b) Test building type distribution
Based on the actual scene map of the test area buildings shown in Fig. 3, the relevant data of different types of buildings in the test area are obtained, which can provide a good basis for the process of extracting spatio-temporal features of regional building energy consumption. Among them, commercial buildings are mainly distributed on both sides of the main urban roads, showing obvious linear aggregation characteristics, and residential buildings are distributed in a cluster pattern. Taking several buildings as examples randomly, the relevant data of different types of buildings obtained are shown in Table 3.
Table 3Data on different types of buildings
Building type | Land area (m2) | Building area (m2) | Average height (m) | Roof material | Window-to-wall ratio | Building orientation (°) | Average daily energy consumption proxy value (kWh/m2) |
Commercial building | 12500 | 48000 | 38.5 | Glass curtain wall | 0.65 | 135 (Southeast) | 1.2 |
Residential buildings | 3200 | 25600 | 85.2 | Concrete + ceramic tiles | 0.22 | 0(North) | 0.8 |
Office building | 5800 | 23200 | 52.7 | Metal plate | 0.4 | 90(East) | 1 |
Small shop building | 1800 | 3600 | 8.3 | Asphalt shingle | 0.75 | 180(South) | 1.5 |
Cultural facility building | 6500 | 9750 | 22.1 | Antique- style tiles | 0.3 | 45 (Northeast) | 0.6 |
Mixed-use building | 4200 | 16800 | 40 | BIPV | 0.28 | 315 (Northwest) | 0.4 |
Analysis of Table 3 shows that the main data rules are as follows:
Commercial buildings (1.2 kWh/m2): The main reason for high energy consumption is that the large-area glass curtain wall (window-wall ratio of 0.65) leads to significant heat loss, and the southeast orientation (135°) exacerbates the summer cooling load (Fig. 4(b)). It can also be seen from Fig. 3 that the linear aggregation distribution of commercial buildings (on both sides of the main road) forms a heat island effect, further increasing the air-conditioning energy consumption.
Residential buildings (0.8 kWh/m2) have the advantage of low energy consumption: The north-south orientation (0°) optimizes natural lighting, the window-wall ratio is only 0.22, and the ceramic tile exterior wall (the thermal resistance is 3 times higher than that of glass) significantly reduces heat loss (Fig. 4(a)).
Influence of building height: High-rise residential buildings (85.2 m) increase ventilation heat loss due to the chimney effect, but their energy consumption per unit area is still lower than that of commercial buildings, reflecting the dominant role of the insulation performance of the envelope structure.
Mixed-use building: The application of BIPV materials (Building Integrated Photovoltaic) reduces energy consumption to 0.4 kWh/m2, verifying the regulatory effect of renewable energy integration on energy consumption.
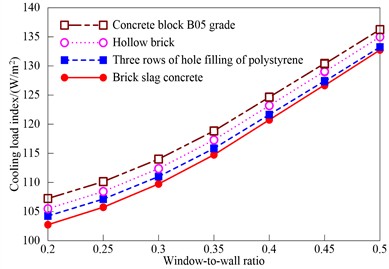
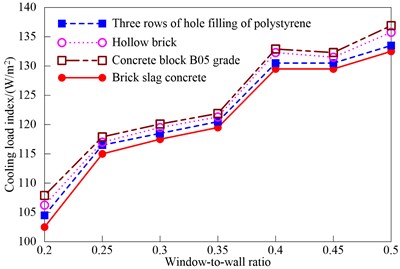
Taking 4 different types of exterior wall structures, namely concrete block B05 grade, hollow brick, three-row holes filled with polystyrene board, and brick slag concrete, as examples, and taking the window-wall ratio characteristics extracted as an example, when simulating different window-wall ratios, the changes in the cooling load indexes of residential buildings and office buildings are statistically analyzed, and the results obtained are shown in Fig. 4.
As shown in Fig. 4, the cooling loads of all exterior wall materials increase significantly with the increase of the window-wall ratio. For every 0.05 increase in the window-wall ratio, the average cooling load increases by approximately 5-15W/m2. When the exterior wall structure is three rows of holes filled with polystyrene boards and the window-wall ratio is 0.5, the cooling load of residential buildings is only about 110W/m2, and that of office buildings is about 120W/m2, significantly lower than that of other exterior wall structure materials. When the window-wall ratio ≤ 0.3, the increase in the cooling loads of all exterior wall structure materials is relatively gentle. When the window-wall ratio > 0.4, the cooling load increases rapidly. In-depth analysis of these experimental data can lead to an important conclusion: As an important parameter of the building envelope, there is a clear and stable quantitative relationship between the window-wall ratio and the cooling load, which makes the window-wall ratio fully capable of serving as a key indicator to characterize the spatio-temporal characteristics of regional building energy consumption. This characteristic relationship not only helps to accurately understand the formation mechanism of building energy consumption, but also provides reliable input parameters for subsequent building energy consumption prediction models. At the same time, these findings also provide direct energy-saving references for building design. Especially in hot southern regions, reasonably controlling the window-wall ratio and optimizing the exterior wall structure will become an important technical approach to reduce the air-conditioning energy consumption of buildings.
Fig. 4Cooling load indexes of buildings with different exterior wall structures under different window-wall ratios
a) Residential building
b) Office building
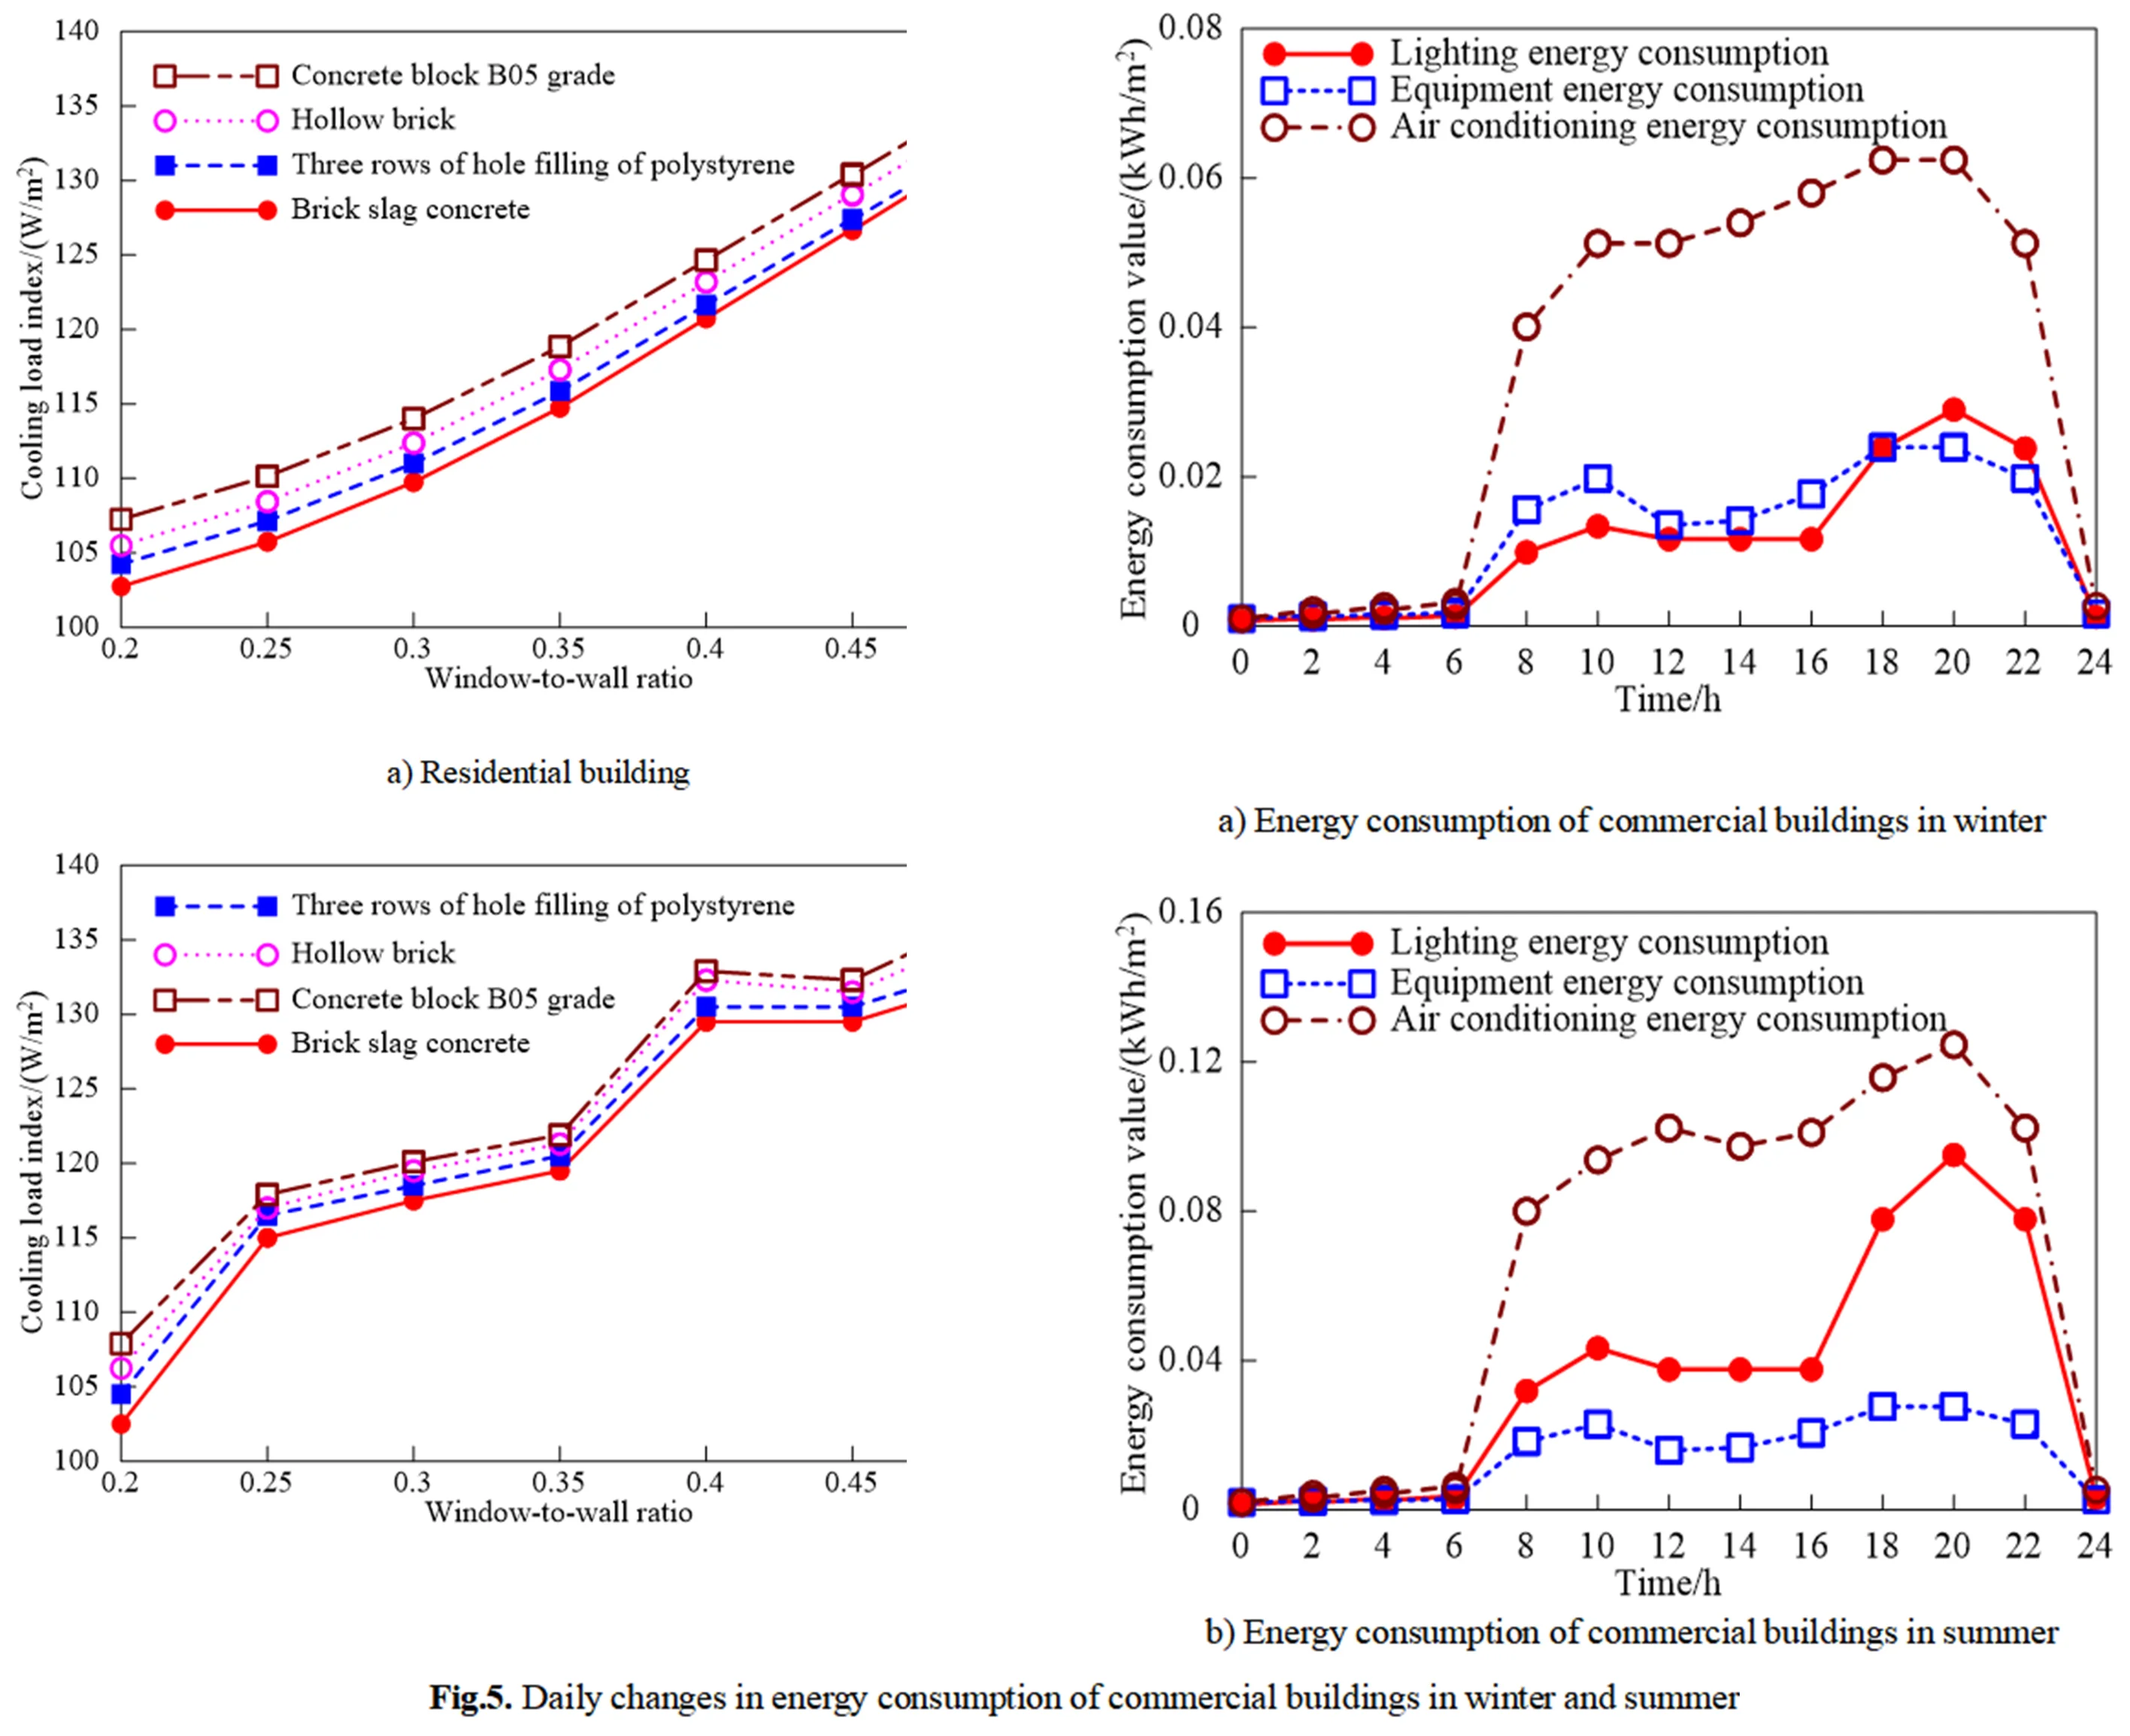
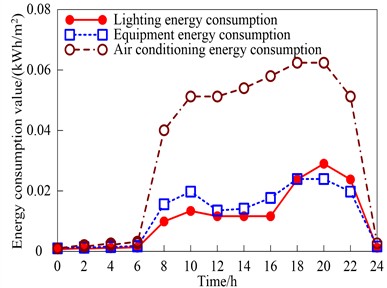
Taking the energy consumption of commercial buildings as an example, through the method in this paper, the spatio-temporal characteristics of regional building energy consumption are extracted. The lighting energy consumption, equipment energy consumption, and air-conditioning energy consumption per unit area within 24 hours in winter and summer of commercial buildings are respectively counted, and the differential situations caused by the characteristics in the time dimension on regional building energy consumption are compared and analyzed. The results are shown in Fig. 5.
Fig. 5Daily changes in energy consumption of commercial buildings in winter and summer
a) Energy consumption of commercial buildings in winter
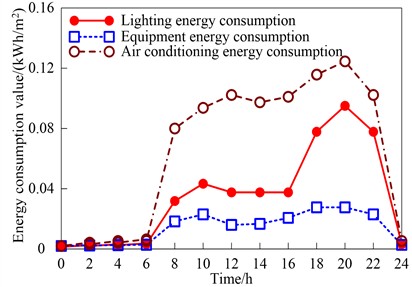
b) Energy consumption of commercial buildings in summer
As shown in Fig. 5, in the energy consumption of the experimental commercial building in winter and summer, the morning peak of lighting energy consumption in winter is at 8:00, and the evening peak is at 18:00. The lighting energy consumption in summer is similar to that in winter, but the evening peak is earlier and the peak value is higher. The equipment energy consumption in winter shows a stable high level within the time range of 8:00-20:00 and a sharp drop at night. The equipment energy consumption in summer is similar to that in winter, but it drops slightly within the noon range of 12:00-14:00. The peak of air-conditioning energy consumption in winter is prominent from 4:00 to 6:00 in the early morning and stable during the day, while the air-conditioning energy consumption in summer shows a trend of reaching the highest level of the whole day from 13:00 to 15:00. Through in-depth analysis of the above results, it can be found that in summer, due to the extended business hours and increased passenger flow, the internal heat load of the building has increased significantly. The specific manifestations are as follows: the factors such as the extended use time of the lighting system, the increased operation intensity of equipment, and the increased personnel density are superimposed on each other, ultimately forming a higher energy consumption peak. These findings fully prove that the time dimension characteristics can finely depict the hourly fluctuation law of building energy consumption, not only accurately reflect the operation characteristics of different energy-using systems, but also reveal the deep impact of seasonal changes on building energy consumption. These time-varying characteristics play a decisive role in establishing a high-precision building energy consumption prediction model and are the key factors to improve the prediction reliability. At the same time, these time series characteristics also provide an important basis for the energy-saving operation of commercial buildings. For example, the equipment operation strategy can be optimized according to the peak and valley periods of energy consumption, and energy-saving measures such as implementing demand-side response can be implemented.
To validate the effectiveness of the proposed dual-stream residual architecture with convolutional attention fusion, the comparison models are selected according to three theoretical criteria. First, based on the design-space extreme-contrast principle, the single-path, attention-free U-Net encoder is chosen as a structurally opposite baseline to verify the fundamental advantage of explicit spatiotemporal decoupling and dynamic attention fusion over static skip connections. Second, based on the lower-bound expressiveness validation, the non-learning, parameter-free histogram analysis method is adopted as a performance lower-bound baseline to quantify the absolute improvement of the deep learning architecture in capturing nonlinear, multi-factor coupled spatiotemporal patterns. Third, based on the key-deficiency contrast, targeting the typical shortcomings of U-Net (sensitivity to noise) and histogram analysis (inability to adapt to spatial heterogeneity), comparative experiments are designed to evaluate the proposed method’s advancements in noise robustness and adaptive spatial modeling.
Before presenting the comprehensive comparison results between the method proposed in this article and traditional methods, a systematic ablation study will be conducted to further analyze the rationality of the model architecture and the contributions of each module. Multiple variants were constructed for comparison on the same dataset by sequentially removing or replacing key components of the model, including: the complete model (Ours), removing channel attention mechanism (w/o CBAM), removing graph attention module (w/o GAT), removing all attention mechanisms (w/o Attention), and replacing the dual stream residual network with a single stream residual network (Single Stream ResNet). All experiments maintain the same data preprocessing, training strategy, and hyperparameter settings to ensure comparability of results. The experimental results are summarized in Table 4.
Table 4Results of ablation experiment
Model variants | Prediction bias (MAPE, %) | Average energy-saving rate (%) |
Complete Model (Ours) | 2.41 | 33.20 |
w/o CBAM | 3.85 | 28.74 |
w/o GAT | 4.12 | 26.51 |
w/o Attention | 5.67 | 19.88 |
Single-Stream ResNet | 6.23 | 17.05 |
According to Table 4, the complete model performs the best. Removing channel attention (CBAM) or graph attention (GAT) leads to a significant increase in prediction bias and a decrease in energy efficiency, which proves that both types of attention mechanisms are indispensable for focusing on key features and suppressing redundancy, and there is a synergistic enhancement effect. Among them, the absence of Graph Attention Module (GAT) has a more significant impact on energy consumption prediction of commercial buildings with obvious spatial heterogeneity, while the absence of Channel Attention Module (CBAM) generally reduces the discriminability of various building feature channels. When the attention mechanism is completely removed, there is a significant decline in performance and an increase in prediction bias, highlighting the fundamental necessity of introducing attention mechanisms for dynamic feature filtering in complex spatiotemporal data. In addition, the performance of the Single Stream ResNet is the worst among all variants, fully verifying the rationality of using a dual stream architecture to process spatiotemporal data separately in this paper. This design effectively avoids the mutual interference of heterogeneous features in the early stages, laying the foundation for efficient fusion in the future. The ablation experiment clearly demonstrates that the architecture design of “dual stream residual extraction” combined with “dual attention of graph and channel” proposed in this paper has played a substantial role in improving the final performance of each component, together forming an efficient and necessary feature extraction system.
Next, to avoid the method being only effective on specific datasets and to test its generalization ability, external validation was conducted on two additional datasets with different characteristics. The first one is a subset (Dataset B) of the publicly available benchmark dataset ASHRAE Great Energy Predictor III (GEFCom 2017), which includes multi regional commercial building data; The second one is a building energy consumption dataset from a cold city in northern China (Dataset C), which shows significant differences in climate, building structure, and energy consumption habits compared to the main experimental area (Dataset A). The fully trained model will be directly applied to these two new datasets for testing without any fine-tuning, and compared with the U-Net encoder method retrained on each dataset. The results are shown in Table 5.
Table 5Verification of model region generalization ability
Dataset | Method | Prediction bias (MAPE, %) |
Dataset B (publicly available benchmark) | Proposed Method | 4.58 |
U-Net encoder | 18.34 | |
Dataset C (Northern Cities) | Proposed Method | 5.12 |
U-Net encoder | 22.67 |
As shown in Table 5, despite facing differences in data distribution, our method still maintains low prediction bias on unseen datasets B and C, and is significantly lower than the U-Net encoder method that has undergone targeted training. This strongly proves that the spatiotemporal features extracted by the method in this article have strong universality and transferability, and the spatiotemporal correlation patterns modeled can adapt to different geographical and climatic environments, rather than overfitting to specific rules of a single dataset.
In addition to the comparison with traditional methods, in order to further demonstrate its progressiveness, several representative advanced models in the field of spatiotemporal prediction in recent years are selected as the baseline for comparison, including the classic ST-GCN, the attention introducing ASTGCN, the Transformer based STTN and the graph multi attention network GMAN, as well as two classical temporal baselines: LSTM and CNN-LSTM (a hybrid model combining convolutional layers for spatial feature extraction followed by LSTM for temporal dependency modeling) . All comparison models were re implemented and evaluated using their public code and the same training/testing set partitioning on dataset A. Through testing, the comparative results are shown in Table 6.
As shown in Table 6, our method achieved the best overall performance among all advanced baseline models on Dataset A (the central urban area dataset), with a prediction bias (MAPE) of 2.41 % and an average energy saving rate of 33.20 %. Compared with graph convolutional networks (ST-GCN, ASTGCN), our method demonstrates significant advantages, thanks to the stronger ability of residual networks to extract deep multi-scale features and the graph attention design that is more in line with the relationships between building entities. Compared with Transformer based STTN, the method proposed in this paper has improved accuracy and energy efficiency, indicating that for problems with strong local correlation and physical constraints such as building energy consumption, the CNN and graph attention hybrid architecture proposed in this paper may have more advantages than pure self-attention architecture. Even compared to GMAN, a state-of-the-art graph multi-attention network that also employs spatiotemporal attention mechanisms, our method achieves a 1.11 % lower MAPE (2.41 % vs. 3.52 %) and a 2.72 % higher average energy saving rate (33.20 % vs. 30.48 %). Furthermore, compared to classical temporal baselines, LSTM and CNN-LSTM yield significantly higher prediction biases of 12.64 % and 9.87 %, respectively, with correspondingly lower energy saving rates. This substantial gap highlights the limitations of temporal-only models in capturing spatial dependencies and multi-scale spatiotemporal interactions, further validating the necessity of the proposed spatiotemporal modeling framework.
Table 6Comparison results with recent advanced spatiotemporal prediction models
Comparison model | Prediction bias (MAPE, %) | Average energy-saving rate (%) |
This article’s method (Ours) | 2.41 | 33.20 |
ST-GCN | 8.95 | 21.45 |
ASTGCN | 6.23 | 25.11 |
STTN | 4.87 | 29.05 |
GMAN | 3.52 | 30.48 |
LSTM | 12.64 | 15.23 |
CNN-LSTM | 9.87 | 18.67 |
This stable advantage stems from three key design differences: first, the dual-stream residual architecture enables deeper and more independent extraction of heterogeneous spatiotemporal features before fusion, avoiding the feature interference that may occur in GMAN’s early fusion approach; second, the explicit graph structure based on building entities with dynamically updated edge weights better captures the physical dependencies among buildings; third, the two-stage attention mechanism (graph attention followed by channel attention) provides more comprehensive feature refinement compared to GMAN’s unified attention framework. These results confirm the value of customized architecture design for the specific problem domain of building energy consumption.
Use the method proposed in this paper, the U-Net encoder method, and the histogram analysis method to extract the spatio-temporal features of regional building energy consumption respectively. Based on the extracted features, conduct energy consumption predictions for commercial buildings, residential buildings, office buildings, and cultural facilities buildings. Statistically analyze the actual energy consumption prediction deviation. Take corresponding measures for energy conservation treatment on the results of energy consumption prediction by various methods, and statistically analyze the energy conservation rate to verify the reliability of each method in extracting the spatio-temporal features of regional building energy consumption. The results are shown in Table 7.
As shown in Table 7, the average deviation of building energy consumption prediction based on the spatio-temporal features extracted by the method of combining the residual network and convolutional attention mechanism proposed in this paper is only 2.41 %, and this result is accurately controlled within the engineering acceptable range (< 5 %). In contrast, the U-Net encoder method completely ignores the dynamic change characteristics of the time dimension during the feature extraction process and only focuses on static spatial features, resulting in an average deviation of building energy consumption prediction as high as 21.33 %, which is more than four times beyond the acceptable range. The traditional histogram analysis method not only ignores the time dimension during feature extraction, but also fails to consider the correlation between spatial features and time features, and only performs simple statistical processing, making the average prediction deviation further climb to 33.72 %. Through the comparative experimental data of these three methods, it can be clearly seen that the method in this paper has significant advantages in prediction accuracy. In terms of the building energy-saving effect, the energy-saving scheme formulated based on the features extracted by the method in this paper shows excellent performance. The measured data shows that the average energy-saving rate reaches 33.20 %, and it can even break through to a high level of 38.69 % under the best working conditions. On the contrary, due to the limitations of feature extraction, the average energy-saving rate of the energy-saving scheme guided by the U-Net encoder method is only 16.11 %, barely reaching half of the effect of the method in this paper. When using the histogram analysis method, due to the serious lack of feature expression ability, the average energy-saving rate of the obtained energy-saving scheme is as low as 5.54 %, which can hardly meet the actual energy-saving needs. It is worth noting that the method in this paper shows stable performance advantages in the tests of multiple different types of buildings, verifying its good generalization ability. In-depth analysis of these data can clearly verify that the innovative architecture of combining the residual network and convolutional attention mechanism has unique advantages in spatio-temporal feature extraction. The residual structure effectively solves the problem of gradient disappearance in deep networks and ensures the hierarchical expression ability of features; while the convolutional attention mechanism can adaptively focus on key spatio-temporal feature regions, significantly improving the pertinence and effectiveness of feature extraction. Experiments prove that the spatio-temporal features extracted based on this method can not only achieve high-precision energy consumption prediction, but also accurately identify the key spatio-temporal patterns of building energy consumption, providing a reliable basis for formulating targeted energy-saving measures. This opens up a new technical approach for the refined management and optimization of building energy consumption and has important engineering application value.
Table 7Effect of extracting spatio-temporal features of regional building energy consumption
Method | Building type | Energy consumption prediction deviation (%) | Energy-saving rate (%) |
Method of text | Commercial building | 3.91 | 38.69 |
Residential building | 1.76 | 33.68 | |
Office building | 2.45 | 29.98 | |
Cultural facilities building | 2.53 | 29.45 | |
U-Net encoder | Commercial building | 15.04 | 20.07 |
Residential building | 21.23 | 19.95 | |
Office building | 27.11 | 13.48 | |
Cultural facilities building | 21.94 | 11.93 | |
Histogram analysis method | Commercial building | 36.82 | 8.45 |
Residential building | 35.76 | 5.75 | |
Office building | 31.69 | 4.04 | |
Cultural facilities building | 30.59 | 3.91 |
4. Conclusions
The extraction of spatiotemporal characteristics of regional building energy consumption is a key step in achieving accurate prediction and optimized management of building energy consumption. Therefore, this article proposes a method that combines residual networks with convolutional attention mechanisms. This method achieves deep and independent extraction of spatiotemporal heterogeneous features through a dual stream residual architecture, and innovatively introduces a graph attention mechanism based on building entities for dynamic fusion, significantly improving the model's ability to characterize the multi-scale spatiotemporal evolution of energy consumption and the physical interpretability of feature expression. The experimental results show that this method can effectively capture the hourly fluctuations and spatial heterogeneity of building energy consumption, with a prediction deviation as low as 2.41 % and an average energy saving rate of up to 33.20 %, verifying its superior performance in complex spatiotemporal patterns.
Beyond the quantitative improvements in prediction accuracy, the proposed method demonstrates significant practical value in building energy management and urban planning. In building energy management, the enhanced prediction accuracy provides a reliable foundation for dynamic load forecasting and precise control. By accurately capturing the hourly fluctuation patterns of building energy consumption, energy managers can implement refined pre-cooling and pre-heating strategies targeting peak loads, avoiding energy over-supply or under-supply caused by prediction deviations. Meanwhile, the graph attention mechanism enables the identification of high-energy-consumption clusters and supports differentiated energy-saving strategy formulation based on key features such as window-to-wall ratio and exterior wall structure. In urban planning, the spatiotemporal features extracted by this method can effectively guide the optimal layout of regional energy infrastructure. By characterizing the energy consumption intensity and temporal patterns of different functional zones, planners can scientifically allocate substation capacity and district heating and cooling networks. The strong generalization ability across multiple climate zones further demonstrates the transferable value of the extracted spatiotemporal features, providing quantitative support for low-carbon urban design guidelines. Furthermore, the integration capability of multi-source heterogeneous data enables dynamically updated city-level energy consumption heatmaps, facilitating the optimal siting of distributed photovoltaics and energy storage systems.
Although the proposed method achieves favorable experimental results, it still has the following limitations: First, the computational complexity is relatively high. The model contains approximately 48 million parameters, and the training time is relatively long, posing challenges for real-time applications and edge deployment. Second, it relies heavily on data quality. The construction of the graph structure requires accurate building attribute data, and the extraction of environmental features depends on high-resolution remote sensing imagery, limiting its applicability in regions with missing data. Third, its cross-scenario generalization ability remains to be validated. The method has primarily been validated on urban buildings in temperate climates, and its performance in extreme climate zones such as tropical or subarctic regions, or on non-standard building types such as industrial facilities or historic preservation structures, is still unclear. Future research can be deepened in the following directions: first, explore model lightweight and knowledge distillation technology to adapt to resource constrained edge computing deployment; The second is to integrate multi-source heterogeneous data such as meteorological forecasts, real-time electricity prices, and personnel movements to construct a more comprehensive energy consumption driven model; The third is to promote the direct integration of feature extraction and building automation systems, achieve real-time prediction and closed-loop optimization control based on feature perception, and ultimately serve the dynamic scheduling and decision-making of urban level smart energy systems.
References
-
H. Shin and S. Lee, “An efficient explainable convolutional network with visualization of feature maps for enhanced understanding of building facade defects,” Journal of Computing in Civil Engineering, Vol. 38, No. 5, pp. 1.1–1.12, Sep. 2024, https://doi.org/10.1061/jccee5.cpeng-5857
-
J. M. Kouhoue, J. Lonlac, A. Lesage, A. Doniec, and S. Lecoeuche, “Enhancing associative classification on imbalanced data through ontology-based feature extraction and resampling,” Knowledge-Based Systems, Vol. 309, No. Jan.30, p. 112897, Jan. 2025, https://doi.org/10.1016/j.knosys.2024.112897
-
S. Kokila and A. Jayachandran, “Hybrid Behrens-Fisher – and Gray contrast-based feature point selection for building detection from satellite images,” Journal of Geovisualization and Spatial Analysis, Vol. 7, No. 1, pp. 8–14, 2023, https://doi.org/10.1007/s41651-023-00136-2
-
H. Farhadi, H. Ebadi, and A. Kiani, “F2bfe: development of feature-based building footprint extraction by remote sensing data and gee,” International Journal of Remote Sensing, Vol. 44, No. 19, pp. 5845–5875, Oct. 2023, https://doi.org/10.1080/01431161.2023.2255351
-
M. Sakkari, M. Hamdi, H. Elmannai, A. Algarni, and M. Zaied, “Feature extraction-based deep self-organizing map,” Circuits, Systems, and Signal Processing, Vol. 41, No. 5, pp. 2802–2824, 2022, https://doi.org/10.1007/s00034-021-01914-3
-
L. Vijayan and A. Preethy Byju, “EMAFF-Net: an enhanced multi-scale attentive feature fusion network for building extraction from VHR remote sensing images,” Remote Sensing Letters, Vol. 15, No. 2, pp. 157–166, Jan. 2024, https://doi.org/10.1080/2150704x.2024.2305624
-
N. Chauhan, R. Kumar, S. Mukherjee, A. Hazra, and K. Giri, “Ultra-resolution unmanned aerial vehicle (UAV) and digital surface model (DSM) data-based automatic extraction of urban features using object-based image analysis approach in Gurugram, Haryana,” Applied Geomatics, Vol. 14, No. 4, pp. 751–764, 2022, https://doi.org/10.1007/s12518-022-00466-8
-
X. Jin, T. Sun, W. Chen, H. Ma, Y. Wang, and Y. Zheng, “Parameter adaptive non-model-based state estimation combining attention mechanism and LSTM,” ICCK Transactions on Intelligent Systematics, Vol. 1, No. 1, p. 40, May 2024, https://doi.org/10.62762/tis.2024.137329
-
M. J. Ahmad, A. Khan, T. A. Khan, and B. Ahmad, “Dual attention-driven optimized YOLOV5 framework for accurate fall detection in visual monitoring systems,” ICCK Transactions on Intelligent Systematics, Vol. 3, No. 1, pp. 1–10, Nov. 2025, https://doi.org/10.62762/tis.2025.559776
-
F. Wang and S. Yi, “Spatio-temporal feature soft correlation concatenation aggregation structure for video action recognition networks,” ICCK Transactions on Sensing, Communication, and Control, Vol. 1, No. 1, pp. 60–71, Oct. 2024, https://doi.org/10.62762/tscc.2024.212751
-
Z. Wang, M. Tian, Y. Qiu, Z. Zhao, Y. Zhang, and K. Liu, “Federated learning privacy protection via training randomness,” ICCK Transactions on Sensing, Communication, and Control, Vol. 2, No. 4, pp. 226–237, Nov. 2025, https://doi.org/10.62762/tscc.2025.779613
-
F. Farnood Ahmadi, R. Naanjam, and A. Salimi, “Developing an automatic training technique based on integration of radar and optical remotely sensed images for building extraction,” Earth Science Informatics, Vol. 17, No. 1, pp. 131–143, 2023, https://doi.org/10.1007/s12145-023-01154-w
-
O. Sharma and D. Sharma, “Taylor-based smart flower optimization algorithm with the deep residual network to predict mechanical materials properties,” Optimal Control Applications and Methods, Vol. 46, No. 1, pp. 44–64, 2024, https://doi.org/10.1002/oca.3195
-
S. Bose, R. S. Chowdhury, D. Pal, S. Bose, B. Banerjee, and S. Chaudhuri, “Multiscale probability map guided index pooling with attention-based learning for road and building segmentation,” ISPRS Journal of Photogrammetry and Remote Sensing, Vol. 206, No. Dec., pp. 132–148, Dec. 2023, https://doi.org/10.1016/j.isprsjprs.2023.11.002
-
S. Y. Tan, M. Jacoby, H. Saha, A. Florita, G. Henze, and S. Sarkar, “Multimodal sensor fusion framework for residential building occupancy detection,” Energy and Buildings, Vol. 258, No. Mar., p. 111828, Mar. 2022, https://doi.org/10.1016/j.enbuild.2021.111828
-
D. Mah, A. Tzempelikos, and K. J. Kircher, “Real-time detection of internal and solar gains toward demand-driven building control using deep learning,” in 2024 ASHRAE Winter Conference, Vol. 130, No. Pt.1, pp. 1044–1052, 2024, https://doi.org/10.63044/w24mah124
-
D. E. V. and S. M., “An intelligent deep learning architecture using multi-scale residual network model for image interpolation,” Journal of Advances in Information Technology, Vol. 14, No. 5, pp. 970–979, Jan. 2023, https://doi.org/10.12720/jait.14.5.970-979
-
E. Perenda, S. Rajendran, G. Bovet, S. Pollin, and M. Zheleva, “Evolutionary optimization of residual neural network architectures for modulation classification,” IEEE Transactions on Cognitive Communications and Networking, Vol. 8, No. 2, pp. 542–556, Jun. 2022, https://doi.org/10.1109/tccn.2021.3137519
-
S. Tamizharasi, B. Arunadevi, and S. N. Deepa, “Bio-inspired deep residual neural network learning model for QoS routing enhancement in mobile ad-hoc networks,” Wireless Networks, Vol. 29, No. 8, pp. 3541–3565, 2023, https://doi.org/10.1007/s11276-023-03424-3
-
G. Zhang et al., “Intelligent analysis method of large-scale building structures based on graph neural network,” (in Chinese), Building Structure, Vol. 55, No. 21, pp. 10–17, 2025, https://doi.org/10.19701/j.jzjg.zj250013
-
F. Wu, D. Yang, J. Li, and M. Hu, “Building extraction from remote sensing images using asymmetric convolution pyramid residual network,” Remote Sensing Technology and Application, Vol. 38, No. 6, pp. 1467–1476, 2023.
-
A. Ramalingam, S. V. George, V. Srivastava, S. Alagala, and J. M. L. Manickam, “Semantic segmentation-based building extraction in urban area using memory-efficient residual dilated convolutional network,” Arabian Journal for Science and Engineering, Vol. 49, No. 9, pp. 12147–12166, 2024, https://doi.org/10.1007/s13369-023-08593-z
-
S. Molavi Vardanjani, A. Fathi, and K. Moradkhani, “Grsnet: gated residual supervision network for pixel-wise building segmentation in remote sensing imagery,” International Journal of Remote Sensing, Vol. 43, No. 13, pp. 4872–4887, Jul. 2022, https://doi.org/10.1080/01431161.2022.2122892
-
Y. F. Xing, H. Li, S. F. Hao, and Etc., “HRRSI building extraction method based on improved Unet and ConvCRF,” (in Chinese), Computer Simulation, Vol. 41, No. 11, pp. 251–257, 2024.
-
B. Wickramanayake, Z. He, C. Ouyang, C. Moreira, Y. Xu, and R. Sindhgatta, “Building interpretable models for business process prediction using shared and specialised attention mechanisms,” Knowledge-Based Systems, Vol. 248, No. Jul.19, p. 108773, Jul. 2022, https://doi.org/10.1016/j.knosys.2022.108773
-
H. Zhang, J. Wang, and Y. Qian, “Research on prediction of public lighting energy consumption in hospital building based on convolutional neural network,” (in Chinese), Techniques of Automation and Applications, Vol. 43, No. 4, pp. 99–102, 2024, https://doi.org/10.20033/j.1003-7241.(2024)04-0099-05
-
C. Wu, X. Zhang, Y. Li, and Z. Chen, “Energy consumption prediction for small sample buildings based on spatio-temporal feature extraction and model transfer,” (in Chinese), Journal of Safety and Environment, Vol. 25, No. 10, pp. 4088–4099, 2025, https://doi.org/10.13637/j.issn.1009-6094.2024.2096
-
S. Dai, M. Eames, R. Vinai, and V. I. Sucala, “Energynet: a modality-aware attention fusion network for building energy efficiency classification,” Applied Energy, Vol. 379, No. Feb.1, p. 124888, Feb. 2025, https://doi.org/10.1016/j.apenergy.2024.124888
-
Z. Gao, J. Xing, X. Zhang, and Z. Deng, “Research on a CNN-LSTM building energy consumption prediction method based on attention mechanism,” in Heating Ventilating and Air Conditioning, Vol. 54, No. 8, pp. 48–55, 2024.
-
B. Cai, “A building energy consumption prediction method integrating attention mechanism and CNN-Bi-LSTM network,” (in Chinese), Building Electricity, Vol. 44, No. 6, pp. 59–64, 2025, https://doi.org/10.3969/j.issn.1003-8493.2025.06.013
About this article

This article is supported by Funding Projects 1: Joint Funds for Science and Technology R&D Plan of Henan Province (Grant No. 232103810078): “Study on Creep Cracking of Stored Grain Kernels and Fungal Invasion Range in Steel Silos in Temperate Monsoon Regions” (2023). Funding Project 2: Joint Funds for Key Scientific and Technological Research Projects (Key R&D Program) of Henan Province (Grant No. 232103810079): “Research and Development of a Novel Low-Temperature Preservation and Low-Energy Consumption Technology System for Grain Storage in Multi-story Aboveground and Underground Silo Complexes” (2023).
The datasets generated during and/or analyzed during the current study are available from the corresponding author on reasonable request.
Qiongmin Gao: formal analysis, writing-original draft preparation. Jian Yin: conceptualization, methodology, writing-review and editing.
The authors declare that they have no conflict of interest.

