Abstract
Laser cladding technology was employed to prepare dual-phase CoCuNiTiX0.6 (X = Mn, Al) HEA coatings on the 45-steel substrate. The phase structure, microstructural evolution, composition analysis, and corrosion resistance of CoCuNiTiX0.6 (X = Mn, Al) HEA coatings were studied using an X-ray diffractometer, OM, SEM, EDS, and ECW. The results demonstrate that CoCuNiTiMn0.6 alloy consists of an FCC primary phase and a BCC phase. After replacing Mn with Al, CoCuNiTiAl0.6 alloy transforms into a structure dominated by the BCC phase, with a minor amount of the FCC phase. The lattice constants and cell volumes of BCC and FCC in Al-containing alloy are relatively large, but their densities are low. Both alloys have dendritic structures. The high viscosity and poor fluidity of Mn-containing alloy melt increase atomic diffusion resistance and a relatively slow occurrence of “composition undercooling” during solidification, resulting in coarse columnar crystals and pore defects. Ti and Cu exhibit the highest concentrations in the primary phase and interdendrite regions, respectively. The composition differences of Ni, Mn, and Al in different regions are relatively small. Both alloys show obvious passivation zones in 3.5wt% NaCl solution, and their Nyquist plots present a flattened semi-circular arc. The capacitive arc radius, maximum phase angle, and m value of CoCuNiTiAl0.6 HEAC are relatively large, indicating that its corrosion resistance is relatively superior, mainly due to its dense passivation film, fewer defects, and relatively uniform composition distribution.
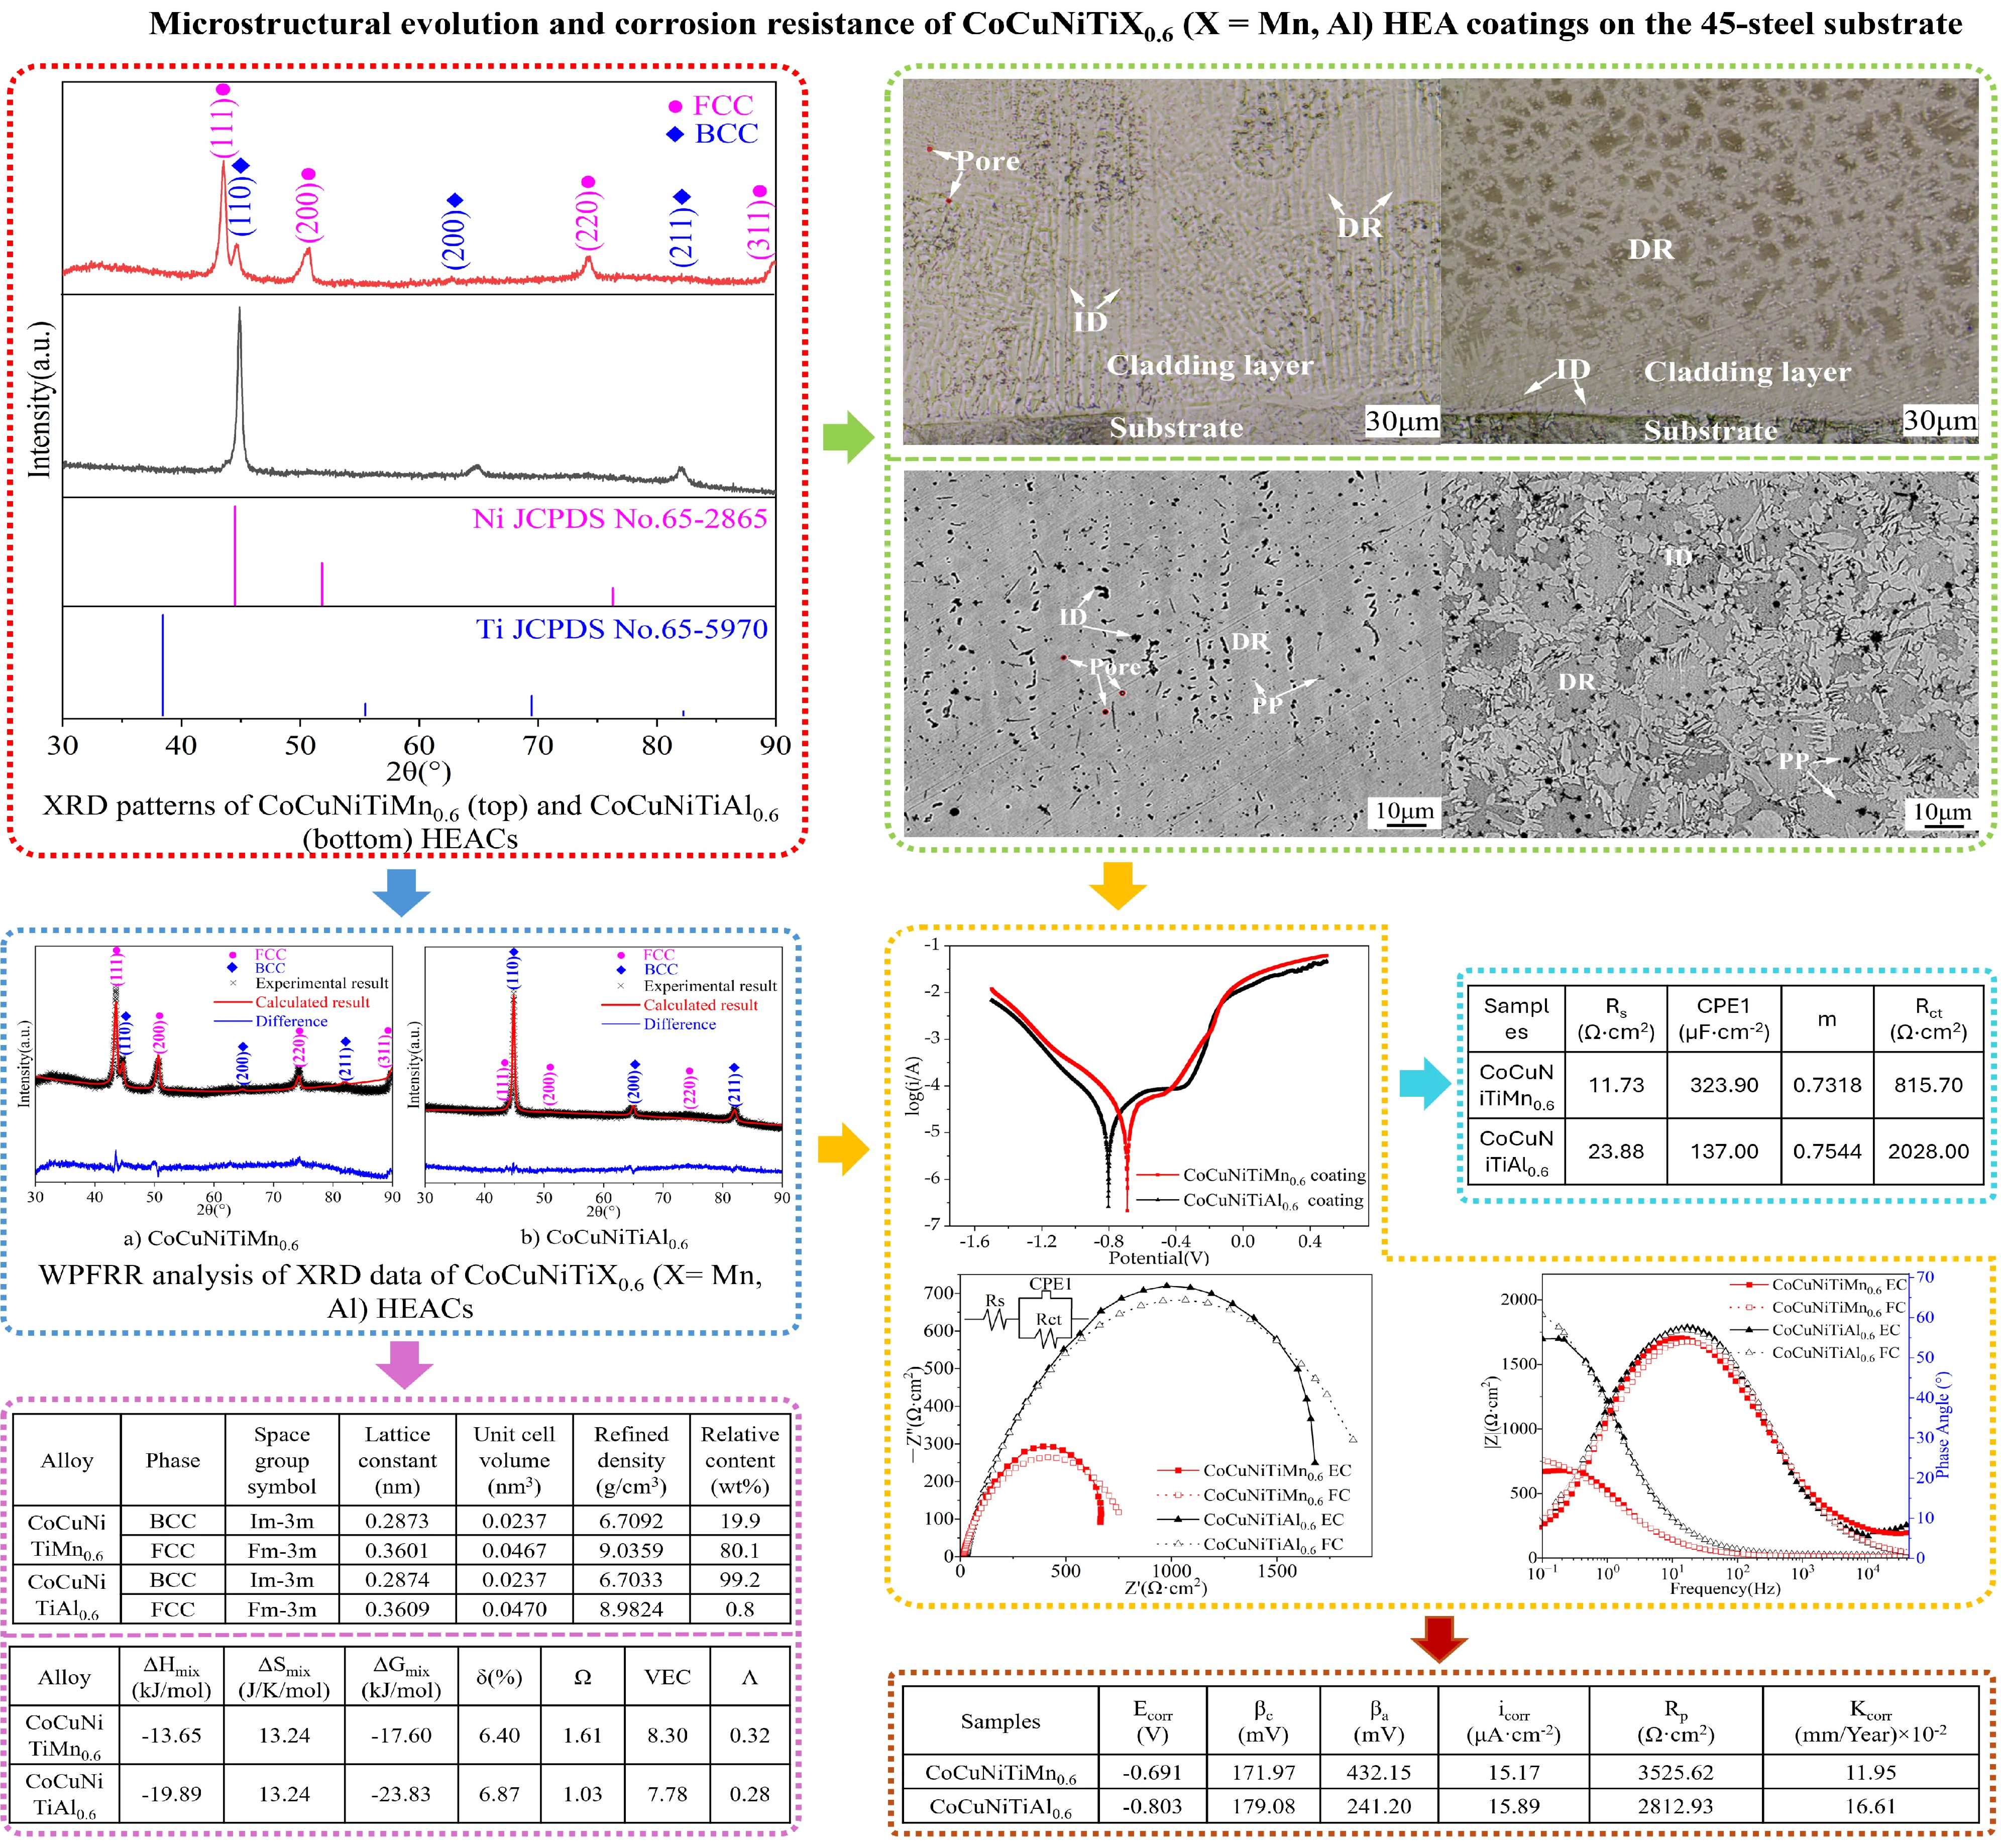
Highlights
- Replacing Mn with Al in laser-cladded CoCuNiTiX₀.₆ coatings triggers a dominant phase switch from FCC to BCC, accompanied by pronounced lattice expansion and reduced density, quantitatively rationalized by VEC, Ω, and Λ criteria.
- Al addition reduces melt viscosity and accelerates atomic diffusion during rapid solidification, suppressing coarse columnar growth and porosity while halving the average elemental segregation coefficient from 23.39% to 10.64%.
- CoCuNiTiAl₀.₆ exhibits ~2.5-fold higher charge transfer resistance than CoCuNiTiMn₀.₆ in 3.5 wt% NaCl, attributed to a denser passive film, fewer microstructural defects, and more homogeneous composition distribution.
- This work establishes a comparative framework linking non-stoichiometric Mn/Al substitution to solidification microstructure evolution and passivation film stability in CoCuNiTi-based HEA coatings.
1. Introduction
High-entropy alloys (HEAs) have garnered significant attention since their independent reports by Yeh [1] and Cantor [2] in 2004. These alloys break through the traditional design philosophy of few-principal element alloys, form simple solid solution phase (SSP) structures (such as face-centered cubic (FCC), body-centered cubic (BCC), and exhibit outstanding comprehensive properties. Previous research on high-entropy alloys has mainly focused on basic theoretical research on different alloy systems [1-3], element addition or replacement [4, 5], and phase formation rules [6, 7]. With the continuous expansion of the scope of alloy systems and the gradual maturity of process technology, their application research has accelerated in different fields. Taking the application of high-entropy alloy coating (HEAC) as an example, Zheng et al. [8] prepared FeCoCrNiTi HEAC with FCC and BCC structure on 304 stainless steel substrates by laser cladding (LC) and studied the effects of different laser energy densities on their properties. With the decrease in laser energy density, the grain size decreased from 57.52 μm to 27.23 μm. At an energy density of 40 J/mm2, the LC layer exhibited the lowest friction coefficient, highest corrosion potential, and lowest corrosion current density. Feng et al. [9] synthesized CoCrFeMnNiSi1.6-(WC)x LC layers on AISI 1045-steel substrate. The addition of WC caused the carbide phase to appear in this alloy. When the amount of WC reaches 40wt%, its hardness reaches the maximum value of 782.2 HV0.5, representing a 52 % increase over alloys without tungsten carbide. When WC is added at 30wt%, the passivation film becomes most dense and exhibits the highest corrosion resistance.
As a relatively new HEA system, research on CoCuNiTi-based alloys has mainly focused on rare-earth doping [10], element replacement and addition [11,12], phase structure transformation [13], mechanical properties [11,14], and simulation verification [15]. Ma et al. [10] investigated the effects of CeO2 doping on its phase structure, microstructural evolution, and corrosion resistance of CoCuNiTi HEACs. CeO2 doping not only significantly increases BCC content in CoCuNiTi HEACs and reduces the width of the primary diameter of the columnar crystal, but also makes the distribution of alloy elements more uniform and improves its corrosion resistance. Yi et al. [11] added Cr element with the same molar ratio on the basis of CoCuNiTi. CoCrCuNiTi alloy is composed of five phases with different structures, with BCC phase accounting for nearly 50 %, the ultimate compressive strength was 2.53 GPa, and the microhardness was 694HV. Mohanty et al. [13] developed Fe-added CoCuFeNiTi HEAs by mechanical alloying, and pointed out that the initially single FCC phase first transformed into BCC (Ti) and Co/Cu/Ni-rich FCC dual-phase solid solution, and finally separated into two new FCC phase solid solution structures. The characteristic length and scale of phase separation are also provided, and the phase-field model is used to simulate and verify the above phase structure evolution. Lu et al. [15] prepared AlCoCuFeNiTi alloys with Al and Fe co-addition. The increase in the proportion of Al in this alloy will destroy the stability of BCC and promote the formation of hexagonal close-packed (HCP) and intermetallic compound phases. The formation of complex multiphase structures was confirmed experimentally, and the difference between the simulated and experimental tensile strengths was attributed to the existence of microstructural defects and brittle intermetallic compounds.
Al is one of the most common elements in high-entropy alloys, Al plays an important role in phase transformation [16], high strength [17, 18], and improvement of wear and corrosion resistance [19, 20]. First, Al is a strong BCC phase-forming element, which easily reduces the valence electron concentration (VEC) of the high-entropy alloy and causes the transformation of FCC to the high-strength BCC, significantly improving the hardness and strength of the alloy [16, 17]. Second, the addition of Al to Fe/Co/Ni/Cr-based alloys tends to cause cell distortion owing to the large difference in atomic radius and the high degree of mismatch, which contributes to the improvement of its hardness and wear resistance [18, 19]. Finally, Al is an element with a strong affinity for oxygen. The addition of an appropriate amount of Al can promote the formation of a dense passivation film and control the corrosion resistance [20]. Mn is also a common HEA element. In AlCrFeNiMnx HEACs [21], an appropriate amount of Mn can reduce the FCC phase content, refine the microstructure, and improve its hardness and wear resistance. However, when Mn content is too high, its mechanical properties deteriorate. The addition of manganese affects its microstructural evolution, distribution of alloying elements, and oxide film stability of AlCoCrFeNi [22]. Therefore, by changing the contents of Al and Mn in the high-entropy alloy, their mechanical properties and corrosion resistance can be adjusted according to demand, which provides the possibility for the development of high-performance alloys in specific service environments.
Since most high entropy alloys have simple solid-solution structures consisting of single- or dual-phase structures. There is a wealth of literature on research that treats high-entropy alloy phases as a whole and regulates their properties through the addition or substitution of elements based on traditional alloying principles [23-25]. However, most of these studies still involve the addition or substitution of elements at equal molar ratios. Based on previous research on the addition and substitution of elements with equal molar ratios and drawing on traditional alloying theory, the non-equimolar elemental addition of CoCuNiTi high-entropy alloy was explored, and the influence of different elements on its microstructure and corrosion resistance was investigated. This provides a reference and basis for the subsequent addition or substitution of other elements in the alloy system to control the phase composition, microstructure, and properties. Currently, there is a relative paucity of literature comparing the effects of Al and Mn doping on their phase composition, microstructural evolution, and corrosion resistance of CoCuNiTi HEACs. In this study, CoCuNiTiX0.6 (X = Mn, Al) HEACs were prepared on a 45-steel substrate using LC method. The phase structure, microstructure, element distribution, and corrosion resistance of the CoCuNiTiX0.6 (X = Mn, Al) alloy coating were studied in detail. By investigating the systematic differences in phase formation and microstructural evolution during solidification in CoCuNiTi HEACs with non-stoichiometric Al and Mn substitutions and comparing the effects of Al and Mn additions on microstructural uniformity and passivation film stability, this study provides data to support future research on CoCuNiTi HEACs.
2. Experimental procedures
CoCuNiTiX0.6 (X= Mn, Al) HEACs were prepared using pure metal powders as raw materials. The particle size of pure Co, Cu, Ni, Ti, Al, and Mn powders was 200 mesh, with a purity of over 99 %. The particles were nearly spherical or irregular in shape. After weighing according to the above proportion, they were placed in a corundum mortar for grinding for 30 min and prefabricated on the surface of the 45-steel substrate after polishing and cleaning. The prefabricated powder layer had a thickness of approximately 2 mm and was then dried at 100 °C for 30 min in an oven. Finally, CoCuNiTiX0.6 (X = Mn, Al) HEACs were prepared by laser cladding using a FL-DLight3-4000 laser under argon atmosphere. The cladding power and scanning speed were 3 kW and 5 mm/s, respectively. The laser spot diameter was 6 mm. Metal block samples were fabricated by DK-M140 wire electrical discharge machining.
The phase composition and structural evolution of CoCuNiTiX0.6 (X = Mn, Al) HEACs were characterized by Ultima IV X-ray diffractometer (XRD). The microstructural evolution characteristics of the surface and cross-section of the cladding layer were observed at multiple scales using a DMM-150C optical microscope (OM) and PHEOM-PROX scanning electron microscope (SEM). Aztec X-MAX 90 energy-dispersive X-ray spectroscopy (EDS) was employed for elemental distribution analysis. Electrochemical corrosion tests were conducted using a CHI760E electrochemical workstation (ECW). During electrochemical testing, CoCuNiTiX0.6 (X = Mn, Al) HEACs, a saturated calomel electrode (SCE) and a platinum sheet were used as the working, reference and counter electrodes, respectively. The electrolyte was a 3.5wt% NaCl solution. The polarization and impedance testing ranges were –1.5 V to 0.5 V and 100,000 Hz to 0.1 Hz, respectively.
3. Results and discussion
3.1. Phase composition
Fig.1 shows XRD patterns of CoCuNiTiX0.6 (X= Mn, Al) HEACs. The ratios were calculated for the diffraction peaks of the two alloys, marked as FCC and BCC, as shown in Table 1. According to the extinction law of the lattice [26], when the ratio of the diffraction peak angle is 3:4:8:11:12:16: ... and 2:4:6:8:10:12: ..., the crystal structures are face-centered cubic and body-centered cubic, respectively. Based on the Bragg equation and the lattice structure theory [26]:
where is the interplanar spacing, is the angle between the incident X-ray and the corresponding crystal plane, and is the wavelength of the target material emitting X-rays, which is the wavelength of the characteristic radiation from a Cu target, approximately 1.5418 Å. is the lattice constant, and , , and are Miller indices. The Miller indices corresponding to the diffraction peak of each alloy phase were calculated using Eqs. (1-3), as shown in Table 1.
Fig. 1XRD patterns of CoCuNiTiMn0.6 (top) and CoCuNiTiAl0.6 (bottom) HEACs
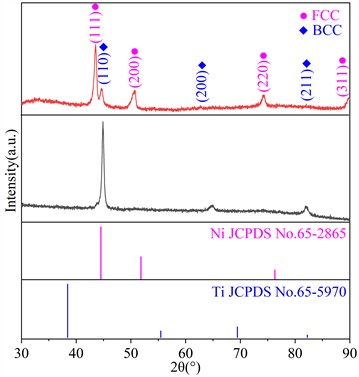
Table 1The diffraction peak data of CoCuNiTiX0.6 (X = Mn, Al) HEACs
Alloy | Phase | 2 (°) | (°) | ratio | ||
CoCuNiTiMn0.6 | FCC | 43.523 | 21.7615 | 0.1375 | 3.00 | 111 |
50.668 | 25.3340 | 0.1831 | 4.00 | 200 | ||
74.297 | 37.1485 | 0.3647 | 7.96 | 220 | ||
89.929 | 44.9645 | 0.4994 | 10.90 | 311 | ||
BCC | 44.621 | 22.3105 | 0.1441 | 2.00 | 110 | |
64.918 | 32.4590 | 0.2880 | 4.00 | 200 | ||
82.077 | 41.0385 | 0.4311 | 5.98 | 211 | ||
CoCuNiTiAl0.6 | FCC | 43.953 | 21.9765 | 0.1400 | 3.00 | 111 |
51.218 | 25.6090 | 0.1868 | 4.00 | 200 | ||
75.222 | 37.6110 | 0.3725 | 7.98 | 220 | ||
BCC | 44.879 | 22.4395 | 0.1457 | 2.00 | 110 | |
64.973 | 32.4865 | 0.2885 | 3.96 | 200 | ||
82.180 | 41.0900 | 0.4320 | 5.93 | 211 |
Compared with the Joint Committee on Powder Diffraction Standards (JCPDS) cards, the shape and number of diffraction peaks of the two alloys are similar to the superimposed peaks of Ni (JCPDS No. 65-2865) with FCC structure and Ti (JCPDS No. 65-5970) with BCC structure. Based on the strongest diffraction peak of Ni (44.493°) of the standard card, the strongest peaks of FCC labeling in CoCuNiTiMn0.6 and CoCuNiTiAl0.6 shifted toward lower angles by 0.970° and 0.540°, respectively. Based on the strongest peak angle of Ti (38.415°) diffraction peak of the standard card, the strongest peaks of BCC labeling in CoCuNiTiMn0.6 and CoCuNiTiAl0.6 shifted to the small angle direction by 6.206° and 6.464°, respectively. Table 2 shows the characteristic parameters of each alloying element in CoCuNiTiX0.6 (X = Mn. Al) HEACs. As shown in Table 2, the atomic radii of Ni (0.125 nm) and Ti (0.146 nm) are the minimum and maximum values of all elements in the two alloys, respectively. When other alloying elements enter and occupy the lattice sites of Ni with an FCC structure, this inevitably leads to cell expansion. Occupying the lattice sites of Ti with BCC inevitably causes cell shrinkage. From Eq. (1), cell expansion and shrinkage cause the diffraction peak angle to shift to lower and higher angles, respectively. Therefore, the diffraction peak angles of the two alloys were shifted compared to the data of the standard diffraction card.
Table 2Parameters of constituent alloying elements in CoCuNiTiX0.6 (X = Mn, Al) HEACs
Element | Atomic radius(nm) | Density (g/cm3) | Melting point (°C) | Electro- negativity | VEC | Lattice structure |
Co | 0.125 | 8.900 | 1495 | 1.88 | 9 | FCC/ HCP |
Cu | 0.128 | 8.960 | 1083 | 1.90 | 11 | FCC |
Ni | 0.125 | 8.902 | 1453 | 1.91 | 10 | FCC |
Ti | 0.146 | 4.506 | 1660 | 1.54 | 4 | BCC/HCP |
Mn | 0.126 | 7.300 | 1244 | 1.55 | 7 | BCC |
Al | 0.143 | 2.702 | 660 | 1.61 | 3 | FCC |
Fig. 2WPFRR analysis of XRD data of CoCuNiTiX0.6 (X = Mn, Al) HEACs
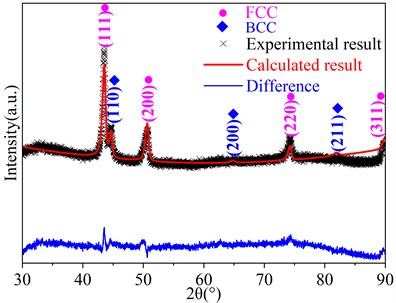
a) CoCuNiTiMn0.6
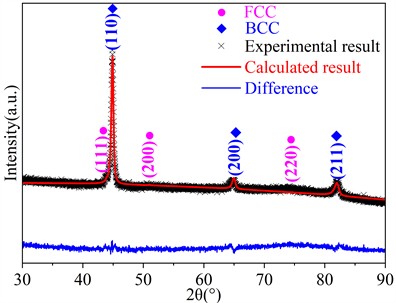
b) CoCuNiTiAl0.6
Fig. 2 shows the whole pattern fitting and Rietveld refinement (WPFRR) analysis of the X-ray diffraction data of CoCuNiTiX0.6 (X = Mn, Al) HEACs. The refinement weight factors () of the CoCuNiTiMn0.6 and CoCuNiTiAl0.6 alloys are 4.66 and 3.31 %, respectively. The refinement results are presented in Table 3. As shown in Table 3, compared with the CoCuNiTiMn0.6 alloy, the lattice constants and unit cell volumes of both BCC and FCC phases in the CoCuNiTiAl0.6 alloy are relatively larger, which is due to the fact that the atomic radius of Al is significantly larger than that of Mn. The densities of both phases in CoCuNiTiAl0.6 alloy are lower, which is because the density of Al (2.702 g/cm3) is significantly smaller than that of Mn (7.300 g/cm3, see Table 2), that is, the “cocktail effect” of high entropy alloy. Table 3 also shows that the CoCuNiTiMn0.6 alloy consists of FCC main phase and BCC phase, while the CoCuNiTiAl0.6 alloy consists of BCC main phase and FCC phase. This is in line with reports in the literature that an increase in the proportion of Al leads to an increase in the BCC phase content in high-entropy alloys [27-29].
Table 3WPFRR results of CoCuNiTiX0.6 (X= Mn, Al) HEACs
Alloy | Phase | Space group symbol | Lattice constant (nm) | Unit cell volume (nm3) | Refined density (g/cm3) | Relative content (wt%) |
CoCuNiTiMn0.6 | BCC | Im-3m | 0.2873 | 0.0237 | 6.7092 | 19.9 |
FCC | Fm-3m | 0.3601 | 0.0467 | 9.0359 | 80.1 | |
CoCuNiTiAl0.6 | BCC | Im-3m | 0.2874 | 0.0237 | 6.7033 | 99.2 |
FCC | Fm-3m | 0.3609 | 0.0470 | 8.9824 | 0.8 |
The formation of FCC and BCC dual-phase structures in CoCuNiTiX0.6 (X = Mn, Al) alloys originate from the high configurational entropy effect. According to the Gibbs’ free energy (), entropy of mixing (), enthalpy of mixing (), atomic radius difference (), VEC, phase formation parameters () and [31-35]:
where is the absolute temperature (298.15 K at room temperature). is the gas constant (8.314 J·mol-1·K-1). represents the number of components. is the molar fraction of the component , and . is the interaction parameter between components and of the regular solution. is the A-B binary mixing enthalpy calculated using the Miedema model. The mixing enthalpy values between any two alloying elements in the CoCuNiTiX0.6 (X = Mn, Al) alloy in Table 4 were obtained from the literature [30]. The atomic radius difference in Table 4 was calculated using Equation (7). The , , , , VEC, , and for CoCuNiTiX0.6 (X = Mn, Al) HEACs in Table 5 were calculated using Eqs. (4-11). Guo et al. [31,32] pointed out that when –22 kJ/mol ≤ ≤ 7 kJ/mol, 0 ≤ ≤ 8.5, and 11 J/K/mol ≤ ≤19.5 J/K/mol, it is easy to form HEA phase. The enthalpy of mixing, atomic radius difference, and entropy of mixing of CoCuNiTiMn0.6 and CoCuNiTiAl0.6 alloys are –13.65 kJ/mol, 6.40, 13.24 J/K/mol and –19.89 kJ/mol, 6.87, 13.24 J/K/mol, respectively, indicating that both alloys readily form HEA phases. Yang et al. [33] proposed the criterion for multi-principal element alloys. When 1.1 and 6.6 %, the alloy tends to form a simple SSP. The and values of the CoCuNiTiMn0.6 alloy are 1.61 and 6.40 %, respectively. This indicates that the CoCuNiTiMn0.6 HEAC easily forms a simple SSP structure. Zhang et al. [34] extended the theory of parameter criterion, and pointed out that when > 1.0, the alloy is easy to form a solid solution. Intermetallic compounds are easily formed when < 1.0. From Table 5, the parameter of CoCuNiTiAl0.6 (1.03) alloy is within the solid solution formation range. Guo et al. [35] also pointed out that, when 6.87 ≤ VEC ≤ 8.0, a dual-phase structure readily forms FCC and BCC, and the larger the VEC value, the more conducive to the formation of FCC phase. As shown in Table 5, the VEC of the CoCuNiTiAl0.6 alloy is 7.78, which easily formed FCC and BCC dual-phase structures. The VEC of the CoCuNiTiMn0.6 alloy is 8.30, indicating that the FCC phase in the CoCuNiTiMn0.6 alloy is easier to form than that in the CoCuNiTiAl0.6 alloy. This is in line with XRD analysis results obtained in this study. Singh et al. [32] proposed the geometric parameter when studying the formation law of solid solution phase in multi-principal alloy. When 0.24 < < 0.96, the multi-principal alloy is easy to form a dual-phase structure. When > 0.96, a single SSP structure is easily formed. From Table 5, the values of the CoCuNiTiMn0.6 and CoCuNiTiAl0.6 alloys are 0.32 and 0.28, respectively, which further proves that these two alloys easily form a dual-phase structure.
Table 4Atomic radius difference and mixing enthalpy between the various elements in CoCuNiTiX0.6 (X = Mn, Al) HEACs
Element | Co | Cu | Ni | Ti | Mn | Al | ||
Atomic-size difference (%) | Co | – | 6 | 0 | –28 | –5 | –19 | Mixing enthalpy (kJ/mol) |
Cu | 1.19 | – | 4 | –9 | 4 | –1 | ||
Ni | 0.00 | 1.19 | – | –35 | –8 | –22 | ||
Ti | 7.75 | 6.57 | 7.75 | – | –8 | –30 | ||
Mn | 0.40 | 0.79 | 0.40 | 7.35 | – | –19 | ||
Al | 6.72 | 5.54 | 6.72 | 1.04 | 6.32 | – |
Table 5Thermodynamic parameters of CoCuNiTiX0.6(X = Mn, Al) HEACs
Alloy | (kJ/mol) | (J/K/mol) | (kJ/mol) | (%) | Ω | VEC | Λ |
CoCuNiTiMn0.6 | –13.65 | 13.24 | –17.60 | 6.40 | 1.61 | 8.30 | 0.32 |
CoCuNiTiAl0.6 | –19.89 | 13.24 | –23.83 | 6.87 | 1.03 | 7.78 | 0.28 |
3.2. Microstructure analysis
Fig. 3 and Fig. 4 show the OM photos and SEM images of CoCuNiTiX0.6 (X = Mn, Al) HEACs, respectively. As shown in Figs. 3 and 4, the microstructure of CoCuNiTiX0.6 (X = Mn, Al) exhibits a typical dendritic structure. As shown in Fig.3, there are thin and approximately equal-width small zones on the side of the cladding layer of the two alloys close to the substrate. This is because the cooling rate and temperature gradient near the substrate are the largest, and the fine grain zone is rapidly formed on the surface of the substrate [36, 37]. The columnar crystal zone grows into the liquid metal next to the fine grain zone on the surface. Owing to the maximum temperature gradient perpendicular to the surface of the substrate, columnar crystals with unfavorable orientations are eliminated by other solid phases during the growth process. During the competition for preferential growth, columnar crystals rapidly grow in the direction opposite to the temperature gradient, resulting in a microstructure nearly perpendicular to the fusion line. The length and width of columnar crystal growth of CoCuNiTiMn0.6 are significantly larger than those of CoCuNiTiAl0.6. This is because the growth of the columnar crystal zone ends with the formation of an internal equiaxed crystal region. According to Table 2, the melting point of all elements in the CoCuNiTiMn0.6 alloy is between 1660 °C and 1083 °C, and the temperature range is less than 600 °C. During the preparation of alloy coatings by laser cladding, as the heat source leaves, the smaller volume of the molten pool rapidly solidifies, resulting in high viscosity, poor fluidity, slow atomic diffusion, and long diffusion distance of the CoCuNiTiMn0.6 alloy melt. It takes a long time to achieve heterogeneous nucleation and generate internal equiaxed crystals through “composition undercooling” inside the melt, thereby forming a coarse columnar crystal structure. Owing to the high viscosity and poor fluidity, the volume shrinkage caused by thermal expansion and cold contraction at the end of solidification is difficult to be fed, so it is easy to form defects such as pores (see Fig. 3(a)). In the CoCuNiTiAl0.6 alloy, Al with the lowest melting point can significantly reduce the viscosity inside the melt and enhance the fluidity of the liquid metal due to its relatively late precipitation time, which is conducive to improving the atomic diffusion rate inside the melt and reducing the diffusion time and resistance. Simultaneously, this is also beneficial for the forced convection of atomic clusters with different compositions and structures (such as density flow) to reduce the temperature gradient inside the melt, which is conducive to the growth of equiaxed dendrites, and the welding defects caused by volume shrinkage. This comprehensive effect promotes the formation of a dendritic structure composed of a narrow columnar crystal zone and a wide equiaxed crystal zone in the CoCuNiTiAl0.6 alloy.
Fig. 3OM photos of CoCuNiTiX0.6 (X = Mn, Al) HEACs
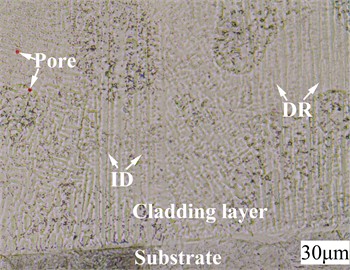
a) CoCuNiTiMn0.6
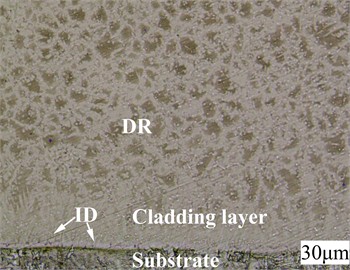
b) CoCuNiTiAl0.6
Fig. 4SEM images of CoCuNiTiX0.6 (X= Mn, Al) HEACs
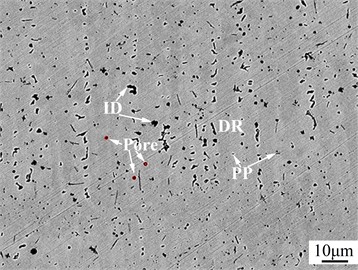
a) CoCuNiTiMn0.6
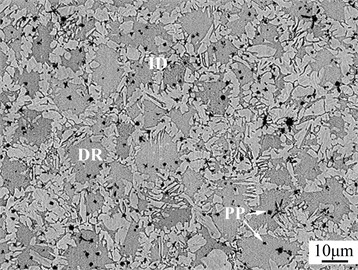
b) CoCuNiTiAl0.6
As shown in Fig. 4, CoCuNiTiX0.6 (X = Mn, Al) HEACs are composed of dendrite (DR) regions embedded with primary phases (PP) and interdendrite (ID) regions. To better understand the distribution of various alloying elements in different regions, the segregation factor and the average segregation factor were introduced after deducting the Fe element introduced by the “excavation effect” of the substrate during the laser cladding process [38]:
where represents the directional coefficient. When the alloying element is enriched in the dendrite region, 1; when the alloying element is enriched in the interdendrite region, –1. and represent the concentrations of the same alloying element in ID and DR regions, respectively. represents the element segregation coefficient of the -th component. The larger the absolute value of , the larger the difference of the same alloying element in DR and ID regions. 0 and 0 indicate the enrichment of alloying elements in DR and ID regions, respectively. The larger the value, the greater the overall segregation degree of each alloying element in the alloy system. Table 6 shows the EDS results for CoCuNiTiX0.6 (X = Mn, Al) HEACs. The value in Table 6 was calculated using Eq. (12). Using Eq. (13), the average segregation coefficients of CoCuNiTiMn0.6 and CoCuNiTiAl0.6 alloys are 23.39 % and 10.64 %, respectively, indicating that the average segregation degree of various alloying elements in Al-containing alloys is lower than that of Mn-containing alloys. This is related to the previous analysis that Al addition can improve the alloy fluidity, reduce the melt viscosity, and decrease the diffusion distance and resistance of the alloy. In addition, as shown in Table 6, the Ti content in the primary phase of the two alloys is the highest, mainly because Ti has the highest melting point (see Table 2). During the cooling of the melt, Ti preferentially reaches and meets the required undercooling degree for precipitation, thus forming a Ti-rich primary phase. As the melt temperature further decreases, other alloying elements also gradually reach the precipitation temperature. All other alloying elements exhibit the maximum negative mixing enthalpy with Ti, so the atomic clusters enriched with these elements in the melt tightly bind with Ti. To reduce nucleation resistance, later-precipitated solid phases adhere to the rough surface of Ti-rich primary phase for non-uniform nucleation, thereby forming DR regions inlaid with primary phases. Consequently, Ti concentrations are relatively high in DR regions. This is also consistent with the results in Table 6, which show that both alloys have positive segregation coefficients for Ti. According to Table 6, both alloys exhibit negative segregation coefficients for Cu, indicating its tendency to enrich in ID regions. This is mainly because Cu has the smallest negative mixing enthalpy or the largest positive mixing enthalpy with other alloying elements and is easily squeezed into the edge region of the atomic cluster in the melt. In addition, owing to its low melting point and subsequent precipitation, it is easy to enrich in the interdendrite region during the latest solidification.
Table 6EDS composition of the phases determined in CoCuNiTiMn0.6 and CoCuNiTiAl0.6 HEACs
Alloy | Region | Atomic fraction (at%) | |||||
Co | Cu | Ni | Ti | Mn | Al | ||
CoCuNiTiMn0.6 | Nominal | 21.74 | 21.74 | 21.74 | 21.74 | 13.04 | – |
PP | 14.75 | 22.54 | 24.18 | 29.51 | 9.02 | – | |
DR | 10.86 | 23.68 | 25.00 | 25.66 | 14.80 | – | |
ID | 23.10 | 25.27 | 22.28 | 15.76 | 13.59 | – | |
K (%) | –53.00 | –6.28 | 10.87 | 38.57 | 8.21 | – | |
CoCuNiTiAl0.6 | Nominal | 21.74 | 21.74 | 21.74 | 21.74 | – | 13.04 |
PP | 14.29 | 12.77 | 13.20 | 45.89 | – | 13.85 | |
DR | 25.38 | 20.80 | 23.24 | 16.51 | – | 14.07 | |
ID | 22.31 | 25.00 | 24.73 | 16.13 | – | 11.83 | |
K (%) | 12.10 | –16.82 | –6.02 | 2.33 | – | 15.92 | |
3.3. Corrosion performance
Fig.5 shows the potentiodynamic polarization curves of the CoCuNiTiX0.6 (X = Mn, Al) HEACs in 3.5 wt% NaCl solution. From Fig.5, CoCuNiTiMn0.6 and CoCuNiTiAl0.6 HEACs showed an obvious passivation phenomenon. During the polarization process, the formation of a passivation film helps to resist the corrosion of the NaCl solution. The self-corrosion current density () and potential (), anode () and cathode () Tafel slope of both alloys can be obtained by extrapolation, and the fitting results are listed in Table 7. The polarization resistance and annual corrosion rate in Table 7 can be expressed as [39]:
where is approximately 3272 mm/(A·cm·year), EW is the equivalent weight of the sample (), is the sample density (g·cm-3), is the mass fraction of component , is the exchange electron number of component (mol-1), and is the atomic weight of component (g/mol). According to Table 7, compared with CoCuNiTiAl0.6 HEAC, CoCuNiTiMn0.6 HEAC has a higher corrosion potential and a lower self-corrosion current density, indicating a lower corrosion tendency of the alloy. From Eq. (15), the annual corrosion rate is positively correlated with . Therefore, the annual corrosion rate of CoCuNiTiMn0.6 HEAC is also relatively low. However, a large polarization amplitude in the polarization test may destroy the passivation film, resulting in the distortion of measured using the polarization curve. Slightly disturbed electrochemical impedance spectroscopy (EIS) better reflects the true protective performance of the film layer. This phenomenon is consistent with literature [40, 41].
Fig. 5Potentiodynamic polarization curves of CoCuNiTiX0.6 (X = Mn, Al) HEACs in 3.5 wt% NaCl solution
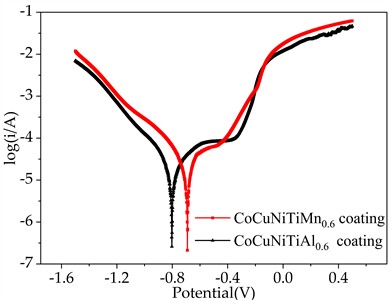
Table 7Electrochemical parameters of CoCuNiTiX0.6(X=Mn, Al) HEACs in 3.5 wt% NaCl solution
Samples | (V) | (mV) | (mV) | (μA·cm-2) | (Ω·cm2) | (mm/Year)×10-2 |
CoCuNiTiMn0.6 | –0.691 | 171.97 | 432.15 | 15.17 | 3525.62 | 11.95 |
CoCuNiTiAl0.6 | –0.803 | 179.08 | 241.20 | 15.89 | 2812.93 | 16.61 |
Fig. 6 shows the electrochemical impedance profiles of CoCuNiTiX0.6 (X = Mn, Al) HEACs in 3.5 wt% NaCl solution. From Fig. 6(a), the Nyquist plots of the CoCuNiTiMn0.6 and CoCuNiTiAl0.6 HEACs show a flattened semicircular arc. This indicates that charge transfer occurs between the coating surface and the solution, and the electric field distribution of the electric double layer formed by this charge separation is not uniform. The capacitive arc radius of Al-containing alloy is obviously larger than that of Mn-containing alloy, indicating that Al-containing alloys have stronger corrosion resistance. According to Fig. 6(b), the maximum phase angles of CoCuNiTiMn0.6 and CoCuNiTiAl0.6 alloys are –54.95° and –56.91°, respectively. Under similar corrosion systems and equivalent circuit models, the larger the absolute value of the maximum phase angle, the closer the electrode performance to an ideal and dense capacitance interface. The constant phase angle element CPE1, phase shift , and charge transfer resistance in Table 8 were fitted using the equivalent circuit illustrated in Fig. 6(a). The fitting results are marked in Fig. 6 using a combination of dotted lines and hollow symbols. The data obtained from the experiments are marked by a combination of solid lines and symbols. The fitting curve (FC) was close to the experimental curve (EC). The impedance can be expressed as [42]:
where is the scaling factor, is the imaginary unit, and is the angular frequency, and represents the degree of capacitance dispersion. The smaller the value of , the less influence the porous structure exerts [43]. The values of CoCuNiTiMn0.6 and CoCuNiTiAl0.6 HEACs are 0.7318 and 0.7544, respectively. The value of CoCuNiTiAl0.6 is closer to 1, indicating that its passivation film is denser and the surface uniformity is better than that of the Mn-containing alloy, which is in line with SEM and EDS results. The formation of pores increases the surface area exposed to corrosion and distorts the double layer, providing preferential diffusion pathways for Cl⁻ ions, which causes the CPE behavior to deviate significantly from the ideal capacitance behavior [39, 44]. The of CoCuNiTiAl0.6 is 2028.00 Ω·cm2, which is approximately 2.49 times that of CoCuNiTiMn0.6 (815.70 Ω·cm2), indicating that its charge transfer resistance is greater. According to the theory of the impedance modulus of a passivation alloy or coating system [45, 46], at sufficiently low frequencies (such as 0.1 Hz), the response of electrochemical impedance spectroscopy mainly reflects the charge transfer process occurring at the corrosion interface or the capacitive behavior of the passivation film, and its corresponding values are related to the charge transfer resistance or the passivation film impedance. In the passivation system, the impedance modulus at 0.1 Hz can be used as an approximate index to evaluate the corrosion resistance of the coatings. The of CoCuNiTiAl0.6 HEAC at 0.1 Hz is 1698.35 Ω·cm2, which is approximately 2.53 times that of the Mn-containing alloy (670.34 Ω·cm2) and similar to the ratio. This further confirms that porosity defects significantly reduce the overall protective performance and CoCuNiTiAl0.6 HEAC exhibits better corrosion resistance. The corrosion resistance of CoCuNiTiAl0.6 HEAC is relatively good owing to its dense passive film, few defects, and relatively uniform composition distribution.
Fig. 6Electrochemical impedance profiles of CoCuNiTiX0.6 (X = Mn, Al) HEACs in 3.5 wt% NaCl solution
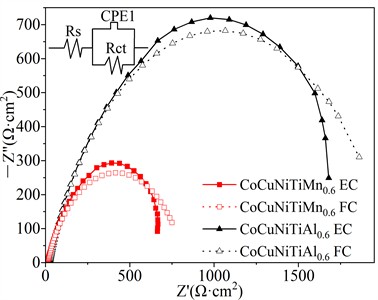
a) Nyquist plots
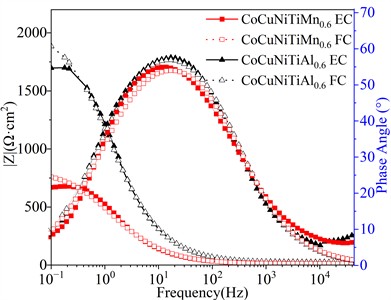
b) Bode plots
Table 8EIS parameters of CoCuNiTiX0.6(X = Mn, Al) HEACs in 3.5 wt% NaCl solution
Samples | (Ω·cm2) | CPE1 (μF·cm-2) | m | (Ω·cm2) |
CoCuNiTiMn0.6 | 11.73 | 323.90 | 0.7318 | 815.70 |
CoCuNiTiAl0.6 | 23.88 | 137.00 | 0.7544 | 2028.00 |
4. Conclusions
In summary, this study systematically investigated the microstructural evolution and corrosion resistance of CoCuNiTiX0.6 (X = Mn, Al) HEACs fabricated via laser cladding. The main conclusions and contributions of this study are as follows:
1) Both CoCuNiTiX0.6 (X = Mn, Al) exhibit a dual structure composed of FCC and BCC. The former is dominated by FCC phase, while the latter is dominated by BCC phase. The lattice constants and unit cell volumes of FCC and BCC in the CoCuNiTiAl0.6 alloy are relatively large, primarily due to lattice distortion caused by the significant atomic radius differences between Al and the other elements. Whole pattern fitting and Rietveld refinement was employed to refine the X-ray diffraction data of CoCuNiTiMn0.6 and CoCuNiTiAl0.6 yielding refinement weighting factors of 4.66 % and 3.31 %, respectively. The , , , , , VEC, and for CoCuNiTiMn0.6 and CoCuNiTiAl0.6 are –13.65 kJ/mol, 13.24 J/K/mol, –17.60 kJ/mol, 6.40, 1.61, 8.30, 0.32, and –19.89 kJ/mol, 13.24 J/K/mol, –23.83 kJ/mol, 6.87, 1.03, 7.78, 0.28, respectively.
2) The microstructure of CoCuNiTiX0.6 (X = Mn, Al) HEACs is dendritic structures, mainly composed of fine-grained regions, columnar regions, and equiaxed regions. The columnar crystal growth in CoCuNiTiMn0.6 alloy is significantly longer and wider than that in CoCuNiTiAl0.6 alloy. Pore defects were observed in both the metallographic photographs and SEM images of the CoCuNiTiMn0.6 alloy. The average segregation coefficients for CoCuNiTiMn0.6 and CoCuNiTiAl0.6 alloys are 23.39 % and 10.64 %, respectively, which are mainly related to factors such as Al addition enhancing alloy fluidity, reducing melt viscosity, and decreasing diffusion distance and resistance.
3) Both CoCuNiTiMn0.6 and CoCuNiTiAl0.6 HEACs exhibit passivation phenomena, with their Nyquist plots displaying a flattened semicircular arc. The capacitance arc radius, maximum phase angle, and m value are larger for the Al-containing alloy, indicating its relatively excellent corrosion resistance. This is mainly attributed to its dense passivation film, few defects, and more uniform composition distribution.
References
-
J. W. Yeh et al., “Nanostructured high-entropy alloys with multiple principal elements: novel alloy design concepts and outcomes,” Advanced Engineering Materials, Vol. 6, No. 5, pp. 299–303, 2004, https://doi.org/10.1002/adem.200300567
-
B. Cantor, I. T. H. Chang, P. Knight, and A. J. B. Vincent, “Microstructural development in equiatomic multicomponent alloys,” Materials Science and Engineering: A, Vol. 375-377, pp. 213–218, 2004, https://doi.org/10.1016/j.msea.2003.10.257
-
C. Zhang et al., “Rapid synthesis of subnanoscale high-entropy alloys with ultrahigh durability,” Nature Materials, Vol. 25, No. 1, pp. 26–34, 2025, https://doi.org/10.1038/s41563-025-02358-9
-
Y.-F. Yang et al., “High entropy alloys: a review of preparation techniques, properties and industry applications,” Journal of Alloys and Compounds, Vol. 1010, p. 177691, 2024, https://doi.org/10.1016/j.jallcom.2024.177691
-
J. Liang, G. Cao, M. Zeng, and L. Fu, “Controllable synthesis of high-entropy alloys,” Chemical Society Reviews, Vol. 53, No. 12, pp. 6021–6041, 2024, https://doi.org/10.1039/d4cs00034j
-
S. Guo, Q. Hu, C. Ng, and C. T. Liu, “More than entropy in high-entropy alloys: forming solid solutions or amorphous phase,” Intermetallics, Vol. 41, pp. 96–103, 2013, https://doi.org/10.1016/j.intermet.2013.05.002
-
Y. Zhang et al., “Microstructures and properties of high-entropy alloys,” Progress in Materials Science, Vol. 61, pp. 1–93, 2013, https://doi.org/10.1016/j.pmatsci.2013.10.001
-
K. X. Zheng et al., “Laser cladding of FeCoCrNiTi high-entropy alloy coatings to modulate the microstructure and enhance the tribo-corrosion behavior on 304 stainless steel,” Surface and Coatings Technology, Vol. 505, p. 132114, 2025, https://doi.org/10.1016/j.surfcoat.2025.132114
-
M. Feng, T. Lin, G. Lian, C. Chen, and X. Huang, “The influence of WC content on the microstructure and properties of laser cladding CoCrFeMnNiSi1.6 high-entropy alloy coatings,” Ceramics International, Vol. 50, No. 24, pp. 55286–55306, 2024, https://doi.org/10.1016/j.ceramint.2024.10.384
-
M. Ma, L. Zhao, Z.-X. Wang, S.-Z. Li, and C. Dong, “Effect of CeO2 doping on the microstructure and corrosion behavior of CoCuNiTi high-entropy alloy coatings,” Materiali in Tehnologije, Vol. 55, No. 6, pp. 861–869, 2021, https://doi.org/10.17222/mit.2021.286
-
J. Yi, L. Yang, M. Xu, and L. Wang, “Investigation of a novel CoCrCuNiTi high entropy alloy on microstructure and mechanical properties,” Russian Journal of Non-Ferrous Metals, Vol. 62, No. 2, pp. 197–205, 2021, https://doi.org/10.3103/s1067821221020073
-
J. Yi, L. Yang, L. Wang, and M. Xu, “Novel, equimolar, multiphase CoCuNiTiV high-entropy alloy: phase component, microstructure, and compressive properties,” Metals and Materials International, Vol. 27, No. 7, pp. 2387–2394, 2021, https://doi.org/10.1007/s12540-020-00923-2
-
S. Mohanty et al., “Hierarchical phase separation of equiatomic CoCuFeNiTi high-entropy alloy during spark plasma sintering,” Journal of Materials Science, Vol. 60, No. 3, pp. 1424–1438, 2024, https://doi.org/10.1007/s10853-024-10454-5
-
F. Zhao, X. Zhao, T. Jiang, R. Zhao, and F. Wu, “Comprehensive study of CoCrCuNi high-entropy alloys: effects of preparation, heat treatment, computational simulation, and alloying elements,” Metals, Vol. 14, No. 11, p. 1240, Oct. 2024, https://doi.org/10.3390/met14111240
-
Y.-S. Lu, K. Yamanaka, H. Ishii, T.-X. Bui, Y.-J. Hsieh, and T.-H. Fang, “Deformation mechanisms of multiphase AlCoCuFeNiTi high-entropy alloys revealed by machine learning-assisted molecular dynamics,” Materials Today Physics, Vol. 59, p. 101900, 2025, https://doi.org/10.1016/j.mtphys.2025.101900
-
W.-R. Wang, W.-L. Wang, S.-C. Wang, Y.-C. Tsai, C.-H. Lai, and J.-W. Yeh, “Effects of Al addition on the microstructure and mechanical property of AlxCoCrFeNi high-entropy alloys,” Intermetallics, Vol. 26, pp. 44–51, Apr. 2012, https://doi.org/10.1016/j.intermet.2012.03.005
-
Y. Y. Liu, Z. Chen, J. C. Shi, Z. Y. Wang, and J. Y. Zhang, “The effect of Al content on microstructures and comprehensive properties in AlxCoCrCuFeNi high entropy alloys,” Vacuum, Vol. 161, pp. 143–149, Dec. 2018, https://doi.org/10.1016/j.vacuum.2018.12.009
-
G. Shang, J. Wang, Z.-Z. Liu, and X.-G. Lu, “Effect of Al content on microstructure and mechanical properties of the fcc and bcc phases of AlxCoCrFeNi high entropy alloys,” Metals and Materials International, Vol. 30, No. 8, pp. 2057–2066, 2024, https://doi.org/10.1007/s12540-024-01635-7
-
Q. Gao et al., “Al content regulation of microstructure, wear resistance, and corrosion behavior in Mo0.5NbTiZrAlx high-entropy alloys,” Journal of Alloys and Compounds, Vol. 1017, p. 179037, 2025, https://doi.org/10.1016/j.jallcom.2025.179037
-
Y. Yan, L. Fang, Y. Tan, X. Tao, Y. Ouyang, and Y. Du, “Mechanical properties and corrosion resistance of AlxCoCuFeMn high-entropy alloys,” Journal of Materials Research and Technology, Vol. 24, pp. 5250–5259, 2023, https://doi.org/10.1016/j.jmrt.2023.04.116
-
X. Li et al., “Microstructures and properties of AlCrFeNiMnx high-entropy alloy coatings fabricated by laser cladding on a copper substrate,” Journal of Alloys and Compounds, Vol. 926, p. 166778, 2022, https://doi.org/10.1016/j.jallcom.2022.166778
-
D. Zhang, Q. Li, R. Sun, C. Chang, B. Liu, and X. Ma, “Effect of Mn addition on microstructure and corrosion behavior of AlCoCrFeNi high-entropy alloy,” Intermetallics, Vol. 167, p. 108236, Feb. 2024, https://doi.org/10.1016/j.intermet.2024.108236
-
Q. Zhao et al., “Effect of alloying elements (Mn, Ti, and Mo) on the corrosion behavior of FeCoNiCr-based high entropy alloy in supercritical water,” Corrosion Science, Vol. 220, p. 111291, 2023, https://doi.org/10.1016/j.corsci.2023.111291
-
Q. Chen, L. Shi, G. Xu, M. Hu, M. Peng, and Z. Yao, “Noble metal-free XFeCoNiCu (X = Cr, Mg, and Mn) high entropy alloys for efficient ORR/OER bifunctional catalysis,” Colloids and Surfaces A: Physicochemical and Engineering Aspects, Vol. 709, No. 1, p. 136106, 2025, https://doi.org/10.1016/j.colsurfa.2025.136106
-
Y. Zeng et al., “Effect of Ti, Mn and Mo on the microstructure and properties of CoCrFeNi high entropy alloy coatings prepared by laser cladding,” Materials Today Communications, Vol. 41, p. 110509, 2024, https://doi.org/10.1016/j.mtcomm.2024.110509
-
M. X. Ma et al., “Microstructure and wear resistance of AlCoCrCuFe high-entropy alloy,” (in Chinese), Adv. Eng. Sci, Vol. 50, No. 4, pp. 208–213, 2018, https://doi.org/10.15961/j.jsuese.201701019
-
X. Liu, P. Yuwen, R. Pan, and C. Zhou, “Microstructure and oxidation behavior of Alx(CrFeCoCuNi)100-x composition spread thin film,” Thin Solid Films, Vol. 815, p. 140645, Feb. 2025, https://doi.org/10.1016/j.tsf.2025.140645
-
Z. Zhang et al., “The effect of Al on the phase formation and micromechanical property of FeCoNiCuAlx (x = 0.6-1.2),” Materials Characterization, Vol. 231, p. 115929, 2025, https://doi.org/10.1016/j.matchar.2025.115929
-
X.-H. Gu, H.-J. Yan, Q.-H. Zhang, X.-Z. Meng, L.-K. Wu, and F.-H. Cao, “Microstructure characterization and corrosion behavior of Alx(CoCrFeNi)100−x (x = 0, 5, 10, 15, 20) high entropy alloys in 0.5 M H2SO4 solution,” Journal of Alloys and Compounds, Vol. 944, p. 169247, 2023, https://doi.org/10.1016/j.jallcom.2023.169247
-
A. Takeuchi and A. Inoue, “Classification of bulk metallic glasses by atomic size difference, heat of mixing and period of constituent elements and its application to characterization of the main alloying element,” MATERIALS TRANSACTIONS, Vol. 46, No. 12, pp. 2817–2829, 2006, https://doi.org/10.2320/matertrans.46.2817
-
S. Guo and C. T. Liu, “Phase stability in high entropy alloys: Formation of solid-solution phase or amorphous phase,” Progress in Natural Science: Materials International, Vol. 21, No. 6, pp. 433–446, 2012, https://doi.org/10.1016/s1002-0071(12)60080-x
-
A. K. Singh, N. Kumar, A. Dwivedi, and A. Subramaniam, “A geometrical parameter for the formation of disordered solid solutions in multi-component alloys,” Intermetallics, Vol. 53, pp. 112–119, May 2014, https://doi.org/10.1016/j.intermet.2014.04.019
-
X. Yang and Y. Zhang, “Prediction of high-entropy stabilized solid-solution in multi-component alloys,” Materials Chemistry and Physics, Vol. 132, No. 2-3, pp. 233–238, 2012, https://doi.org/10.1016/j.matchemphys.2011.11.021
-
Y. Zhang et al., “Guidelines in predicting phase formation of high-entropy alloys,” MRS Communications, Vol. 4, No. 2, pp. 57–62, 2014, https://doi.org/10.1557/mrc.2014.11
-
S. Guo, “Phase selection rules for cast high entropy alloys: An overview,” Materials Science and Technology, Vol. 31, No. 10, pp. 1223–1230, 2015, https://doi.org/10.1179/1743284715y.0000000018
-
M. Ma et al., “Effect of diamond content on microstructure and wear/corrosion resistance of CoCuNiTi + x diamond (C) (x = 0, 0.5, and 1.0 wt.%) high-entropy alloy coatings,” Coatings, Vol. 16, No. 3, p. 288, Feb. 2026, https://doi.org/10.3390/coatings16030288
-
H. Liu, R. Yin, Q. Zou, J. Zhang, Z. Liu, and X. Zhang, “Effects of micro-twin lamellar structure on the mechanical properties and fracture morphology of AZ31 Mg alloy,” Materials Science and Engineering: A, Vol. 745, pp. 221–230, 2018, https://doi.org/10.1016/j.msea.2018.12.113
-
M. Ma, C. Zhu, Z. Wang, Y. Xi, and B. Wang, “Effect of Si addition on phase structure and wear resistance of CoCrFeMoNi alloy coatings,” Journal of Measurements in Engineering, Vol. 13, No. 3, pp. 534–546, 2025, https://doi.org/10.21595/jme.2025.24649
-
M. Ma et al., “Microstructure and wear and corrosion resistance of CoCrFeMoNiSix (x = 0.25, 0.50, 0.75) HEACs prepared by plasma cladding,” Crystals, Vol. 15, No. 2, p. 123, Jan. 2025, https://doi.org/10.3390/cryst15020123
-
X. X. Wei et al., “Enhanced corrosion resistance by engineering crystallography on metals,” Nature Communications, Vol. 13, No. 1, p. 726, 2022, https://doi.org/10.1038/s41467-022-28368-8
-
J.-M. Atebamba, J. Moskon, S. Pejovnik, and M. Gaberscek, “On the interpretation of measured impedance spectra of insertion cathodes for lithium-ion batteries,” Journal of the Electrochemical Society, Vol. 157, No. 11, p. A1218, 2010, https://doi.org/10.1149/1.3489353
-
M. Ma et al., “Effect of Mn doping on microstructure and corrosion behavior of CoCuNiTi high-entropy alloy coatings,” Crystals, Vol. 15, No. 1, p. 29, Dec. 2024, https://doi.org/10.3390/cryst15010029
-
A. A. Alamdari, U. Unal, and A. Motallebzadeh, “Investigation of microstructure, mechanical properties, and biocorrosion behavior of Ti1.5ZrTa0.5Nb0.5W0.5 refractory high-entropy alloy film doped with Ag nanoparticles,” Surfaces and Interfaces, Vol. 28, p. 101617, 2021, https://doi.org/10.1016/j.surfin.2021.101617
-
M. Zhang, Y. Zhang, H. Liu, and Q. Zou, “Judgment criterion of the dominant factor of creep-fatigue crack growth in a nickel-based superalloy at elevated temperature,” International Journal of Fatigue, Vol. 118, pp. 176–184, 2018, https://doi.org/10.1016/j.ijfatigue.2018.09.007
-
Y. Zuo, R. Pang, W. Li, J. P. Xiong, and Y. M. Tang, “The evaluation of coating performance by the variations of phase angles in middle and high frequency domains of EIS,” Corrosion Science, Vol. 50, No. 12, pp. 3322–3328, 2008, https://doi.org/10.1016/j.corsci.2008.08.049
-
T. Jaśniok, M. Jaśniok, and A. Skórkowski, “Diagnostics of large non-conductive anti-corrosion coatings on steel structures by means of electrochemical impedance spectroscopy,” Materials, Vol. 14, No. 14, p. 3959, Jul. 2021, https://doi.org/10.3390/ma14143959
About this article

This work was supported by the Henan Province Science and Technology Research Project (252102221051, 252102231020), Key Scientific Research Projects of Henan Province (25A510001), International Science and Technology Cooperation Project of Henan Province (242102520005).
The datasets generated during and/or analyzed during the current study are available from the corresponding author on reasonable request.
Mingxing Ma: conceptualization, data curation, formal analysis, funding acquisition, investigation, software, visualization, writing-original draft preparation. Nanya Li: data curation, formal analysis, resources, software, validation. Chengjun Zhu: funding acquisition, investigation, project administration, resources, supervision. Zhixin Wang: conceptualization, data curation, funding acquisition, project administration, supervision, validation, writing-review and editing. Yanjun Xi: investigation, methodology, resources, supervision. Bozhen Wang: data curation, formal analysis, investigation, methodology, resources, software, validation, writing-review and editing.
The authors declare that they have no conflict of interest.

