Abstract
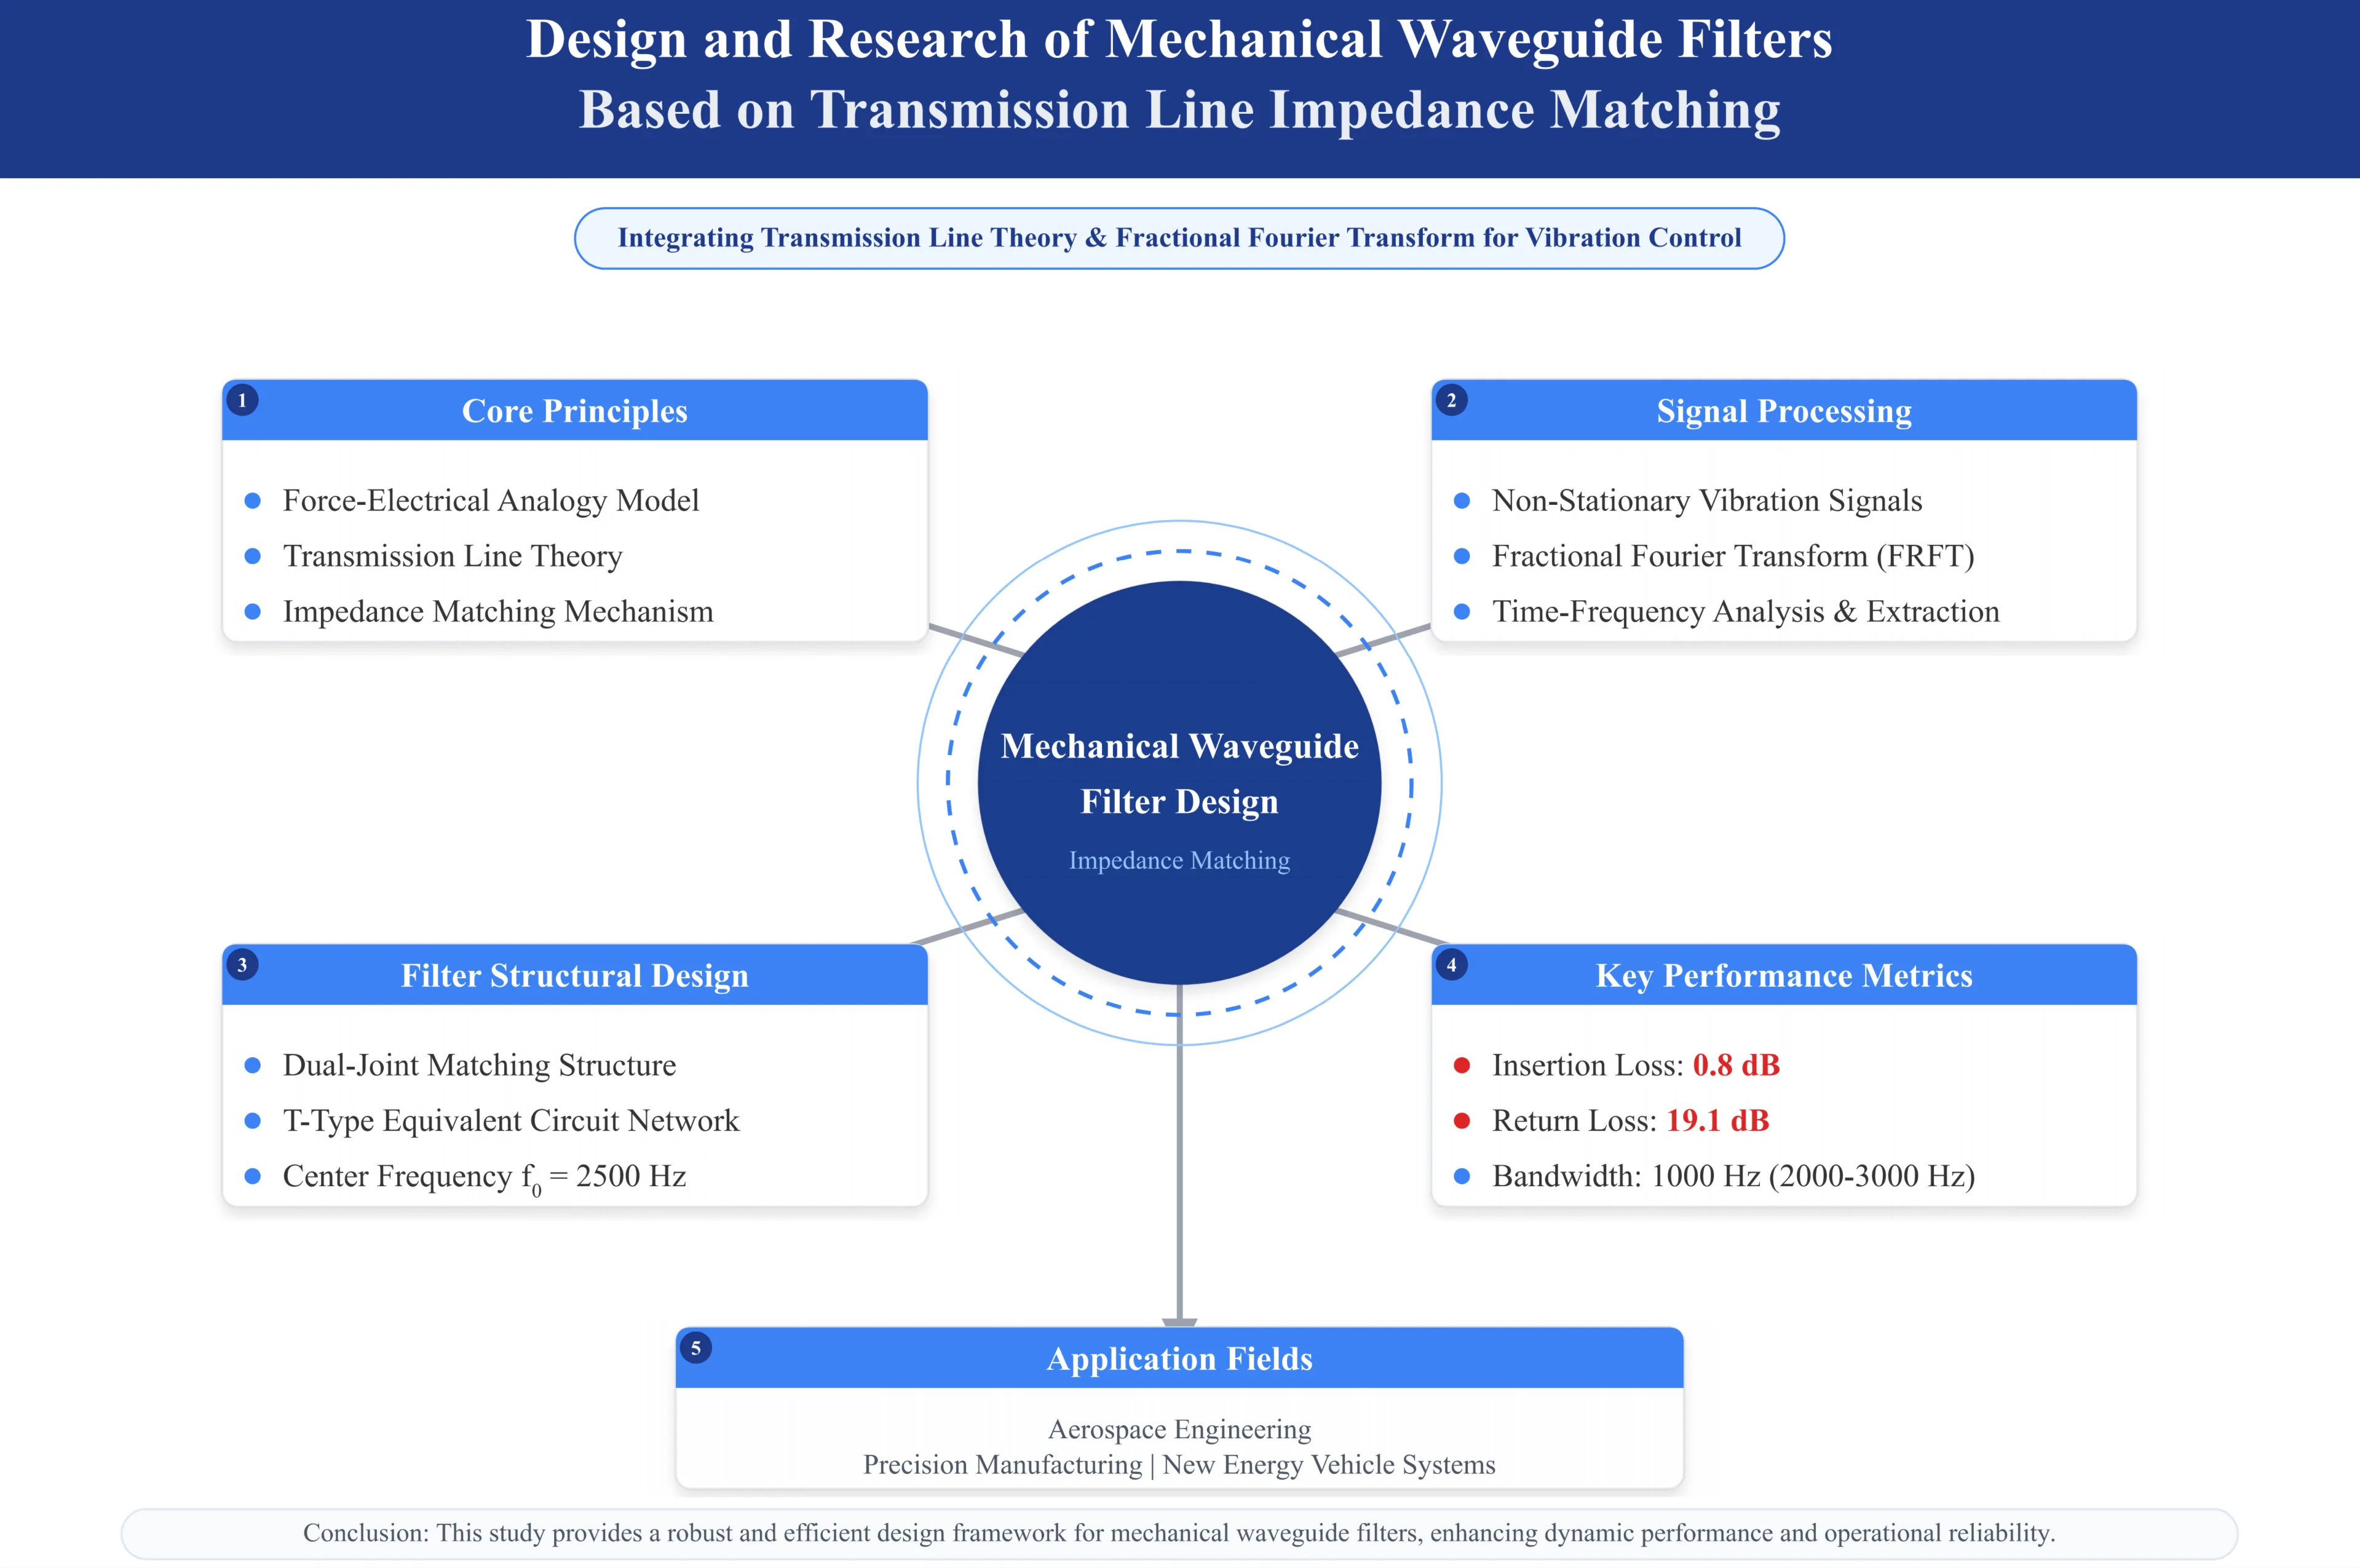
In response to the growing demand for advanced vibration and noise suppression in high-end equipment within the manufacturing sector, this paper proposes a novel design method for mechanical waveguide filters based on transmission line impedance matching theory. By establishing a precise force-electric analogy model, this approach effectively bridges mature circuit theory with mechanical dynamics, enabling the accurate prediction and control of elastic wave propagation. To address the prevalent issue of non-stationary vibration signals in industrial applications the Fractional Fourier Transform is innovatively employed for superior time-frequency analysis. The designed dual-joint matching filter validates this methodology, exhibiting outstanding performance at a center frequency of 2500 Hz with an insertion loss of 0.8 dB and a return loss of 19.1 dB. The filter also demonstrates sharp frequency selectivity, effective stopband suppression, and stable phase response, which are critical for maintaining signal integrity in precision systems. This research, which integrates theoretical modeling, equivalent circuit analysis, and advanced signal processing, provides a robust and efficient design framework. The proposed technique offers significant practical value for the mechanical industry, presenting a viable solution to enhance the dynamic performance, operational reliability, and noise control in modern mechanical systems, with direct applicability in fields such as aerospace, precision manufacturing, and automotive engineering.
Highlights
- A mechanical waveguide filter design method is proposed based on transmission line impedance matching theory and force electrical analogy modeling.
- The Fractional Fourier Transform is employed for superior time frequency analysis of non stationary vibration signals in mechanical systems.
- The dual joint matching filter achieves a low insertion loss of 0.8 dB and a high return loss of 19.1 dB at a center frequency of 2500 Hz.
- Sharp frequency selectivity and flat in band group delay confirm excellent signal integrity and effective stopband suppression.
- The framework offers direct applicability in aerospace, precision manufacturing, and automotive engineering for enhanced vibration control.
1. Introduction
Mechanical waveguides serve as physical channels for the propagation of elastic waves, playing a crucial role in the field of vibration energy regulation. Their performance directly affects the dynamic characteristics and operational reliability of high-end equipment [1]. With the global manufacturing industry accelerating its transformation towards intelligence and precision, especially under the impetus of the carbon neutrality goal, strategic industries such as aerospace, new energy vehicles, and precision optics have put forward more stringent requirements for vibration control technology [2]. Traditional passive vibration damping methods face severe challenges in terms of efficiency, weight, and adaptability, and new waveguide filtering technologies are urgently needed to achieve precise regulation of vibration energy.
In this context, drawing on the mature circuit transmission line theory to design mechanical filters shows great potential. Mechanical systems and circuit systems have profound mathematical isomorphism in wave propagation characteristics, providing a theoretical basis for transplanting electromagnetic impedance matching technology to the field of mechanical vibration control [3]. Many research teams have made significant progress in this direction, Tahriri et al. [4] conducted systematic research on the bandgap characteristics of phononic crystal waveguides, laying the physical foundation for the design of waveguide filters. Valappil and Aragón's pioneering work [5] in localized resonant metamaterials demonstrated its outstanding performance in low-frequency vibration control. More recently, Shukla et al. [6] explored impedance mismatch approaches in RF power amplifier design, which, although in the electromagnetic domain, provides valuable insights for mechanical filter synthesis through the analogy framework. Javier et al. [7] developed an equivalent lattice-modified model for phononic crystals with locally resonant elements, revealing the interaction mechanisms between Bragg bandgaps and resonant stop bands. Elbathaoui et al. [8] recently proposed a compact wideband bandpass filter design incorporating metamaterial structures, highlighting the importance of impedance matching in achieving desired frequency responses. Kim [9] presented a design methodology for distributed impedance-matching networks in ultra-wideband low-noise amplifiers, further emphasizing the versatility of impedance matching techniques across different physical domains. These advances collectively suggest that impedance matching principles, well-established in electromagnetics and acoustics, can be effectively translated to mechanical waveguide systems for filter design.
The current research faces two key challenges. On one hand, mechanical vibration signals generally exhibit non-stationary characteristics, especially in rotating machinery with variable speed and structures subjected to impact loads, traditional Fourier analysis methods are difficult to accurately describe their time-varying characteristics. On the other hand, existing filtering methods based on periodic structures still have limitations in flexible regulation of bandwidth and frequency. While the aforementioned studies have made significant contributions to understanding wave propagation in periodic and resonant structures, they primarily focus on bandgap characteristics or specific impedance matching implementations without establishing a systematic design framework that bridges circuit theory and mechanical waveguide filtering. Furthermore, the integration of advanced time-frequency analysis methods for non-stationary vibration signals in the context of mechanical filter design remains underexplored.
The innovation boundary of this work extends beyond conventional phononic crystal or metamaterial-based approaches by providing a theoretically grounded, circuit-inspired design framework that enables precise control of elastic wave propagation while accommodating the complexities of real-world vibration signals.
This paper aims to propose a design method for mechanical waveguide filters based on transmission line impedance matching theory. The research focuses on establishing precise mechanical-circuit equivalent models, clarifying the physical mechanism of impedance matching. Introducing advanced signal processing technology of fractional Fourier transform to solve the analysis problems of non-stationary vibration signals and evaluating the performance of the filters in key indicators such as insertion loss and return loss through complete simulations. This research expects to provide a new technical path for the development of high-performance mechanical filters and promote the innovation and development of vibration control technology.
2. Transmission line impedance matching theory
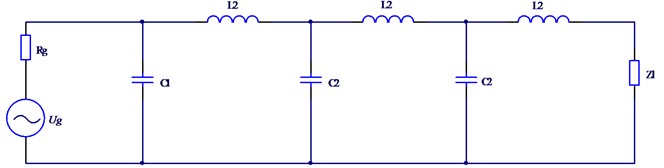
The parameters of each circuit are evenly distributed along the transmission line, so the voltage and current above the transmission line are both functions of time and distance . Let the structure of the two-conductor transmission line be as shown in Fig. 1(a), with one end being the power supply end, serving as the starting point for calculating the initial distance. The voltage source is , and its internal resistance is . The load is . Let the length of the transmission line be , and the coordinate axis of the transmission line runs along the -axis direction.
Generally, the transmission line is assumed to be a high-frequency signal, so the transmission line has distributed inductance, resistance, capacitance and other parameters. Along any infinitesimal segment on the conductor, assuming that is small enough, the distribution of circuit parameters on this micro segment can be ignored. For circuits with distributed parameters, there will be a unit length of resistance , a unit length of inductance , a line-to-line distributed conductance and a unit length of capacitance on any infinitesimal line element on the line [10]. The transmission model of a micro segment of the transmission line is shown in Fig. 1(b), so a uniform transmission line can be regarded as a series of the same micro segments that are mutually correlated and formed.
Fig. 1The equivalent circuit of the line element Δz on the transmission line
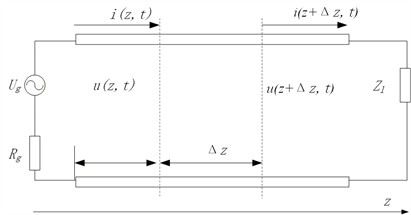
a) The reference direction of the online voltage and current
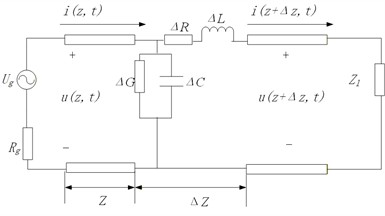
b) The transmission model of a single micro-transmission line
Applying Kirchhoff's voltage law to Fig. 1(b), we obtain:
If both ends are divided by simultaneously and approaches 0, then there is:
Similarly, applying Kirchhoff's Current Law, we obtain:
Dividing both sides of the above equation by and letting approach 0, we have:
This is the uniform transmission line equation. This also proves that the voltage and the current on the transmission line are not only functions of time but also of the relative position . Below, it is rewritten as:
On a uniformly distributed transmission line, Eq. (5) indicates that the distribution of resistance and inductance will respectively cause corresponding potential drops, resulting in the voltage between the transmission lines changing along the transmission line. Eq. (6) then explains that the continuous distribution of leakage conductance and capacitance respectively leads to the currents caused by their corresponding leakage and displacement, ultimately causing the current to change along the conductor.
3. Equivalent circuit model of mechanical waveguide
In mechanical systems, mechanical waveguides are the physical channels through which elastic waves propagate. Their dynamic behavior has a profound mathematical isomorphism with transmission lines in circuits, providing a theoretical foundation for using mature transmission line theory to model and analyze mechanical waveguides [11].
Based on the force-voltage analogy, the correspondence between mechanical quantities and circuit quantities can be established, as shown in Table 1.
Table 1Analogical relationship between mechanical system and transmission line system
Mechanical system (force-voltage analogy) | Symbol | Transmission line system | Symbol |
Force | Voltage | ||
Vibration velocity | Current | ||
Unit mass per length | Distribution inductance | ||
Unit length mechanical flexibility | Distribution capacitance | ||
Unit length mechanical damping | Distribution resistance | ||
Mechanical characteristic impedance | Characteristic impedance |
Based on this analogy, the wave equation describing the propagation of one-dimensional elastic waves in a mechanical waveguide has exactly the same form as the lossless transmission line equation:
To establish the mechanical characteristic impedance through force-voltage analogy, we start from the circuit characteristic impedance expression. In transmission line theory, the characteristic impedance is defined as the ratio of voltage to current for a forward traveling wave, and for a lossless line, it is given by:
where is the distributed inductance (H/m) and is the distributed capacitance (/). According to the force-voltage analogy established in Table 1, the mechanical counterparts of these electrical parameters are:
Distributed inductance corresponds to the mass per unit length of the mechanical waveguide: , where is the material density (kg/m3) and is the cross-sectional area (m2). This analogy stems from the fact that inductance in electrical systems stores magnetic energy, while mass stores kinetic energy through velocity.
Distributed capacitance corresponds to the mechanical compliance (flexibility) per unit length: , where is the Young’s modulus (Pa) and represents the axial stiffness per unit length. This analogy arises because capacitance in electrical systems stores electrical potential energy, while compliance stores potential energy through deformation.
By substituting these mechanical equivalents into the circuit characteristic impedance formula, we obtain the mechanical characteristic impedance:
This derivation demonstrates that the mechanical characteristic impedance represents the ratio of force to vibration velocity for a forward traveling elastic wave in the waveguide. Its physical meaning is the resistance encountered by the elastic wave as it propagates through the medium, determined solely by the material properties ( and ) and the geometric cross-section (). A higher impedance indicates greater resistance to wave propagation, analogous to higher electrical impedance resisting current flow.
Among them, and represent the force and vibration velocity on the waveguide, respectively. Therefore, a uniform mechanical waveguide can be equivalently represented as a transmission line with a characteristic impedance of , which is an inherent property of the waveguide and determines the reflection and transmission behavior of elastic waves at the interface. Introducing discontinuities in the mechanical waveguide will cause impedance mismatch, resulting in partial reflection of the wave and forming filtering characteristics. This is exactly the same as the principle of signal reflection caused by impedance discontinuity in transmission lines [12]. To achieve filtering in a specific frequency band, one can draw on the branch matching technology in circuits. In mechanical systems, this corresponds to paralleling or series-connecting a resonant unit at a specific position of the main waveguide, as shown in Fig. 2.
Fig. 2Dual-joint matching structure
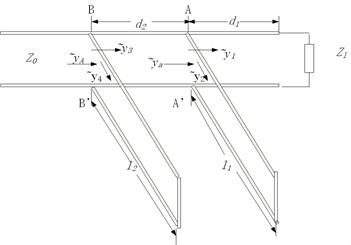
The figure illustrates a main mechanical waveguide (horizontal bar) with two resonant units (vertical stubs) connected in parallel at distances and from the input end. Each resonant unit is a short waveguide segment of length or , acting as a mechanical impedance branch. The parallel connection means that at the junction point, the force (analogous to voltage) is continuous, while the vibration velocity (analogous to current) splits between the main waveguide and the stub. The stub lengths and determine their equivalent mechanical impedances, which are tuned to achieve impedance matching at the target frequency. The positions and are chosen to create destructive interference of reflected waves, enabling band-pass filtering.
By precisely positioning the resonant unit at and adjusting its equivalent impedance (through lengths and ), it is possible to make the reflected waves generated at the target frequency cancel out the reflected waves caused by load mismatch in the main path, thereby achieving impedance matching at that frequency point and allowing energy to pass through without reflection, or conversely, being strongly suppressed [13].
To facilitate design and integration, the mechanical “joints” of these distributed parameters can be further equivalently realized by using lumped parameter mechanical components. Their effect is equivalent to a T-type filter network, and the equivalent circuit model is shown in Fig. 3.
This lumped-parameter network represents the mechanical behavior of a resonant unit (stub) connected to the main waveguide. The series arm contains an inductor and a resistor , while the shunt arm contains a capacitor . According to the force-voltage analogy (Table 1), corresponds to the equivalent mass of the stub, corresponds to its mechanical compliance, and corresponds to mechanical damping. The T-type configuration arises from the fact that at the connection point, the main waveguide sees the stub as an impedance placed in parallel in the equivalent circuit, this translates to a series impedance () followed by a shunt impedance (), forming a T-network. The values of , , and are derived from the stub’s geometric and material parameters: , , and , where is the stub length, is density, is cross-sectional area, is Young’s modulus, and is the mechanical damping per unit length. This lumped model enables straightforward circuit-based analysis and optimization of the filter’s frequency response.
The parameters , , and in this network can be directly determined by the mass, stiffness, and damping coefficient of the target mechanical system through mechanical-electrical analogy relationships.
Fig. 3Equivalent circuit of T-type filter
4. Fractional Fourier transform and its adaptability to mechanical waveguide signals
In practical engineering applications, the vibration signals propagated by mechanical waveguides often exhibit significant non-stationary characteristics. Whether it is a rotating mechanical device operating at variable speeds, a structural system subjected to impact loads, or a transmission mechanism with nonlinear contact, the generated vibration signals all show the characteristic of rapid changes in frequency components over time [14]. These signals exhibit complex distribution patterns in the time-frequency plane, some presenting linear frequency variations with linear frequency modulation features, while others show complex forms of multiple modes coupling. Traditional Fourier transform methods are inadequate in handling such signals because they assume the signals are stationary and cannot reveal the dynamic characteristics of frequency changes over time [15]. Although short-time Fourier transform and wavelet transform, among other time-frequency analysis methods, can describe non-stationary signals to some extent, they are either limited by fixed time-frequency resolutions or dependent on the selection of specific basis functions, often failing to achieve optimal results when dealing with mechanical vibration signals with specific frequency modulation patterns.
Fractional Fourier Transform (FRFT), as a generalized form of traditional Fourier transform, introduces the concept of fractional order to achieve continuous rotation in the time-frequency plane. This unique mathematical property makes it particularly suitable for processing complex vibration signals in mechanical waveguides [16]. For the common frequency linearly varying vibration components in mechanical systems, the fractional Fourier transform can concentrate the signal energy in a specific fractional domain by choosing an appropriate fractional order, thereby achieving the optimal representation of such signals. This energy concentration characteristic is of great value for extracting weak fault feature frequencies from a strong noise background or separating coupled vibration modes [17]. In actual mechanical waveguide systems, due to the nonlinear changes in system parameters, the frequencies of vibration signals often exhibit continuous gradient characteristics, which is precisely the type of signal that fractional Fourier transform is adept at handling.
The selection of the optimal fractional order is critical for maximizing the energy concentration in the FRFT domain. For a given signal , its FRFT is computed for a range of fractional orders . The energy concentration can be quantified by the Renyi entropy or simply by the peak amplitude of . A common quantitative criterion is to maximize the kurtosis or the squared magnitude maximum of the transform:
or equivalently, to minimize the entropy-based measure. In practice, a one-dimensional search over is performed with a fine step (chose 0.01) to locate the order that yields the sharpest peak in the fractional domain. This optimal order corresponds to the rotation angle that best matches the chirp rate of the signal components. For linear frequency modulated (LFM) signals, the optimal order is directly related to the chirp rate by .
In this study, the output vibration signal of the mechanical waveguide filter under a chirp excitation is analyzed using FRFT. The energy concentration degree is defined as the ratio of the maximum peak power to the total energy in the fractional domain:
By sweeping the fractional order from 0 to 2 with a step of 0.01, the curve of is obtained, as partially listed in Table 4 for selected frequencies. The optimal order that maximizes the energy concentration for the passband signal is found to be 0.85.
5. The impedance matching design method for mechanical waveguide filters
5.1. Work data preparation
Based on the theory of transmission lines, this paper systematically elaborates the specific design method of mechanical waveguide filters based on impedance matching. The core of this method lies in converting the traditional filter performance indicators through mechanical-electrical analogy into the design of the distribution of the characteristic impedance of the mechanical waveguide structure, and using the precise signal analysis means provided by FRFT to guide and optimize this design process. The performance of the mechanical waveguide filter is mainly measured by the key parameters as shown in Table 2.
Table 2Key performance parameters of mechanical waveguide filters
Parameters | Symbol | Definitions and descriptions |
Center frequency | The geometric mean frequency of the center of the passband or stopband response of the filter | |
Bandwidth | The width of the frequency range within the passband or stopband of a filter is usually calculated based on the –3 dB point | |
In-band insertion loss | The power attenuation value of the signal after passing through the filter at the center frequency of the passband | |
Out-of-band suppression | At the specified stopband frequency, the filter’s attenuation capability for the signal | |
Characteristic impedance | The inherent impedance of the mechanical waveguide, |
Based on the above parameters, the overall design process of impedance matching for the mechanical waveguide filter is shown in Fig. 4. It is an iterative optimization process that integrates theoretical calculation, simulation analysis and signal processing.
5.2. Structural design of mechanical waveguide filters based on impedance matching
Based on the transmission line theory and the mechanical-electrical analogy, the core of the structural design for mechanical waveguide filters lies in strategically introducing impedance discontinuities in the main waveguide to construct specific reflection and transmission characteristics, thereby achieving the desired filtering function in the frequency domain. The basic principle is to convert the amplitude-frequency response indicators of the target filter into design requirements for the spatial distribution of the mechanical waveguide characteristic impedance . In a uniform waveguide, elastic waves can propagate without reflection, and when there are structural changes along the waveguide path, impedance discontinuities will occur, causing mechanical waves to reflect and transmit at the interface, and their behavior is determined by the impedance ratio on both sides of the interface, which is exactly the same as the principle in circuits [18]. The main discussion here is about the classical filters, which can be generally classified into four types in terms of function: low-pass, high-pass, band-pass, and band-stop filters, as shown in Fig. 5.
Fig. 4Mechanical waveguide filter impedance matching design flowchart
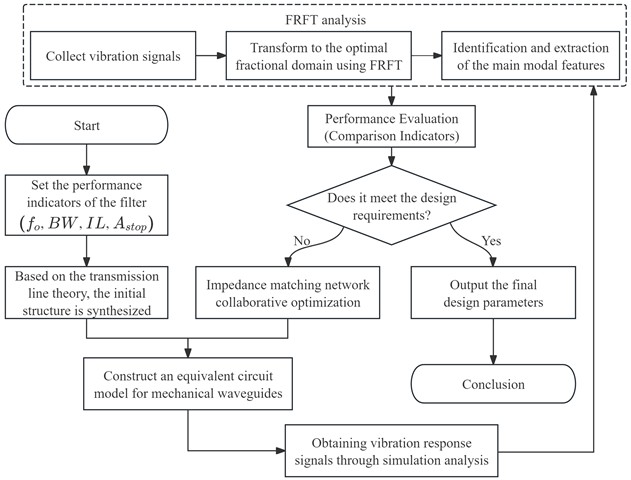
Fig. 5Four types of classical filters
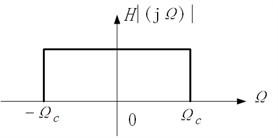
a) Low-pass
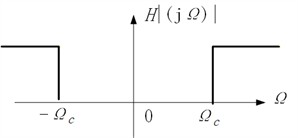
b) High-pass
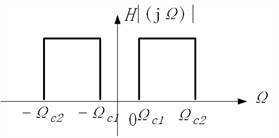
c) Band-pass
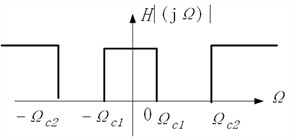
d) Band-stop
To achieve a specific filtering response, such as the band-pass characteristic shown in Fig. 5(c), this design draws on the branch-matching technology in circuits. At specific positions of the main waveguide, one or more mechanical resonator units (branches) are connected in parallel. These branches can be regarded as short waveguides, and their equivalent impedance is determined by their linear density and flexibility . By precisely designing the position d of the parallel branches and their equivalent impedance, the reflected wave at the target frequency can be controlled. This reflected wave can be equal in amplitude and opposite in phase to the reflected wave generated by the load mismatch in the main path, thereby canceling each other out [19]. The result is impedance matching at the target passband frequency, allowing energy to pass through without reflection while at the stopband frequency, strong impedance mismatch is achieved to effectively suppress the signal.
The performance indicators of the filter are converted into requirements for the target impedance frequency response of the waveguide system. Then, the parallel branches or series resonators and other basic structures are selected according to the target response, and a lumped parameter equivalent model is established using mechanical-electrical analogy. Next, using the transmission line impedance matching theory and circuit network synthesis methods, the numerical values of each lumped parameter are calculated and the physical dimensions of the mechanical structure are deduced. Finally, the initial design parameters of the structure are substituted into the simulation model for verification and iterative optimization until the filtering performance meets all design indicators.
6. Simulation and experimental verification
6.1. Simulation model and parameter settings
To verify the correctness and effectiveness of the mechanical waveguide filter design method based on impedance matching theory, this study established a corresponding simulation model. The core of this model is to solve the governing equations for the propagation of elastic waves in the mechanical waveguide, which are the wave equation system that is isomorphic to the lossless transmission line equation, as shown in Eq. (8) and (9).
Table 3Simulation model parameter settings
Category | Parameter name | Symbol | Parameter value | Note |
Main waveguide parameters | Material density | 2700kg/m³ | Aluminum alloy | |
Elastic modulus | 70GPa | – | ||
Length | 1.0m | – | ||
Cross-sectional area | 0.0001 m2 (1 cm2) | Square cross-section | ||
Characteristic impedance | ≈ 8325 N·s/m | |||
Bearing parameters | The number of joints | – | 2 | Parallel structure |
Location 1 | 0.25 m | From the input end | ||
Location 2 | 0.65 m | From the input end | ||
Length of the joint section | 0.08 m, 0.12 m | Adjustable optimization variables | ||
Simulation settings | Frequency scanning range | 1-5000 Hz | – | |
Target center frequency | 2500 Hz | Design objective | ||
Target bandwidth | 1000 Hz | Design objective | ||
Solver type | – | Frequency domain | Frequency response analysis |
The simulation is carried out by solving the harmonic forms of the above equations in the frequency domain, calculating the transfer function (the parameter, corresponding to the insertion loss ) and the reflection function (the parameter, corresponding to the return loss ) of the filter structure, thereby obtaining its frequency response characteristics. For complex structures containing parallel branches, the overall response is obtained by cascading the transmission matrix of the main waveguide and the branch with the main waveguide. At the same time, to evaluate the filter’s processing ability for non-stationary signals, a transient analysis module is included in the simulation [20]. This module solves the above time-domain equations for the given input signal and uses the output signal for subsequent FRFT analysis to observe the filtering effect of the signal in the optimal fractional domain.
The key parameters involved in the simulation, including the material properties and geometric dimensions of the main waveguide and the branch, as well as the simulation conditions, are shown in Table 3.
Aluminum alloy (Al6061) is selected as the waveguide material due to its excellent mechanical properties, including high specific stiffness and low internal damping, which are desirable for efficient elastic wave propagation with minimal attenuation. Its density 2700 kg/m3 and Young’s modulus 70 GPa are standard values for Al6061. The damping ratio 0.001 is assumed based on typical values for metallic structures under small-amplitude vibrations. The mechanical damping coefficient is derived from the damping ratio as: , where is the wave speed. Substituting the values gives 0.166 N·s/m2.
6.2. Parameter optimization and sensitivity analysis
The lengths of the dual-joint resonant units, and , are critical design parameters that determine the filter's frequency response. To obtain optimal values that achieve the desired band-pass characteristics centered at 2500 Hz, a systematic optimization procedure is carried out.
The goal is to minimize the insertion loss at the center frequency while maximizing the return loss , and simultaneously ensure a flat passband with a bandwidth of approximately 1000 Hz. A single-objective cost function combining these requirements is defined as:
where 2500 Hz, 1000 Hz, –1 dB (representing a flat passband), and 0.5, 0.3, 0.2 are weighting factors chosen empirically to emphasize low insertion loss.
A genetic algorithm (GA) is employed to search for the optimal and within the bounds 0.01 m 0.2 m. The GA parameters are set as: population size = 50, crossover probability = 0.8, mutation probability = 0.1, and maximum generations = 100. The simulation model described in Section 3.1 is used to evaluate the cost function for each candidate solution. The optimization converges after approximately 60 generations, yielding the optimal values 0.08 m and 0.12 m.
To assess the robustness of the design, a sensitivity analysis is performed by varying and individually by ±10 % around their optimal values and observing the changes in key performance metrics: center frequency deviation , insertion loss , and return loss . The results are summarized in Table 4.
The analysis shows that ±10 % variations in the joint lengths cause a center frequency shift of less than 50 Hz (2% of ), and the insertion loss remains below 1.1 dB while return loss stays above 16 dB. This indicates that the design is reasonably robust to manufacturing tolerances and parameter uncertainties.
Table 4Sensitivity of filter performance to variations in joint lengths
Variation | (m) | (m) | (Hz) | @(dB) | @(dB) |
Nominal | 0.080 | 0.120 | 0 | 0.8 | 19.1 |
+10 % | 0.088 | 0.120 | +35 | 0.9 | 17.8 |
-10 % | 0.072 | 0.120 | –42 | 1.1 | 16.5 |
+10 % | 0.080 | 0.132 | +28 | 0.9 | 18.2 |
–10 % | 0.080 | 0.108 | -38 | 1.0 | 17.1 |
6.3. Performance simulation results and analysis
Based on the establishment of the simulation model, a systematic performance simulation was conducted for the dual-joint mechanical waveguide filter designed in this study, and the complete frequency response characteristics of the filter were obtained.
The dynamic behavior of the mechanical waveguide system is described by the following coupled partial differential equations:
Among them, and represent mechanical damping and leakage conductance respectively. For the case of no loss, it is simplified to Eqs. (7) and (8).
The calculation of characteristic impedance adopts the complete expression:
Among them, , . Under the assumption of no loss, it simplifies to:
Substitute specific parameters:
For the uniform mechanical waveguide section, its transmission matrix is expressed as:
Among them, the propagation constant is , where is the attenuation constant, is the phase constant, and the wave velocity .
The admittance matrix of the parallel branch is:
The relationship between the length of the joint and the equivalent parameters:
where, is an odd number, and .
The overall transmission matrix of the system is obtained by cascading:
The scattering parameters are calculated according to the following relationship:
The input impedance:
For the analysis of non-stationary signals, the fractional Fourier transform is employed:
Here, represent the rotation angle, and is the fractional order.
Table 5Simulation results of filter performance
Frequency (Hz) | (dB) | (dB) | Group delay (ms) | Fractional-order energy concentration degree |
1000 | –12.5 | –3.2 | 0.28 | 0.23 |
1500 | –5.1 | –7.8 | 0.45 | 0.41 |
2000 | –1.8 | –12.3 | 0.63 | 0.72 |
2400 | –1.2 | –15.5 | 0.78 | 0.89 |
2500 | –0.8 | –19.1 | 0.82 | 0.95 |
2600 | –1.1 | –16.8 | 0.79 | 0.91 |
3000 | –2.3 | –11.6 | 0.65 | 0.68 |
3500 | –18.3 | –4.9 | 0.31 | 0.35 |
4000 | –24.7 | –2.8 | 0.18 | 0.21 |
4500 | –31.5 | –2.2 | 0.11 | 0.14 |
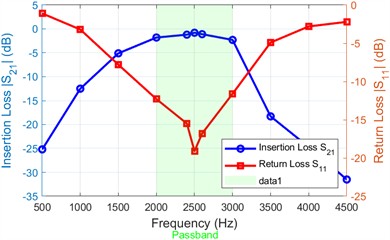
Based on the aforementioned theoretical model and parameter calculations, a systematic performance simulation was conducted for the dual-joint mechanical waveguide filter designed in this study, and the detailed frequency response characteristic data as shown in Table 5 were obtained. Through in-depth analysis of these data, the performance of the filter can be comprehensively evaluated, and the effectiveness of the design method proposed in this paper based on the transmission line impedance matching theory can be verified. The simulation results were visualized using MATLAB, as shown in Fig. 6.
Fig. 6(a) presents the frequency response characteristics of the filter, clearly showing the band-pass filtering characteristic centered at 2500 Hz. The insertion loss curve (blue) remains within –2 dB within the passband (2000-3000 Hz), reaching a minimum of –0.8 dB at the center frequency, indicating an extremely high signal transmission efficiency. The return loss curve (red) is significantly better than –12 dB within the passband, reaching a peak of –19.1 dB at 2500 Hz, verifying the effectiveness of the impedance matching network. The sharp attenuation characteristics outside the passband prove the excellent frequency selectivity of the filter.
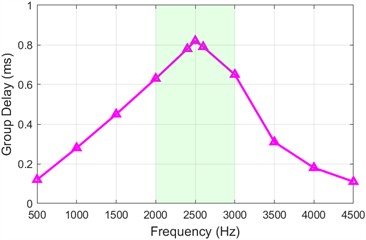
Fig. 6(b) shows the group delay characteristics, indicating that the group delay is relatively flat within the passband, maintaining a range of 0.6-0.8 ms. This suggests that the phase distortion of the signal during transmission within the passband is relatively small, which is beneficial for maintaining the time-domain integrity of the signal. The fluctuations in group delay in the transition band area are consistent with the sharp changes in amplitude-frequency characteristics, which is a typical feature of high-order filters.
Fig. 6(c) presents the FRFT energy concentration at the optimal fractional order 0.85. Within the passband, the energy concentration is significantly higher than 0.7, reaching a peak of 0.95 at the center frequency. This proves that FRFT can effectively distinguish the components of passband and stopband signals. This characteristic is of great significance for processing common non-stationary vibration signals in mechanical systems.
Fig. 6(d) shows the 3D response surface, which comprehensively demonstrates the filter's performance from multiple dimensions, clearly displaying the relationship between frequency, energy concentration, and insertion loss. The depression of the surface at the center frequency and high energy concentration area indicates that the best signal transmission performance is achieved in this area.
Fig. 6Simulation results of filter performance
a) Frequency response
b) Group delay characteristic
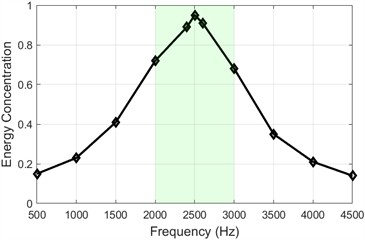
c) FRFT energy concentration (0.85)
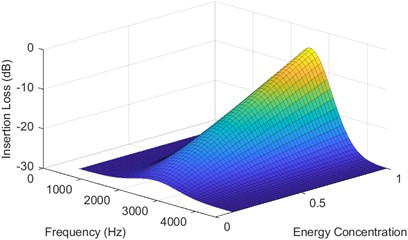
d) 3D response surface
The comprehensive performance evaluation shows that the mechanical waveguide filter designed in this paper achieves a good balance among the main performance indicators. The coexistence of low insertion loss and high return loss within the passband proves the success of the impedance matching design. These characteristics make this filter particularly suitable for mechanical vibration signal processing and quality control fields.
7. Conclusions
This paper has presented a systematic design method for mechanical waveguide filters based on transmission line impedance matching theory, validated through comprehensive simulations. A rigorous force-voltage analogy was established between mechanical and electrical systems, enabling the direct application of mature transmission line theory to mechanical waveguide filter design. The derived mechanical characteristic impedance accurately captures the wave propagation behavior and forms the foundation for impedance matching design. The dual-joint matching filter designed using this methodology achieved excellent performance at the target center frequency of 2500 Hz, with an in-band insertion loss as low as 0.8 dB and a return loss of 19.1 dB, indicating successful impedance matching and minimal signal reflection. The filter exhibited a –3 dB bandwidth of approximately 1000 Hz (2000-3000 Hz), with sharp roll-off outside the passband, achieving –18.3 dB at 3500 Hz and –31.5 dB at 4500 Hz, which demonstrates effective stopband suppression and frequency selectivity. The group delay within the passband remained flat within 0.6-0.8 ms, confirming low phase distortion and good signal integrity, a characteristic crucial for applications requiring precise temporal waveform preservation. Furthermore, the FRFT was successfully integrated into the design framework to address non-stationary vibration signals. By optimizing the fractional order to 0.85, the energy concentration in the fractional domain reached 0.95 at the center frequency, enabling effective separation of passband and stopband components even under time-varying excitations, thereby demonstrating the potential of FRFT for mechanical fault diagnosis and condition monitoring.
Despite these promising results, the current design has certain limitations that should be acknowledged. First, the bandwidth adjustment flexibility is constrained by the fixed positions and lengths of the resonant stubs; achieving broader or more complex passband shapes would require a larger number of stubs or more sophisticated optimization, which increases design complexity. Second, the high-frequency performance above 5000 Hz has not been thoroughly investigated; at higher frequencies, parasitic effects and material damping may become significant, potentially degrading filter performance. Third, the current study relies solely on numerical simulations; experimental validation under real-world conditions is necessary to confirm the practical applicability of the proposed method. Future research directions include exploring multi-stub configurations and topology optimization to enhance bandwidth tunability and achieve custom frequency responses, extending the design to higher frequency ranges by incorporating advanced materials with low loss and high stiffness, fabricating physical prototypes using additive manufacturing or precision machining and conducting experimental measurements to validate simulation predictions, integrating the filter with active control elements for adaptive vibration suppression, and applying the FRFT-based analysis to real machinery vibration data to evaluate its effectiveness in fault diagnosis. In summary, this work provides a novel and efficient design pathway for mechanical waveguide filters, combining circuit-inspired impedance matching with advanced signal processing. The simulation results substantiate the viability of the approach, and the identified limitations pave the way for future improvements and experimental verification.
References
-
N. Li et al., “Scalable coaxial extrusion of liquid crystal elastomer optical fiber enabling intrinsic photomechanical waveguiding‐actuation synergy,” Advanced Optical Materials, Vol. 13, No. 25, Jul. 2025, https://doi.org/10.1002/adom.202500993
-
O. Nefedov, A. Dovnarovich, V. Kostikov, B. Levonovich, and I. Avetissov, “Axial vibration control technique for crystal growth from the melt: analysis of vibrational flows’ behavior,” Crystals, Vol. 14, No. 2, p. 126, Jan. 2024, https://doi.org/10.3390/cryst14020126
-
M. Meller and A. Lasota, “Active control of highly autocorrelated machinery noise in multivariate nonminimum phase systems,” Circuits, Systems, and Signal Processing, Vol. 42, No. 3, pp. 1501–1521, Sep. 2022, https://doi.org/10.1007/s00034-022-02167-4
-
K. Tahriri, A. Bahrami, F. Motaei, and H. Hu, “Acoustic analog-to-digital converter using coupled waveguides in phononic crystals,” Mechanics of Advanced Materials and Structures, Vol. 32, No. 7, pp. 1480–1487, Apr. 2025, https://doi.org/10.1080/15376494.2024.2364298
-
S. V. Valappil and A. M. Aragón, “Analytical modeling of damped locally-resonant metamaterials,” Wave Motion, Vol. 136, p. 103527, Jun. 2025, https://doi.org/10.1016/j.wavemoti.2025.103527
-
S. Shukla, S. Mukherjee, and A. A. Khan, “Impedance mismatch approach to design rf power amplifier with harmonic suppression,” Microwave and Optical Technology Letters, Vol. 67, No. 6, p. 70269, Jun. 2025, https://doi.org/10.1002/mop.70269
-
J. Redondo, L. Godinho, K. Staliunas, and J. Vicente Sánchez-Pérez, “An equivalent lattice-modified model of interfering Bragg bandgaps and Locally Resonant Stop Bands for phononic crystal made from Locally Resonant elements,” Applied Acoustics, Vol. 211, p. 109555, Aug. 2023, https://doi.org/10.1016/j.apacoust.2023.109555
-
M. Elbathaoui, N. Jebbor, S. Das, W. Ali, A. D. Algarni, and E.-M. Boufounas, “A creative hybridization of metamaterial CSRR and multiple-mode resonators for designing a compact wideband bandpass filter for 5G/IOT/WLAN/Wi-Fi 6E applications,” Physica Scripta, Vol. 99, No. 12, p. 125542, Dec. 2024, https://doi.org/10.1088/1402-4896/ad8fe2
-
N.T. Kim, “Design of distributed impedance‐matching networks for ultra‐wideband low‐noise amplifiers,” Microwave and Optical Technology Letters, Vol. 66, No. 8, p. 34292, Aug. 2024, https://doi.org/10.1002/mop.34292
-
J. P. Robles Balestero, J. S. Leon Colqui, and S. Kurokawa, “Using the exact equivalent π-circuit model for representing three-phase transmission lines directly in the time domain,” Energies, Vol. 16, No. 20, p. 7192, Oct. 2023, https://doi.org/10.3390/en16207192
-
S. Aremanda, Y. Li, G. Onuh, and O. Manor, “Measurement of dynamic electrokinetic effects at the glass/electrolyte interface using a mega-Hertz-level mechanical wave,” Frontiers in Acoustics, Vol. 3, Jun. 2025, https://doi.org/10.3389/facou.2025.1568083
-
V. Barzdenas and A. Vasjanov, “Analysis of SMT component land pad discontinuity effect on the overall transmission line impedance in high-speed applications,” Journal of Electrical Engineering, Vol. 74, No. 2, pp. 122–126, Apr. 2023, https://doi.org/10.2478/jee-2023-0016
-
V. V. Neelov and S. E. Shaldaev, “Influence of the estimation accuracy of the frequency characteristics of radar targets on the results of the geometric shape identification of local reflectors,” Measurement Techniques, Vol. 63, No. 7, pp. 573–579, Nov. 2020, https://doi.org/10.1007/s11018-020-01825-w
-
F. Sauer, A. Mukherjee, and V. Schulze, “Insights into the metal cutting contact zone through automation and multivariate regression modelling under the framework of gear skiving,” Simulation Modelling Practice and Theory, Vol. 142, p. 103107, Jul. 2025, https://doi.org/10.1016/j.simpat.2025.103107
-
M. H. Ahmad et al., “Monitoring of wheat flour aging process using traditional methods and Fourier transform infrared spectroscopy coupled with chemometrics,” International Journal of Food Properties, Vol. 25, No. 1, pp. 1513–1523, Dec. 2022, https://doi.org/10.1080/10942912.2022.2088789
-
I. Waheed and M. U. Rehman, “On the fractional Fourier transforms with respect to functions and its applications,” Computational and Applied Mathematics, Vol. 42, No. 5, Jun. 2023, https://doi.org/10.1007/s40314-023-02354-2
-
V. Natraj, V. Mohan, P. Pazhamalai, and S.-J. Kim, “Ferroelectric and energy harvesting properties of lithium niobate/PDMS composite films for knee squat detection and self-powered humidity sensor,” Composite Structures, Vol. 370, p. 119441, Oct. 2025, https://doi.org/10.1016/j.compstruct.2025.119441
-
H. Zhu et al., “Inversion of shallow seabed structure and geoacoustic parameters with waveguide characteristic impedance based on Bayesian approach,” Frontiers in Marine Science, Vol. 10, Jan. 2023, https://doi.org/10.3389/fmars.2023.1104570
-
M. H. Nemati, M. H. Shaabani, N. Dehghan, and G. B. Gharehpetian, “High frequency resonance mitigation of microgrid-connected PV units using novel adaptive control based on virtual impedance and machine learning algorithm,” Results in Engineering, Vol. 27, p. 106501, Sep. 2025, https://doi.org/10.1016/j.rineng.2025.106501
-
D. J. Davis and J. H. Challis, “Automatic segment filtering procedure for processing non-stationary signals,” Journal of Biomechanics, Vol. 101, p. 109619, Mar. 2020, https://doi.org/10.1016/j.jbiomech.2020.109619
About this article

Supported by the Youth Research Project for Basic Studies of Higher Education Institutions in Heilongjiang Province (YQJH2025221): High-frequency Oscillation Suppression and Matching Filtering Method for Power Electronic Systems Based on Fractional Fourier Transform.
The datasets generated during and/or analyzed during the current study are available from the corresponding author on reasonable request.
Xiaolin Gao: conceptualization, methodology, validation, writing-original draft, writing-review and editing, supervision, project administration, resources. Xi Chen: formal analysis, investigation, software, validation, writing-review and editing, visualization, data curation.
The authors declare that they have no conflict of interest.
