Abstract
This paper presents an experimental approach for evaluating the dynamic characteristics of strain gauge pressure transducers under pulsed ultrasonic (vibration-like) excitation using spectral transfer-function identification without prior knowledge of the emitter frequency response. Two silicon-sapphire strain gauge pressure transducers with different sensing-element designs (types A and B, nominal range 0-100 kPa) were tested. The estimated normalized frequency responses show distinct resonance patterns: type A exhibits pronounced maxima at approximately 6.4, 23.5, and 68.6 kHz with peak normalized magnitude 0.99, 0.56, and 0.88, respectively, whereas type B shows a smoother response with the dominant maximum near 44.4 kHz ( 0.44). The peak response of type A is about 2.3× higher than that of type B, indicating higher susceptibility to vibration-induced dynamic errors in the corresponding bands. The proposed technique supports comparative assessment of vibration resistance and dynamic measurement errors under controlled laboratory broadband excitation.
1. Introduction
The dynamic properties of pressure transducers are important because they determine the sensor response under rapidly varying input conditions and directly affect the dynamic component of measurement error [1], [2]. In practical operation, pressure sensors are often exposed not only to pressure pulsations but also to vibration disturbances caused by machinery, acoustic excitation, and structural resonances. Under such conditions, static calibration alone is insufficient for assessing the metrological behavior of the transducer.
Experimental identification of dynamic characteristics is complicated by the need to generate a reproducible broadband excitation in the frequency range of interest. In conventional approaches, mechanical shocks are often used to excite the sensing element, but this introduces uncertainty in the shape, duration, and repeatability of the input action and makes the interpretation of sensor response more difficult [3], [4]. For this reason, alternative excitation methods that provide more stable laboratory conditions are of practical interest.
In this study, pulsed ultrasonic excitation is used as a broadband vibration-like loading method for strain gauge pressure transducers. Such excitation makes it possible to investigate the frequency response of the sensing element under controlled laboratory conditions. Pressure-measurement channels are also important for monitoring the operating conditions of transport-related technical systems, where the reliability of primary sensing elements affects the overall quality of diagnostic information [18]. Dynamic calibration and frequency-response identification of pressure transducers have been widely addressed in metrology and instrumentation literature, where particular attention is paid to vibration-induced response distortions and uncertainty reporting [11-15]. In addition, silicon-on-sapphire sensor structures remain relevant for pressure-measurement applications due to their mechanical and thermal stability [7], [10], [19].
The novelty of the study is threefold. First, a spectral identification scheme with two emitters and a cascade configuration is used to estimate transducer frequency response without prior calibration of emitter characteristics. Second, the proposed laboratory setup enables broadband pulsed excitation suitable for comparative dynamic testing. Third, the obtained frequency-response signatures demonstrate that the dynamic behavior of the transducer depends on the design of the sensing element and internal structure.
The aim of this work is to experimentally evaluate the dynamic characteristics of strain gauge pressure transducers by analyzing their frequency properties under pulsed ultrasonic excitation.
2. Materials and methods
In the proposed analysis, the strain gauge pressure transducer is considered as a linear stationary system whose response can be described in the frequency domain by the transfer function . The relationship between the input and output spectra is given by Eqs. (1) and (2), which form the basis for practical frequency-response identification using spectral density estimates [5]:
where , , and correspond to the Fourier image of the input signal, output signal, and impulse response of the system:
where and are the spectral densities of the input and output signals, respectively.
To avoid the need for prior calibration of the excitation source, two piezoceramic emitters with different and initially unknown transfer functions were used. Sequential measurements with both emitters, together with the cascade configuration described by Eqs. (3-5), make it possible to estimate the transducer frequency response according to Eq. (6). The resulting estimate is obtained by averaging over repeated experimental realizations in order to improve stability and reproducibility:
where indexes 1 and 2 correspond to different types of radiators:
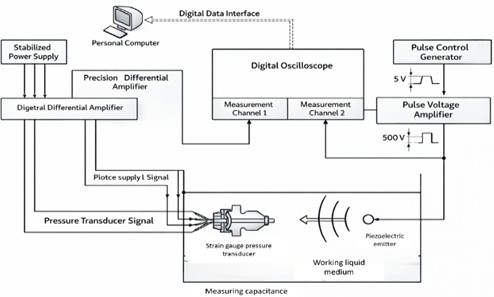
The experimental setup is shown in Fig. 1. Two silicon-on-sapphire strain gauge pressure transducers with different sensing-element designs were investigated. Type A is a two-membrane transducer with a narrow pressure-transmission channel, whereas type B includes a separation membrane affecting stress redistribution and dynamic response [6-8], [10], [19]. The nominal pressure range for both transducers was 0-100 kPa.
Signals were recorded under pulsed ultrasonic excitation and processed using spectral analysis. The sampling frequency was 500 kHz, the record length was 2 s, and each time sequence was divided into statistically independent pulse-related segments. The averaged spectral estimates obtained from these segments were then used to calculate the normalized frequency response according to Eq. (7):
For metrological completeness, the present study reports a normalized frequency response intended for comparative evaluation of transducer designs. In a fully traceable calibration workflow, the static sensitivity and uncertainty budget should be reported together with the identified transfer function in accordance with GUM-based practice [14-17].
Fig. 1Block diagram of an experimental stand for studying the dynamic characteristics of a pressure sensor
3. Results and discussion
Based on the proposed identification procedure, normalized frequency-response estimates were obtained for the two investigated strain gauge pressure transducers. The results show clear design-dependent differences in spectral behavior. The type A transducer exhibits pronounced resonant maxima at approximately 6.4, 23.5, and 68.6 kHz, with corresponding normalized magnitudes of about 0.99, 0.56, and 0.88. In contrast, the type B transducer demonstrates a smoother spectral response with the dominant maximum near 44.4 kHz and a peak normalized magnitude of about 0.44.
These results indicate that the dynamic behavior of the transducer is strongly influenced by the sensing-element design and internal mechanical structure. The more pronounced resonant peaks of type A suggest higher susceptibility to vibration-induced dynamic errors in specific frequency bands, whereas the smoother response of type B indicates better damping of local resonant amplification. The peak response of type A is approximately 2.3 times higher than that of type B, which is important for practical sensor selection under dynamic and vibration loading conditions.
The obtained results are consistent with the general understanding that pressure-transducer design affects dynamic response and vibration sensitivity [10], [13], [19]. A broader sensor-related perspective also shows that sensitivity-oriented response indicators may be useful for comparative assessment of transducer behavior, even when different physical principles are involved [9]. From the metrological point of view, the identified frequency bands should be taken into account when selecting transducers for operation in systems exposed to broadband vibration or pulsating pressure. Thus, the proposed method can be used as a practical comparative tool for evaluating vibration resistance and possible dynamic error growth in pressure-measurement channels.
From the metrological point of view, the identified frequency bands should be taken into account when selecting transducers for operation in systems exposed to broadband vibration or pulsating pressure. Thus, the proposed method can be used as a practical comparative tool for evaluating vibration resistance and possible dynamic error growth in pressure-measurement channels. The corresponding normalized frequency-response curves of the investigated transducers are shown in Fig. 2.
Fig. 2Estimated normalized frequency responses of type A and type B strain gauge pressure transducers
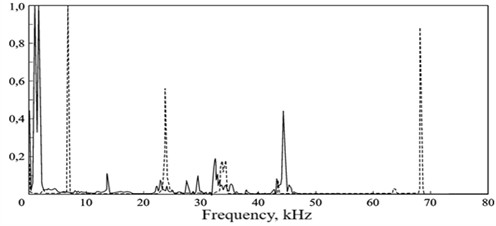
Table 1Main resonance features of the investigated strain gauge pressure transducers
Transducer type | Main resonant frequencies, kHz | Peak normalized magnitude | Interpretation |
Type A | 6.4; 23.5; 68.6 | 0.99; 0.56; 0.88 | Pronounced resonant behavior; higher vibration susceptibility |
Type B | 44.4 | 0.44 | Smoother response; lower peak vibration sensitivity |
4. Conclusions
This study proposed an experimental method for identifying the dynamic characteristics of strain gauge pressure transducers under pulsed ultrasonic excitation without prior calibration of emitter frequency response. The obtained normalized frequency-response estimates showed that the type A transducer has pronounced resonant maxima at approximately 6.4, 23.5, and 68.6 kHz, whereas the type B transducer exhibits a smoother response with the dominant maximum near 44.4 kHz.
The peak response of type A was about 2.3 times higher than that of type B, indicating greater susceptibility to vibration-induced dynamic errors in the corresponding frequency bands. These results confirm that the sensing-element design significantly affects dynamic behavior and should be considered when selecting pressure transducers for operation under rapidly varying pressure and vibration loading conditions.
For metrological completeness, future traceable implementation of the method should include reporting of static sensitivity and an uncertainty budget for the identified transfer function in accordance with GUM-based practice.
References
-
T. V. Bykova and G. A. Cherepashchuk, “Improving the accuracy of strain gauge transducers in dynamic modes using the wavelet transform apparatus,” Ukrainian Metrological Journal, No. 4, 2009.
-
V. M. Stuchebnikov, “Design and manufacture of sensors, devices and systems,” Sensors and Systems, No. 9, pp. 15–19, 2004.
-
A. V. Pirogov and V. M. Stuchebnikov, “Experimental determination of natural frequencies of two-membrane pressure strain transducers,” Sensors and Systems, No. 4, 2006.
-
M. A. Barulina, V. E. Dzhashitov, and V. M. Pankratov, “Mathematical modeling of a pressure sensor in conditions of mechanical and thermal shocks,” Sensors and Systems, No. 8, p. 37, 2009.
-
V. N. Bulatov, Spectral-Pulse Methods of Reproduction and Transformation of Phase Spectra. Orenburg, Russia: IPK OSU, 2001.
-
A. I. Kozlov, A. V. Pirogov, and V. M. Stuchebnikov, “Modeling of pressure strain transducers based on CNS structures: Single-membrane converters,” Sensors and Systems, No. 1, pp. 6–11, 2008.
-
E. R. Dobrovinskaya, L. A. Lytvynov, and V. Pishchik, Sapphire: Material, Manufacturing, Applications. Springer, 2009.
-
S. S. Gavryushin and P. A. Skvortsov, “Evaluation of output signal nonlinearity for semiconductor strain gauge,” Solid State Phenomena, Vol. 269, pp. 60–70, Nov. 2017.
-
K. K. Jurayeva, Z. G. Nazirova, and U. S. Mamadaliyev, “Increasing the sensitivity of magnetoelastic sensors using the energy-information method,” in The 6th International Conference on Energy, Environment, Epidemiology and Information System (ICENIS) 2021: Topic of Energy, Environment, Epidemiology, and Information System, Vol. 2683, No. 1, p. 020013, Jan. 2023, https://doi.org/10.1063/5.0105791
-
S. S. Gavryushin, P. A. Skvortsov, and A. A. Skvortsov, “Optimization of semiconductor pressure transducer with sensitive element based on silicon on sapphire structure,” Periódico Tchê Química, Vol. 15, No. 30, pp. 678–686, Aug. 2018, https://doi.org/10.52571/ptq.v15.n30.2018.682_periodico30_pgs_678_686.pdf
-
J. L. Schweppe, L. C. Eichberger, D. F. Muster, E. L. Michaels, and G. F. Paskusz, “Methods for the dynamic calibration of pressure transducers,” National Bureau of Standards, Gaithersburg, MD, Jan. 1963, https://doi.org/10.6028/nbs.mono.67
-
J. Hjelmgren, “Dynamic measurement of pressure: a literature survey,” Swedish National Testing and Research Institute, SP Report 2002:34, 2002.
-
K. Diao, Z. Yao, Z. Wang, X. Liu, C. Wang, and Z. Shang, “Investigation of vibration effect on dynamic calibration of pressure sensors based on shock tube system,” Measurement, Vol. 149, p. 107015, Jan. 2020, https://doi.org/10.1016/j.measurement.2019.107015
-
“Evaluation of measurement data-guide to the expression of uncertainty in measurement (GUM 1995 with Minor Corrections),” Joint Committee for Guides in Metrology, JCGM 100:2008, 2008.
-
J. D. Pereira, “Pressure sensors: working principles of static and dynamic calibration,” Sensors, Vol. 24, No. 2, p. 629, Jan. 2024, https://doi.org/10.3390/s24020629
-
“Methods for the calibration of vibration and shock transducers-part 1: basic concepts,” International Organization for Standardization, ISO 16063-1:1998, 1998.
-
S. Eichstädt, A. Link, and C. Elster, “Dynamic uncertainty for compensated second-order systems,” Sensors, Vol. 10, No. 8, pp. 7621–7631, Aug. 2010, https://doi.org/10.3390/s100807621
-
O. T. Aliev, M. M. Talipov, K. M. Kamilov, and O. R. Ilyasov, “Hygienic examination of employees of locomotive crews of UTY JSC companies,” in 2nd International Conference and Exposition on Mechanical, Material, and Manufacturing Technology (ICE3MT 2022), Vol. 2943, No. 1, p. 040057, Jan. 2023, https://doi.org/10.1063/5.0134056
-
Z. Guo, C. Lu, Y. Wang, D. Liu, M. Huang, and X. Li, “Design and experimental research of a temperature compensation system for silicon-on-sapphire pressure sensors,” IEEE Sensors Journal, Vol. 17, No. 3, pp. 709–715, Feb. 2017, https://doi.org/10.1109/jsen.2016.2633324
About this article

The authors have not disclosed any funding.
The datasets generated during and/or analyzed during the current study are available from the corresponding author on reasonable request.
The authors declare that they have no conflict of interest.
