Abstract
In this paper, molecular dynamics simulations are performed using LAMMPS to establish an oxygen molecular system. The Lennard-Jones (12-6) potential function is adopted to characterize intermolecular nonbonded interactions, and the influences of temperature, pressure, and molecular degrees of freedom on the sound attenuation coefficient are systematically examined. Thermodynamic parameters of oxygen obtained at room temperature are compared with experimental data to validate the force field parameters and simulation approach. The results demonstrate that the rigid model yields an isochoric heat capacity calculation error of only 1.3 % at low temperatures, remarkably lower than the 29 % error of the flexible model. At high temperatures, results from the non-rigid model gradually converge to experimental values and show higher computational efficiency than the rigid model. Under constant pressure, elevated temperature increases the viscosity and thermal conductivity of oxygen, which significantly raises the sound attenuation coefficient. This work provides a theoretical foundation for parameter optimization and accuracy enhancement in non-contact acoustic thermometry under complex thermal environments in furnace chambers.
1. Introduction
As a common gas component in the furnace chamber and whose concentration changes significantly before and after combustion, the sound attenuation coefficient of oxygen under high temperature conditions is an indispensable key parameter in many application scenarios. The accurate measurement of the acoustic attenuation coefficient of oxygen at high temperature can provide an accurate theoretical basis for the propagation behavior of sound waves in complex thermal environments, which can significantly improve the accuracy of sound source positioning and the reliability of acoustic wave temperature measurement[1], and provide data support for the optimization of oxygen-rich combustion in power station boilers and the monitoring of heat flow distribution on the heating surface. However, the complexity of the high-temperature environment and the limitations of experimental measurement make theoretical calculation and software simulation the main ways to obtain this parameter.
In recent years, the rapid development of computer performance has greatly promoted the widespread application of molecular dynamics (MD) simulation in many fields. Molecular dynamics methods have been applied to the study of thermal properties [2-4], diffusion coefficients [5-6], and gas concentrations of some fluids [7-8]. There are few studies on sound wave propagation in diatomic and polyatomic gases, and most of them only study the single physical quantity of the system, and the thermodynamic properties of gases vary considerably at different temperatures. In this study, two different degrees of freedom were used to calculate the heat capacity at different temperatures in the simulation to investigate its effects.
2. Simulation parameters
An oxygen molecule consists of two atoms connected by a bond, and the intermolecular interactions are described using the Lennard-Jones (12-6) potential function. The form of the potential function is:
where denotes the cutoff radius at which the interatomic potential energy drops to zero. To balance computational efficiency and accuracy, is set to 10 Å, with the energy parameter 0.105 kcal/mol and the distance parameter 3.297 Å, where stands for the distance between atom and atom . In previous research, oxygen molecules are commonly treated as elastic entities, and the interatomic bonding interaction is typically described by a harmonic potential function, as follows:
where, 0.118 N/m is the elastic coefficient, and 1.207 Å is the equilibrium bond length.
In this study, 1000 oxygen molecules were randomly generated in the simulation system to calculate the heat capacity and compressibility. The system's temperature and pressure were controlled using a Nose-Hoover thermostat, and the simulation was carried out under the NPT ensemble, with pressure fixed at 1 atm and temperature ranging from 300 to 1200 K. The total simulation duration was no less than 10 ns, with the first 5 ns used for system relaxation and equilibration. Configuration information was output every 100 ps, and the system's temperature and energy changes were monitored to check whether the system had reached equilibrium.
3. Analysis of results
3.1. Heat capacity calculation
Heat capacity and isothermal compressibility are derived from the partial derivatives of volume, internal energy, and enthalpy with respect to temperature and pressure. These thermodynamic derivatives can be directly obtained from the fluctuations of the system at a fixed composition. In the canonical ensembles (NVT/NPT) adopted for heat capacity and compressibility calculations, the system energy is averaged over all accessible microscopic states. For a given microscopic state S with energy ES, the mean squared deviation is defined as the energy fluctuation:
where denotes the probability that the system is in the microstate , for regular distribution:
where, the former term represents the sum of kinetic energy terms, including translational kinetic energy, rotational kinetic energy, and vibrational kinetic energy, and the latter term represents the sum of potential energy terms. According to the equipartition theorem, the kinetic energy term can be expressed in the form of Eq. (8), where is Avogadro’s constant, is the degree of freedom, and is Boltzmann’s constant.
So:
Fig. 1Heat capacity
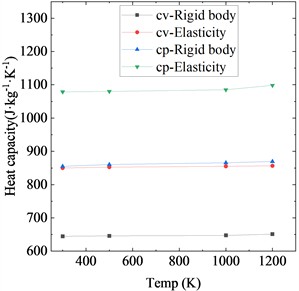
The results (Fig. 1) show that in the low-temperature region, the of the non-rigid model is 846.45 J·kg-1·K-1, which is notably higher than the experimental value of 653.125 J·kg-1·K-1, with a relative error of 29 %. In comparison, the value of the rigid model is 644.63 J·kg-1·K-1, corresponding to a relative error of only 1.3 % relative to the experimental data. This discrepancy arises because molecular vibrational degrees of freedom remain unexcited at low temperatures, and the inclusion of vibrational degrees of freedom in the flexible model leads to an overestimation of heat capacity.
In the high-temperature region (Fig. 1), the value of the non-rigid model is 848.45 J·kg-1·K-1, which gradually approaches the experimental value of 868.65 J·kg-1·K-1, with a relative error below 2 %. Meanwhile, the value of the rigid model is 645.02 J·kg-1·K-1, and its relative error relative to the experimental data rises to 24 %. This is attributed to the excitation of molecular vibrational degrees of freedom at high temperatures, which cannot be captured by the rigid model.
3.2. Isothermal compressibility
is the isothermal compression coefficient, defined as the rate of change of gas volume with pressure under isothermal conditions. According to fluctuation theory:
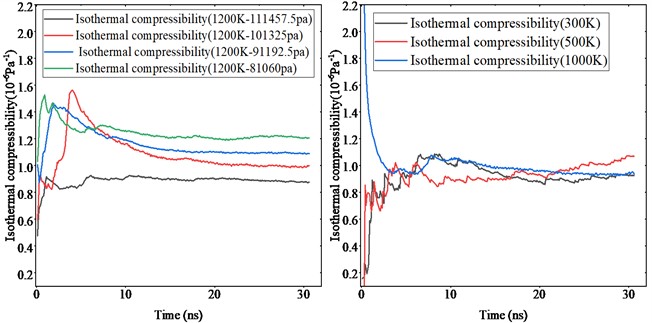
As depicted in Fig. 2, temperature exerts a negligible effect on the over 300-1200 K, where fluctuates near 1×10⁻⁶Pa−1. Specifically, is 0.911×10⁻⁶Pa-1 at 300 K and 0.932×10⁻⁶Pa-1 at 1200 K, with a relative fluctuation below 2.3 % and a relative error within 9 % relative to the experimental value of 0.9996×10⁻⁶Pa-1. At 1200 K, increasing pressure from 81060 Pa to 111457.5 Pa reduces from 1.4×10⁻⁶Pa-1 to 0.85×10⁻⁶Pa-1 (a drop of ~39 %), as elevated pressure suppresses gas compressibility. This behavior is critical for on-site calibration of furnace acoustic thermometry: pressure fluctuation-induced corrections to are required to avoid large errors in sound velocity calculation and ensure accurate temperature inversion.
Fig. 2Isothermal compressibility
3.3. Thermal conductivity calculation
Thermal conductivity is calculated using Fourier’s law:
Fig. 3Temperature distribution
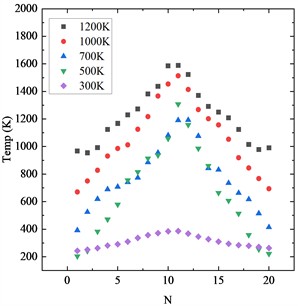
As obtained through simulation (Fig. 3), when the temperature rises while the pressure remains constant, and when the pressure varies within the range of 81060 Pa to 111457.5 Pa at a constant temperature, there is no significant difference in the temperature difference, and the thermal conductivity changes very little. This indicates that under furnace combustion conditions, the effect of temperature variations on thermal conductivity is much greater than that of pressure fluctuations. The finally calculated thermal conductivities are 0.042 W·m-1K-1 at 500 K, 0.075 W·m-1K-1 at 1000 K, and 0.089 W·m-1K-1 at 1200 K.
3.4. Viscosity calculation
In this study, the RNEMD method is used to calculate viscosity, which is computed using the following formula:
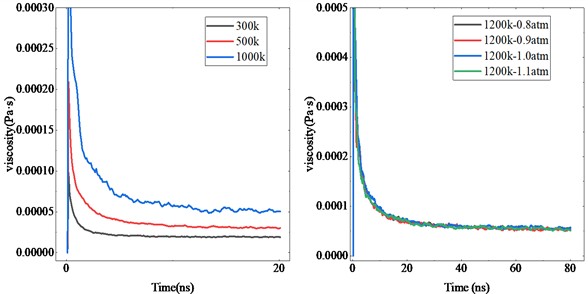
By comparing the simulated data images at different temperatures (Fig. 4), the increase in viscosity can be clearly observed. This is because as the temperature rises, gas molecules move more vigorously, making them more likely to collide with other molecules and exchange momentum, which intensifies the internal friction between fluid layers and increases viscosity. During combustion in the furnace, the pressure is at a slightly negative state below 101325 Pa. Simulation results also indicate that typical pressure fluctuations in the furnace (slightly below 101325 Pa negative pressure) have little effect on the viscosity of oxygen, with values remaining around 55×10⁻5 Pa·s with only slight fluctuations.
Fig. 4Viscosity simulation value
3.5. Sound attenuation coefficient
Since the attenuation coefficient is proportional to the square of the frequency, their ratio is constant. The calculated values are 1.25×10⁻¹¹ s2/m at 300 K, 1.89×10⁻¹¹ s2/m at 500 K, 2.0×10⁻¹¹ s2/m at 1000 K, and 2.3×10⁻¹¹ s2/m at 1200 K. respectively. These values are significantly larger than the room-temperature value, indicating that the increase in temperature has an important effect on the attenuation of sound waves. This is because sound waves are absorbed due to viscosity and heat conduction during propagation. Acoustic wave attenuation is mainly caused by viscous dissipation and heat conduction dissipation. At constant pressure, high temperatures lead to a decrease in gas density, which in turn increases the speed and wavelength of sound. The increase in viscosity and thermal conductivity further exacerbates attenuation.
4. Limitations of the study
The simulation excludes real combustion reactions and adopts classical molecular dynamics without considering high-temperature quantum effects. Ideal periodic boundary conditions and a small simulation domain may introduce slight size effects, causing deviations from macroscopic values by up to an order of magnitude. Thus, the dimensions along heat transfer and momentum exchange directions were extended to 8000 nm to ensure consistency with experimental data.
5. Conclusions
This study employs MD simulations to explore the influences of temperature 300-1200 K and pressure 81060-111457.5 Pa at 1200 K on the thermophysical properties and sound attenuation coefficient of oxygen. The main conclusions are as follows: An MD-based simulation approach is developed for predicting the sound attenuation coefficient of high-temperature oxygen, with thermal conductivity and viscosity calculated via non-equilibrium molecular dynamics (NEMD) and reverse non-equilibrium molecular dynamics (RNEMD);The effects of molecular degrees of freedom on heat capacity and sound attenuation are quantified: the rigid model achieves a 1.3 % heat capacity error at 500 K (vs. 29 % for the flexible model), while the flexible model (7) shows superior accuracy and efficiency at 1000 K when vibrational modes are excited; The temperature-dependent regulation mechanism of sound attenuation is revealed: elevated temperature under constant pressure increases oxygen viscosity and thermal conductivity, raising the sound attenuation coefficient by 84.3 % at 1200 K.
References
-
Y.-B. Li, Q.-Y. Fu, and X. Guo, “Research on the propagation of acoustic signal and attenuation change law of gas pipeline double-point leakage,” Shock and Vibration, Vol. 2023, No. 1, pp. 1–9, 2023, https://doi.org/10.1155/2023/7725366
-
R. Zhang, S. Qing, X. Zhang, Z. Luo, and Y. Liu, “Investigation of different nanoparticles properties on the thermal conductivity and viscosity of nanofluids by molecular dynamics simulation,” Nanotechnology Reviews, Vol. 12, No. 1, p. 20220562, Jun. 2023, https://doi.org/10.1515/ntrev-2022-0562
-
T. T. Trinh, T. J. H. Vlugt, and S. Kjelstrup, “Thermal conductivity of carbon dioxide from non-equilibrium molecular dynamics: A systematic study of several common force fields,” The Journal of Chemical Physics, Vol. 141, No. 13, p. 2014, Oct. 2014, https://doi.org/10.1063/1.4896965
-
M. O. Anokye and R. Yun, “A molecular dynamics simulation study on the thermal conductivity of a supercritical carbon dioxide-nitrogen mixture,” Journal of Mechanical Science and Technology, Vol. 38, No. 11, pp. 6355–6363, 2024, https://doi.org/10.1007/s12206-024-1046-4
-
J. T. Bullerjahn, S. Von Bulow, M. Heidari, J. Hénin, and G. Hummer, “Unwrapping NPT simulations to calculate diffusion coefficients,” Journal of Chemical Theory and Computation, Vol. 19, No. 11, pp. 3406–3417, 2023, https://doi.org/10.1021/acs.jctc.3c00308
-
I. N. Tsimpanogiannis, O. A. Moultos, L. F. M. Franco, M. B. M. Spera, M. Erdős, and I. G. Economou, “Self-diffusion coefficient of bulk and confined water: a critical review of classical molecular simulation studies,” Molecular Simulation, Vol. 45, No. 4-5, pp. 425–453, Mar. 2019, https://doi.org/10.1080/08927022.2018.1511903
-
W. Long, M. Wu, F. Li, J. Wang, and W. Deng, “Gas flow mechanism and pressure analysis in plates in micro scale gas film,” Industrial Lubrication and Tribology, Vol. 73, No. 1, pp. 33–37, 2021, https://doi.org/10.1108/ilt-01-2019-0009
-
A. Pachalieva and A. J. Wagner, “Molecular dynamics lattice gas equilibrium distribution function for Lennard-Jones particles,” Philosophical Transactions of the Royal Society A: Mathematical, Physical and Engineering Sciences, Vol. 379, No. 2208, p. 20200404, 2021, https://doi.org/10.1098/rsta.2020.0404
About this article

This research is supported by the National Natural Science Foundation of China (No. 12574480), and Natural Science Foundation of Hebei Province (A2025502025 and A2021502001), and the Fundamental Research Funds for the Central Universities of China (2025MS184), Scientific Research Projects of Universities in Hebei Province (ZC2023058).
The datasets generated during and/or analyzed during the current study are available from the corresponding author on reasonable request.
The authors declare that they have no conflict of interest.
