Abstract
As a type of transdermal permeability enhancement, low frequency sonophoresis (LFS) has been studied for more than twenty years. The acoustic pressure in LFS is a crucial ultrasonic parameter to improve the permeability, but it is difficult to measure in the drug donor because of its small size and narrow shape. In this paper, an acoustic-piezoelectric coupling model is established based on bubble dynamics, which can be utilized to calculate the acoustic pressure distributions in LFS using a commercial finite element software called COMSOL multiphysics. The calculated results of acoustic pressure are in accordance with the measured values, so this model has great potential for theoretical analyses in acoustic fields of LFS. Calculated and experimental results show that the maximum acoustic pressure is under the transducer’s head, and the value dropped as away from the head due to the acoustic attenuation caused by cavitation; the transducer head should be closer to the skin to obtain larger acoustic pressure on the skin. Therefore, this model can be used to simulate and analyze the characteristics of acoustic fields, as a theoretical tool for the structural design of the ultrasonic transducer applied in LFS.
1. Introduction
With rapid development of therapeutic ultrasound, a type of transdermal drug delivery system called low frequency sonophoresis (LFS) has attracted more attention in the last two decades [1, 2]. LFS (20-100 kHz) can effectively improve the transdermal permeability of different drugs, not only including hydrophobic permeants but also hydrophilic ones [3, 4]. In 1995, Samir Mitragotri, Blankschrein D. and Langer R. [5] completed a series of experiments to suggest that LFS can deliver and control three kinds of therapeutic protein namely insulin, interferon , erythropoietin through the skin. Untill 2010, Baris E. Polat, Blankschtein D., and Langer R. [4] have reviewed plenty of different drugs whose permeation through the stratum corneum has been enhanced. Recently, Mai Aldwaikat and Mohammed Alarjah [6] also found that ultrasound technology enhanced the permeation of diclofenac sodium through EpiDerm™ (a three-dimension viable skin) fivefold. As a whole, LFS is a valuable transdermal enhancing method, especially for hydrophobic permeants.
Although LFS has been proven effectively for improvement of transdermal drug delivery, its principle is still not fully understood [2]. Generally, if acoustic intensity is larger than cavitation threshold value (e.g. 1.3 W/cm2), there would be plenty of cavitation bubbles in drug liquid of which the inertial cavitation is responsible for its transdermal permeability enhancement [7]; on the contrary, acoustic pressure plays a greater role on permeation improvement. However, it is difficult to obtain the acoustic distribution in LFS by experimental measurement, because traditional equipment such as measurement hydrophone is too large to be placed into the drug donor. Consequently, this paper will present an acoustic calculation method based on bubble dynamics to simulate the acoustic pressure and its distribution in an in-vitro LFS, and then two small sheets of polyvinylidene fluoride (PVDF) piezoelectric film are used to measure the appropriate pressure in the donor and receptor.
An acoustic-piezoelectric coupling model is built up using a commercial finite element (FEM) software call COMSOL Multiphysics, with which the absorption coefficients of liquid are calculated based on bubble dynamics in terms of Cafisch equations theory proposed by Kerry W. Commander [8]. Calculated upper-skin acoustic pressure is appropriately close to the experimental values, demonstrating the efficiency of this model. According the results, the acoustic pressure is maximal under the transducer’s head, and quickly decays far away from the head; in order to obtain a larger acoustic pressure, the transducer should be put closer to the skin.
2. Experimental setup
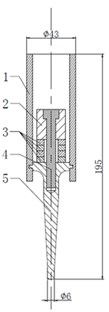
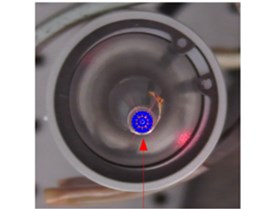
An ultrasonic transducer was bought from Hainertec (Suzhou) Co., Ltd. (Suzhou, China). Fig. 1 shows the transducer structure used in the simulated and experimental analysis. Its transduction section has the same type and size as the Langevin. Four pieces of piezoelectric ceramic rings (PZT-8) packed an opposite polarization direction to each other were sandwiched by the back and front masses (titanium alloy) to form the transduction area. An aluminum alloy frame was assembled to hold the entire transduction section. The tip of the front mass, used as the acoustic exposure section, is named “transducer head” in this paper. When voltage was applied to the piezoelectric ceramics and the frame was fixed, the transducer head emitted ultrasonic waves into the liquid media. The vibration displacement on the top surface of the transducer head was measured by a PSV-500 scanning vibrometer from Polytec Co., Ltd. (Waldbronn, German). In this paper, the first mode of longitudinal vibration of the ultrasonic transducer is excited with 5.5 W input electric power at 21 kHz, whose value can produce acoustic cavitations in the liquid. More characteristics of this ultrasonic transducer can be seen in Fig. 5 of Section 4.
Fig. 1Ultrasonic transducer: 1 – frame; 2 – back mass; 3 – piezoelectric ceramics; 4 – bolt; 5 – front mass (its top is transducer head)
a) Structural sketch
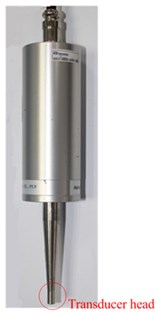
b) Setup
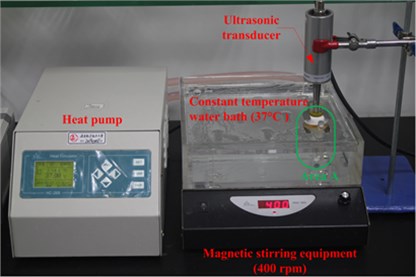
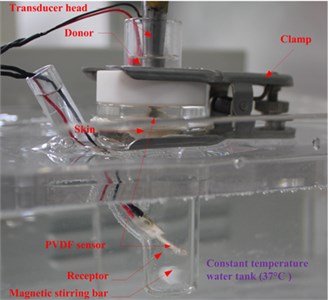
The measurement system in in vitro LFS, shown in Fig. 2, is usually used to measure the permeation of Calcein against time, but in this paper, the acoustic pressure is also measured during the permeation within the same system. A rat skin was sectioned and mounted in vertical Franz diffusion cells TT-8(D) (15-mm inner diameter), which were obtained from Tianjin Rightway Technology Co., Ltd. (Tianjin, China). A Franz cell typically composes of a donor, skin sample, and receptor, as shown in Area A of Fig. 2. A constant temperature system kept the circulating water at 37 °C, and the drug liquid (Calcein with sodium lauryl sulfate solution in this paper) height in the donor maintained 0.025 m.
As shown in Fig. 2, the traditional hydrophone and other acoustic sensors are too big to lay in the donor in in vitro LFS. Thus, in order to measure the acoustic pressure in a small space, two soft and small PVDF piezoelectric strips (from Jinzhou Kexin Electronic Materials Co., Ltd., China) were used. These films of PVDF piezoelectric material can sense external pressure change within the ultrasonic frequency band, and responses in a voltage that is proportional to the change.
Fig. 2Measurement system of permeation in in vitro LFS
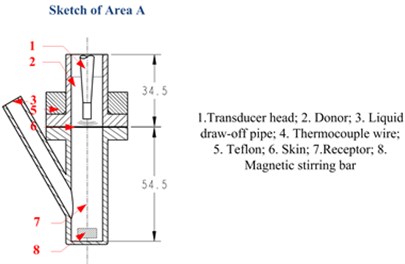
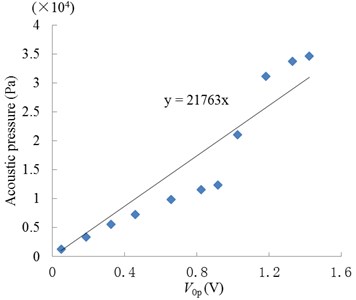
In our experiments, the two strips were placed under the ultrasonic transducer in the donor and at the liquid draw-off position in the receptor respectively, as shown in Fig. 3(a). The former was used to measure the approximate acoustic pressure up the epidermis, and the latter was used to measure the pressure in the receptor. The relationship between the acoustic pressure () and response voltage () of the PVDF strips was calibrated by an acoustic intensity device obtained from Hangzhou Create Ultrasonic Technology Co., Ltd. (Hangzhou, China). In the calibration experiments, a 2 L tank full of water was used, in which the acoustic intensity device and PVDF piezoelectric strips were immersed at the same position and same time. So the acoustic pressure values measured with the acoustic intensity device were the same as that of the PVDF piezoelectric strips, which were proportional to their response voltage values. So, their linear relationship can be seen in Fig. 3(b), which are approximately expressed as:
In the experiments, the response voltages of the two PVDF strips were collected by an oscilloscope (from Tektronix Inc., America), and then acoustic pressure was calculated according to Eq. (1). The PVDF strip in the donor was located between the skin and ultrasonic transducer, which was about 2 mm height upon the skin. Acoustic pressure at the same position was measured every 10 min during the first 90 min of LFS, and the average of these values (including 0 Pa at time = 0) represented the value .
Fig. 3Measurement and calculated methods of acoustic pressure: a) measurement system; b) relationship between the response voltage (0-peak value) of PVDF strip and acoustic pressure
a)
b)
3. Experimental setup
In LFS, an acoustic field with certain intensity in the donor produces acoustic bubbles. The bubbles can be classified into two categories, stable and inertial cavitation: for stable cavitation, the acoustic pressure and streams may increase the permeability of a drug outside the skin; meanwhile, the inertial cavitation gives rise to plenty of shock waves and the micro-jets physically penetrate the stratum corneum (SC), contributing to drug permeation through the skin. Furthermore, some parts of the skin are compressed and the others are stretched due to acoustic streams. In this paper, a FEM simulation method based on COMSOL is used to calculate the acoustic field distribution in in vitro LFS. Here, the simulation is conducted with the following main assumptions:
1) The acoustic field is assumed to be an attenuation of linear elastic waves in the lossy media, including the skin and liquids in the donor and receptor;
2) The influence of the liquid draw-off pipe on the acoustic field is ignored.
3.1. Piezoelectric coupling
For the Langevin type ultrasonic transducer shown in Fig. 1, the driving voltage is applied on four pieces of piezoelectric ceramics, and the converse piezoelectric effect can be calculated by classical piezoelectric equations [9]. When considering the mechanical loss and dielectric loss factors, it can be represented as (in linear elastic range):
where:
where is the strain component, is the electric displacement, is the flexibility coefficient, is stress component, is electric field, is the piezoelectric constant, and is the free dielectric constant. In this paper, is a complex expression including the loss factor in COMSOL. The mechanical loss factors of the titanium alloy, aluminum alloy, high-strength alloy steel and piezoelectric ceramics are assumed as 10-5, 10-3, 10-3, and 1.1×10⁻², respectively. The structural frame of the ultrasonic transducer is given a fixed constraint as the boundary condition.
3.2. Acoustic field coupling in a gas-liquid medium
In LFS, the vibration of the transducer head forms an acoustic field, and COMSOL presents a mathematical model to calculate the coupling relationship, that is, the Acoustic-Structure Boundary coupling to couple a Pressure Acoustics model with a Piezoelectric coupling model. The coupling includes the fluid load on the structure and the structural acceleration as experienced by the fluid. For the Acoustic-Structure Boundary, the boundary conditions in the fluid (the exterior boundary) satisfy the following equation:
where is the structural acceleration, is the surface normal, is complex density of materials, is the total acoustic pressure and is the load (force per unit area) experienced by the structure. In this case, and are the results of the acoustic field and piezoelectric equations in Eq. (2). Then, can be calculated in terms of the initial and boundary conditions.
To obtain the total acoustic pressure , the acoustic cavitation effect should be considered. Cavitation bubbles appear when the acoustic power of the ultrasonic transducer exceeds the cavitation threshold value. This gas-liquid medium changes the acoustic field distribution and acoustic pressure in the liquid. In this paper, a linear absorption coefficient of sound propagation is used to represent the above acoustic field variation due to cavitation bubbles. Therefore, by introducing complex density and complex acoustic speed to explain the damping of the ultrasonic effect, the Helmholtz equation for the propagation of sound waves can be revised as:
where:
where is the angular frequency, is the total acoustic pressure as a function of angular frequency at three-dimensional coordinates (, , ), is the undisturbed pressure in the liquid, is the absorption coefficient, is the liquid density, and is the acoustic speed. The equivalent wavenumber in the gas-liquid medium is equal to that in the acoustic field, namely , while considering sound attenuation.
3.3. Bubbles dynamics
In in-vitro LFS, many bubbles exist in the donor due to ultrasonic cavitation. According to the Cafisch equations theory proposed by Kerry W. Commander [8], the equivalent wavenumber in the gas-liquid medium in an acoustic field should be:
where is the equilibrium radium of cavitation bubbles and is its certain radial distribution and volume fraction, which is assumed to be a Gaussian distribution. is the resonance frequency of the bubbles, is the imaginary unit, and is the damping factor. They are defined as [8]:
where is a parameter chosen to match the gas volume void fraction , is the radius for the Gaussian radii distribution with a maximum value, is a standard deviation of approximate 2×10⁻³ m, is in the range of bubble radii from 5×10⁻⁶ m and 3×10⁻³ m, is the surface tension of the liquid, is the viscosity of the liquid, and the undisturbed pressure in the bubble, equal to that in the liquid , while is the equilibriumpressure in the liquid. The complex dimensionless parameter is defined as [8]:
where is the specific heat ratio of the gas inside the bubbles and , with as the thermal diffusivity of the gas. The relationship between the function and gas volume void fraction is [8]:
where denotes the instantaneous bubble radius at time and position with an equilibrium radius . In the experiment, the volume of the diffusion cell is small (< 20 mL) enough to assume an average constant instead of to calculate parameter .
According to the same real part of wavenumber , in terms of Eq. (6), the absorption coefficient can be represented as:
Therefore, Eqs. (6)-(10) can be substituted into Eq. (11) with the initial and boundary conditions, and the absorption coefficient in LFS can be calculated. Then, the total acoustic pressure can be calculated in terms of Eqs. (2)-(4). The boundary conditions suggest that the liquid boundary contact with air is assumed to be a sound-soft boundary and a sound-stiff boundary with the glass wall.
3.4. Finite element method
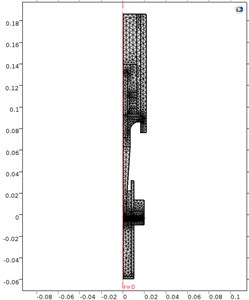
In this paper, a piezoelectric-acoustic coupling model in COMSOL is used to calculate the acoustic distribution based on the above bubble dynamics results. The mesh of the model can be seen in Fig. 4. The ultrasonic transducer is calculated by piezoelectric equations of Eq. (2), and the acoustic fields are calculated by a Helmholtz equation of Eq. (4). The energy transfer functions are derived from the acoustic-structure boundaries on the acoustic exposure interface, as can be seen in Eq. (3). Due to the acoustic cavitation, there are plenty of bubbles in the donor, leading to a large absorption coefficient of acoustic waves in the drug liquid. The absorption coefficient can be calculated by Eqs. (5)-(11) in terms of bubble dynamics, and then it will be substituted into the Eq. (4) which is used to calculate the FEM model of acoustic pressure.
In our experiments, the skin thickness was 5.62×10⁻⁴ m and the absorption coefficient of skin was assumed to be 4 Np/m at 21 kHz. The initial boundary condition is the input voltage on piezoelectric ceramics, which is 40 V. The glass walls of the in vitro LFS are all set as hard acoustic boundaries, and the air-liquid interface is set as a soft acoustic boundary. Therefore, with the above calculation methods and boundary conditions, the acoustic fields can be calculated based on FEM in terms of the absorption coefficient derived from bubbly dynamics.
Fig. 4FEM mesh
4. Results and discussion
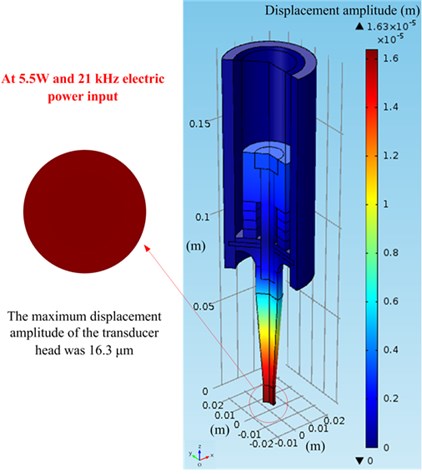
First, a piezoelectric coupling calculation of the ultrasonic transducer was executed using COMSOL. The simulated displacement amplitude in the air of the transducer head was calculated according to Eq. (2), and it was also measured by a PSV-500 scanning vibrometer at 5.5 W and an electric input power of 21 kHz, as shown in Fig. 5. For the simulation, the boundary condition and material parameters are presented in Section 3.4 and the material database is presented in COMSOL; the initial boundary condition is 29 V (that is, 5.5 W input power in the air). Fig. 5 illustrates that the measured displacement amplitudes of the transducer head are relatively equal to the simulation amplitudes and that the entire surface vibration results are approximately 16 μm in the air. Therefore, this piezoelectric coupling calculation method can be effectively applied in the next step on the acoustic field simulation.
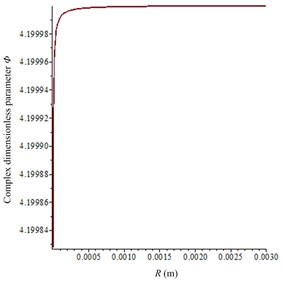
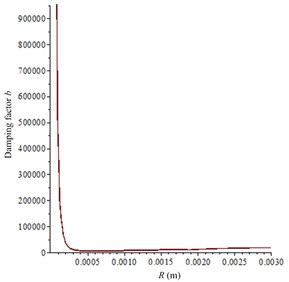
After the piezoelectric coupling process is completed, the acoustic field in in vitro LFS can be calculated according to Section 3.2 and 3.3. Then, according to Eqs. (5)-(10) and the Cafisch theory [8], the complex dimensionless parameter can be calculated as seen in Fig. 6(a), and the damping factor is shown in Fig. 6(b). In the experiments, there were sodium lauryl sulfate (a surfactant used to synergistically enhance the effects of sonophoresis) in the donor but almost none in the receptor, which can dramatically enhance the gas volume void fraction. So, given the gas volume void fraction 10-3 as the approximate average value in the donor at 21 kHz and 10-5 in the receptor, approximate values are chosen from document [8] to represent the large number of bubbles in the donor and smaller number of bubbles in the receptor. Therefore, the absorption coefficient can be numerically calculated to be 29.4 Np/m and 2.9 Np/m in the donor and the receptor, respectively.
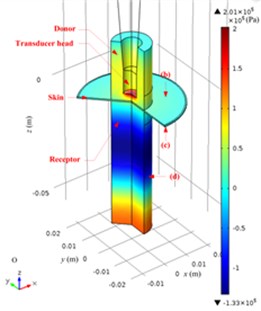
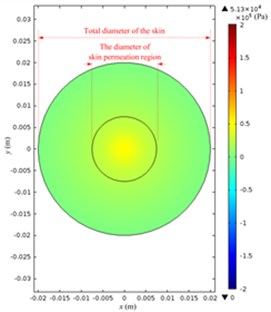
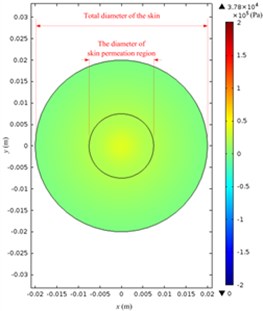
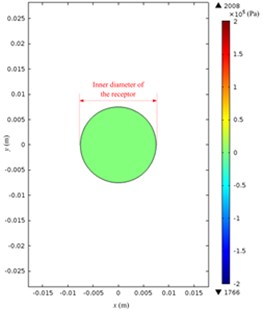
The acoustic pressure in a Franz diffusion cell can then be calculated based on Eq. (4) at of 40 V (5.5 W electric power input in water) and 21 kHz, and its results are presented in Fig. 7. Fig. 7(a) shows that in the entire acoustic pressure distribution (simulation) of LFS, the maximum value is 2.01×10⁵ Pa, which appears under the transducer head; the acoustic pressure declined sharply as it is away from the head. Fig. 7(b) and (c) describe the acoustic pressure distribution (simulation) on both the stratum corneum and dermis of the skin, respectively, and the maximum value of which is 5.1×10⁴ Pa, which appears on the stratum corneum under the center of the transducer head, while the maximum value on the dermis surface in the receptor is 3.8×10⁴ Pa. Fig. 7(d) illustrates the acoustic pressure distribution (simulation) at the position of liquid draw-off in the receptor, and the pressure values are all approximately 2.0×10³ Pa.
Fig. 5Vibration displacement amplitude on the top of the transducer head at 5.5 W and 21 kHz in air: a) simulated results; b) experimental results
a)
Test points in the top of transducer head
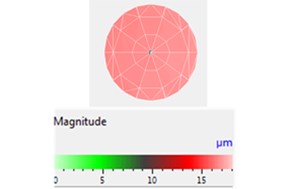
Displacement distribution and the maximum displacement amplitude of the transducer head was 16.7 µm
Fig. 6Calculation parameters relationship with R (the equilibrium radium of cavitation bubbles): a) complex dimensionless parameter Φ; b) damping factor b
a)
b)
Further, in terms of Eq. (1), the experimental acoustic pressure under the transducer head is 9.1 (±0.2) ×104 Pa when the measured response voltage of the PVDF strip is 4.2±0.9 V; the acoustic pressure at the liquid draw-off position is 2.1 (±0.6) ×103 Pa when the PVDF response voltage is 0.097±0.026 V. As shown in Fig. 7(b) and (d), the simulation acoustic pressure value on the parallel plane at the liquid draw-off position is approximately equal to the experiment value, but the one on the skin is smaller than the experiment value, this is because of the thickness influence of the PVDF strip. The actual measurement position is about 2 mm above the skin.
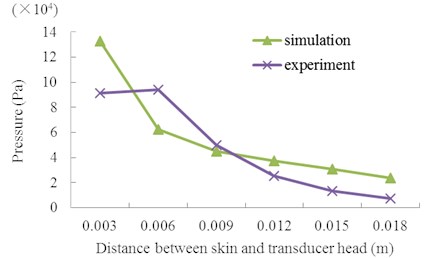
In LFS, the distance between the skin and transducer head, investigated in Fig. 8, is an important factor in permeation efficiency. In the measurement, the skin, PVDF strip, and Franz cell were fixed together and the height of the ultrasonic transducer was adjusted to change the distance between the skin and its head. The PVDF piezoelectric strip in the donor was used to measure the acoustic pressure, following the steps described in Section 2. The figure describes the maximum acoustic pressure with different heights at 40 V. In Fig. 8, both the experimental and simulation results show a quick reduction in the acoustic pressure with an increase in distance, and simulation results are approximately close to the experiment values. Nevertheless, there is some deviation between experimental and simulation values, this is because the acoustic field was slightly changed by the PVDF strip as it was used as measure tool. The above results demonstrate that the height of ultrasonic head is very sensitive to the acoustic pressure on the skin in LFS, so the head should be put closer to the skin as much as possible.
Fig. 7Simulated acoustic pressure distribution at V0p= 40 V: a) acoustic pressure distribution in the Franz diffusion cell; b) acoustic pressure distribution at the upper surface of the skin in the donor; c) acoustic pressure distribution at the lower surface of the skin in the receptor; d) acoustic pressure distribution on the parallel plane at the liquid draw-off position
a)
b)
c)
d)
Fig. 8Maximum acoustic pressure at 2 mm height upon the skin with different distance between the skin and transducer head at V0p= 40 V
5. Conclusions
For obtaining the acoustic pressure distribution in LFS, an acoustic-piezoelectric coupling model is established based on COMSOL multiphysics. Aiming at acoustic cavitations effect, the absorption coefficients of liquids are calculated in terms of bubble dynamics. Experimental and calculated results show that calculated acoustic pressure is appropriately close to the experimental values; the maximum acoustic pressure appears under the transducer’s head, and it quickly decays far away from the head; the transducer should be put closer to the skin for larger pressure. Therefore, this model can be utilized in the analyses of energy transformation in LFS.
References
-
Park D., Park H., Seo J., et al. Sonophoresis in transdermal drug deliveries. Ultrasonics, Vol. 54, Issue 1, 2014, p. 56-65.
-
Azagury A., Khoury L., Enden G., et al. Ultrasound mediated transdermal drug delivery. Advanced Drug Delivery Reviews, Vol. 72, 2014, p. 127-143.
-
Seto J. E., Polat B. E., Lopez R. F. V., et al. Effects of ultrasound and sodium lauryl sulfate on the transdermal delivery of hydrophilic permeants: comparative in vitro studies with full-thickness and split-thickness pig and human skin. Journal of Controlled Release, Vol. 145, Issue 1, 2010, p. 26-32.
-
Polat B. E., Blankschtein D., Langer R. Low-frequency sonophoresis: application to the transdermal delivery of macromolecules and hydrophilic drugs. Expert Opinion on Drug Delivery, Vol. 7, Issue 12, 2010, p. 1415-1432.
-
Mitragotri S., Blankschrein D., Langer R. Ultrasound-mediated transdermal protein delivery. Science, Vol. 269, 5225, p. 1995-850.
-
Aldwaikat M., Alarjah M. Investigating the sonophoresis effect on the permeation of diclofenac sodium using 3D skin equivalent. Ultrasonics Sonochemistry, Vol. 22, 2015, p. 580-587.
-
Wolloch L., Kost J. The importance of microjet vs shock wave formation in sonophoresis. Journal of Controlled Release, Vol. 148, Issue 2, 2010, p. 204-211.
-
Commander K. W., Prosperetti A. Linear pressure waves in bubbly liquids: Comparison between theory and experiments. Journal of The Acoustical Society of America, Vol. 2, Issue 85, 1989, p. 732-746.
-
Zhao C. Ultrasonic Motors: Technologies and Applications. First Ed. Science Press Beijing and Springer, Beijing, 2011, p. 28-31.
About this article

This work is supported by the following funding organizations in China: The National Natural Science Foundation of China (Grant No. 51405224), the Natural Science Foundation of Jiangsu Province (Grant No. BK20140818), the Fundamental Research Funds for the Central Universities (Grant No. NJ20160003).
