Abstract
The paper adopted a bionic hemispherical convex structure in the A pillar-rear view mirror regions according to actual requirements. Furthermore, impacts of the bionic structure on aerodynamic characteristics and noises in the region were studied. Friction resistance of airflows was greatly reduced, fluctuations and pulsation pressures of flow fields were also reduced, and characteristics of flow fields and sound fields were improved. The computational results were finally verified by the experimental test. Firstly, the aerodynamic lift force coefficient and drag force coefficient of the bionic model were computed, and they were obviously lower than those of the original model. The adhesive force between tires and ground during vehicle running was increased, and the danger degree of “waving” of high-speed vehicle running was weakened. In this way, stability of vehicle running could be improved. Secondly, flow fields of the bionic model were computed. Compared with the original model, an obvious vortex was behind the original model, while no vortexes were behind the bionic model. Therefore, convex structures of the bionic model had obvious impacts on flow fields behind the rear view mirror. Airflow separation situations were obvious improved at wheels, windshield and rear side windows of the bionic model. Due to blocking of convex structures of the A pillar and rear view mirror in the bionic model, airflows was hindered and obvious dragging phenomena were formed. Therefore, flow fields in the side window regions could be improved greatly. In addition, the flow field scope under the rear view mirror in the bionic model was also decreased. Ringed vortex structures appeared behind the rear view mirror in the bionic model. The ringed vortex structures were closely interlaced and then extended together backwards. Vortexes behind the rear view mirror in the original model were chaotic, where most of them were attached on the surface of side windows. In the original model, turbulent flows with certain strength were on the right upper corner of the side window region. In the bionic model, no turbulent flows were in the same regions. This result indicated that through using the bionic convex structures, airflows flowing through side windows could be combed and could move backwards towards upper and lower edges of the side windows. It could be predicted that pulsation pressures on the side window surface would surely decrease. Therefore, aerodynamic noises caused by pulsation pressures in side window regions would also be improved correspondingly. Especially in regions behind A pillar-rear view mirrors, the maximum noise reduction amplitude reached about 20 dB.
1. Introduction
Relations between vehicles and people become increasingly closer. Riding comfort becomes the vehicle quality to be concerned a lot, where noises become one of the important performance indexes of vehicles [1-4]. Vehicle noises are mainly divided into mechanical vibration noises and aerodynamic noises. When the vehicle is running at a low speed, mechanical vibration noises become the main noise source of vehicles [5]. After years of researches, mechanical vibration noises have been controlled gradually. When the vehicle is running at a high speed, aerodynamic noises become the main noise source. Most aerodynamic noises are gradually absorbed and blocked by interior materials with good performance. Nevertheless, due to special positions, rear view mirrors and A-pillars will cause complicated vortex fields outside vehicles [6-8]. It is shown in experiments and analysis that vortex fields near side window regions are decided by two types of airflows. Firstly, airflows coming from the front part of a vehicle flow backwards along side window regions. Secondly, airflows passing through the windshield get separated while passing through the A pillar. Strong vortexes are formed on the side window surface behind A pillar. Airflows get separated and then get attached in this region. The complete region could be divided into a separation region and a re-attachment region. Strong vortexes behind the A pillar will cause very large pressure pulsations and noise. On one hand, vortexes generate aerodynamic noises as a noise source. On the other hand, surface pressure pulsations generated by vortexes will cause vibration of vehicle panels, finally causing noises. Vehicle window glass is one of minority components for which interior materials could not be applied. Door panel is a specific thin-shell structure, so it can easily generate vibration and thus radiate noises into the vehicle, which would seriously affect riding comfort of people in the vehicle. It is shown in studied results that the sound pressure level increased by about 2.5 dB when the vehicle running speed increased by 10 km/h, namely aerodynamic noises excited by the rear view mirror is roughly in direct ratio to 6th power of the vehicle speed [9-11]. Therefore, researches on external flow fields and aerodynamic noise mechanisms caused by rear view mirrors and A pillars is very important for vehicles.
At present, some researches already focus on A pillar-rear view mirror regions. Xie [12] applied a bidirectional fluid-structure coupling method to conduct a numerical computation of pulsations pressures on the side window surface, and compared computational results with wind tunnel experiment results. Results show that the flow field pressure pulsations were strengthened by fluid-structure coupling effects, where the higher vehicle speed led to great effects of fluid-structure coupling effects on aerodynamic noises. Shen [13] modified the A pillar and conducted simulation computation of side window pulsation pressures, where results show that round-corner processing of the A pillar could effectively reduce side window pulsation pressures. Gu [14] cut grooves on the B pillar to control window wind noises, and adopted large eddy simulation to conduct a numerical computation. Results show that grooves could effectively restrain wind noises. Naser [15] simulated the flow field structure and sound field propagation around the A pillar, and observed boundary layer noises generated from airflow separation behind the A pillar, finding that boundary layer noises played a dominant role at later stages of sound propagation. Nevertheless, all the mentioned research achievements analyzed flow fields and sound fields of A pillar-rear view mirror regions. Related measures for noise reduction still need to be further studied. In reference [16], the impact of the A-pillar vortex on the wall flow of the side window of a vehicle is investigated experimentally using a 30° dihedron model. The measurement of the unsteady pressure at the wall provides a map of the pressure fluctuation intensity, and a spectral analysis is performed to track the dominant frequencies of the wall pressure fluctuations. In reference [17], large-eddy simulation method was adopted to compute side-window buffeting noises when the side-window near the driver was partially opened by 25 %, and the road test data validated its correctness. In reference [18], this study analyses the contribution of external rear-view mirrors to the total drag force and the overall sound pressure level at A, B and C pillars, while optimizing the external rear-view mirror design accordingly.
The reported researches mainly analyzed aerodynamic characteristics and noises in A pillar-rear view mirror regions, where the researches rarely focus on bionic aerodynamic noise reduction in the regions. Convex structures on creature surfaces could reduce their motion resistance and noises. According to some successful cases [19-22], the paper adopts a bionic hemispherical convex structure in the A pillar-rear view mirror region according to actual requirements. Furthermore, the paper researches impact of the bionic structure on aerodynamic characteristics and noises in the region. When high-velocity airflows flow through the A pillar-rear view mirror region during vehicle running, a part of airflows is attached on the surface of the convex structure due to impacts of its unsmooth structure. Therefore, contacts between airflows and structures are transformed into contacts between airflows and airflows. As a result, friction resistance of airflows is greatly reduced, fluctuations and pulsation pressures of flow fields are also reduced, and characteristics of flow fields and sound fields are improved.
2. Computational models of flow fields of side window regions with bionic structures
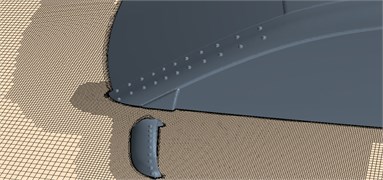
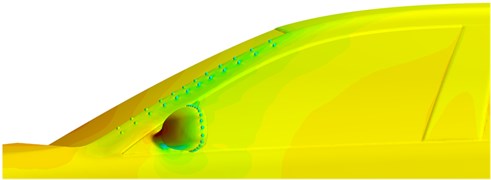
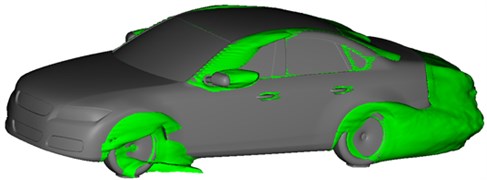
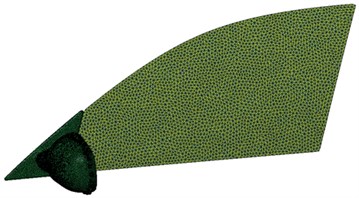
Due to complicated surfaces and numerous details in a real vehicle model, a lot of time shall be spent on model processing, mesh generation and computation. Therefore, a simple model is generally used in aerodynamic researches. Some local details such as antenna were neglected. The windscreen wiper and the vehicle bottom were processed into flat. Ground clearance was adjusted to 130 mm. Impacts of flow fields in the vehicle were not considered in the computation, so the vehicle windows were closed. As shown in Fig. 1(a), the bionic convex structure was adopted on the vehicle A pillar and rear view mirror. The bionic convex structure was a hemisphere with radius of 3 mm, and distance between the adjacent convex structures was 20 mm, as shown in Fig. 1(b).
Fig. 1Geometric model of the bionic structure in side window regions
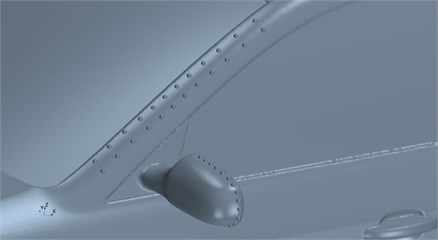
a) Side window regions
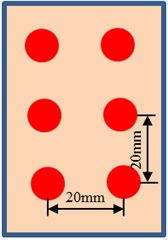
b) Bionic structures
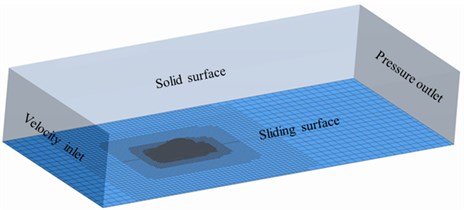
During the computational simulation, computational domains should be divided in the space of the vehicle model, so the computational space scope could be determined, and flow field situations around the vehicle body could be reflected [23-25]. Theoretically, external flow field space is infinite when the vehicle is running. During dividing the computational domain, impacts of wall faces of computational domains should be taken into account. Common cuboid was selected as the computational domain, as shown in Fig. 2. In order to reduce impacts of wall faces of the computational domain, the computational domain should be big enough, so reliability of computational results could be increased. Nevertheless, if a computational domain is too large, the mesh amount in the computational domain will increase sharply. As a result, the occupation rate of computer resources will increase rapidly, and computational time will increase obviously. Blocking effects of wind tunnel wall faces should be considered. Therefore, the wind tunnel blockage ratio of the model should be lower than 5 %, namely the ratio between the vehicle orthographic projection area and the cross section of experimental section should be lower than 5 %. Therefore, when the computational domain is determined, it could be established with reference to requirements for the wind tunnel experimental section. The boundary condition of the computational model was also marked in Fig. 2. In addition, the paper mainly analyzes flowing rules of flow fields of the vehicle window regions, so the flow field should be wide enough to satisfy full development of turbulent flows. In conclusion, the determined sizes of computational domain are as follows: total length is 11 L; distance between the airflow inlet and the vehicle front end is 3 L; distance between the airflow outlet and the vehicle rear end is 7 L; total width is 7 W; distance between wall faces and the vehicle in the computational domain is 3 L respectively; total height is 5 H; distance between the top of computational domain and the vehicle top is 4 H. L, M and H are length, width and height of the vehicle, respectively.
Fig. 2Computational domain of flow fields in vehicle side window regions
Resolution ratio of surface meshes of the vehicle body is determined according to geometric characteristics and flow characteristics of the model. Sizes of meshes should be relatively small in regions with obvious geometric shape changes and violent changes of flow parameters; sizes of meshes could be larger at flat and straight vehicle body parts. After design of the surface meshes was completed, solid meshes could be generated according to certain mesh stretch ratio. In near wall regions, the stretch ratio of meshes should not exceed 1.1; the stretch ratio of meshes from the near wall region to the boundary layers should be lower than 1.2. The mesh stretch ratio should not exceed 1.5 in regions outside the boundary layers. Such setting is mainly based on partition ideas, where as many meshes as possible shall be arranged at places with violent flow; meshes could be sparse in non-viscous regions. Therefore, on one hand, resolution ratio of meshes could be ensured; on the other hand, smooth transition of meshes could be ensured, and rational computation results could be obtained. Detailed settings of meshes of the computational model are as follows: 0.1 mm was set as the standard size of the overall computation model at first; then, surface mesh custom setting was conducted on each surface; maximum size of vehicle surface meshes was 10 mm; minimum value was 1mm. Different surface meshes were set at contact positions between wheels and ground, so contact could be prevented, and contour line completeness of wheels could be ensured. Based on the surface meshes, solid mesh parameters were then set. Cutting element meshes with high computational speed, high accuracy and good convergence were used as solid meshes. In order to obtain more accurate computation results, the solid meshes were encrypted in 4 layers from inside to outside. Side window regions were locally encrypted. Mesh densities were 15 mm, 45 mm, 90 mm, 150 mm and 240 mm in succession. With considering impacts of the boundary layers, boundary layer meshes were divided on the vehicle wall face and the vehicle bottom. Amount of boundary layers was set to be 8. Finally, the computational model contained 7.2 million elements, as shown in Fig. 3.
Fig. 3Computational domain meshes of flow fields of the vehicle
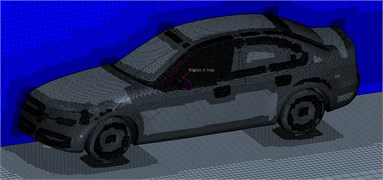
a) Longitudinally symmetric planar meshes of the vehicle body
b) Local meshes around rear view mirrors
Numerical computation is conducted in a limited region, so boundary conditions should be given to boundaries in the computational domain. Determining of boundary conditions should satisfy adaptation, which has obvious physics significance. Computational boundaries of external flow field characteristics of vehicles include inlet boundary, outlet boundary and wall face boundary. Specific definitions are as follows: the computational domain wall face in front of the vehicle was set as the velocity inlet; the rear computation domain wall face far from the vehicle was set as the pressure outlet; computational domain boundaries on the top and lateral faces of the vehicle were set as slippage wall faces; computational domain boundaries of the vehicle bottom were set as non-slippage wall faces; in order to eliminate impacts of wind relative to ground motion during simulation, the motion speed of the ground was set to be equal to the wind velocity. Computational time step length was 0.0005 s. The maximum iteration amount was 20 within each time step. The separated SIMPLE algorithm was adopted. Spatial dispersion satisfied second order accuracy. 0.0001 was set as the residual error standard.
3. Computational results and discussions of flow fields
Fig. 4 shows comparison of aerodynamic drag and lift force coefficient of the original model and the bionic model. It is shown in the figure that the aerodynamic lift force coefficient and drag force coefficient of the bionic model were obviously lower than those of the original model. Decrease of the lift force coefficient means decrease of the longitudinal inclination moment borne by the vehicle. Therefore, the adhesive force between tires and ground during vehicle running was increased, and the danger degree of “waving” of high-speed vehicle running was weakened. In this way, stability of vehicle running could be improved, which is also a meaningful aspect in aerodynamic optimization of vehicles.
Fig. 4Drag and lift force coefficient of the vehicle
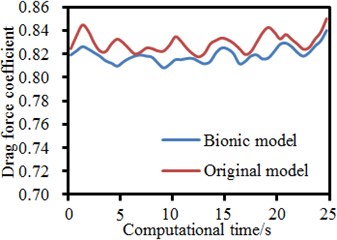
a) Drag force coefficient
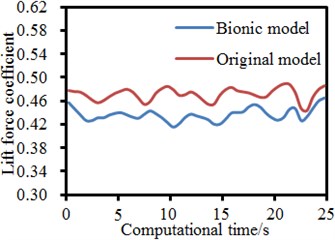
b) Lift force coefficient
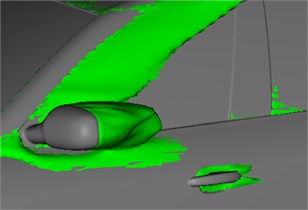
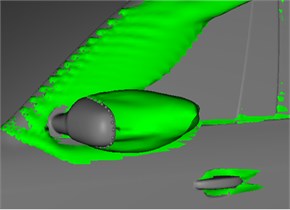
Fig. 5 shows distribution of velocities and pressure fields of side window regions. It is shown in Fig. 5(a) that when front airflows hit A pillars and rear view mirrors, the airflows were blocked by the bionic convex structures, and the rear flow velocity was basically 0. However, when airflows flowed backwards along the A pillar and rear view mirror, pressures near the A pillar and rear view mirror regions were kept consistent because of the characteristic that pressures are not changed after passing by boundary layers. Airflow viscosity will hinder airflow motion, but the airflows will overcome the drag and keep on flowing backwards along the A pillar and rear view mirror face due to motion promotion of favorable pressure gradient. Due to turbulent flows near side windows, pressure gradients on side windows were distributed obviously, as shown in Fig. 5(b). Pressures near the A pillar and rear view mirror regions were the minimum. Pressures gradually increased along the downstream direction. Regions with the highest pressure were located under the right part of the side window. Fig.6 shows flowing situations of the fluid in regions behind the rear view mirror in the original model and the bionic model. It is shown in Fig. 6(a) that an obvious vortex was behind the original model. No vortexes were behind the bionic model in Fig. 6(b). Therefore, convex structures of the bionic model had obvious impacts on flow fields behind the rear view mirror.
Fig. 7 shows positions and shapes of airflow separation regions described by contour surfaces under the total flow field pressure of 0 Pa. It is shown in the figure that obvious airflow separation regions were in A pillar and rear view mirror regions. Large separation regions were also at wheels and wheel chambers. These airflow separation regions were typical positions for causing aerodynamic noises. However, reduction of aerodynamic noises could hardly be taken as design goals in shape design of wheels and vehicle body bottom.
Fig. 5Velocity and pressure field distribution in side window regions
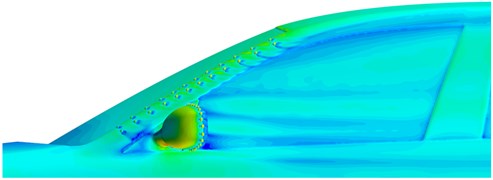
a) Distribution of velocity fields
b) Distribution of pressure fields
Fig. 6Comparison of velocities in wake flow regions of rear view mirrors
a) Original model
b) Bionic model
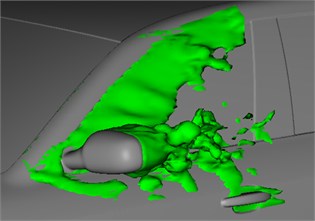
In addition, large separated regions were at the tail part of the vehicle, which was a main reason for causing aerodynamic resistance, but only affected aerodynamic noises in the vehicle slightly. In the tail flow field of the vehicle, the complex flow was caused by the airflow separation. The vortex of the vehicle wall surface was continuously transmitted to the other positions of the flow field, and large-scale vortexes were then caused. The vortex was continuously detached from the vehicle wall surface, and backward flowed. Meanwhile, some new vortexes were also generated. In view of the energy, the detached and generated vortexes will reduce the energy. Compared with the original model, it could be found that airflow separation situations were obvious improved at wheels, windshield and rear side windows of the bionic model. Fig. 8 shows positions and shapes of airflow separation regions in the side window regions. It could be found that the airflows got separated in side window regions. After that, a part of airflows got attached in the rear side window regions, and the other part of regions got attached on the front side window door handle. Compared with the original model, it could be found that due to blocking of convex structures of the A pillar and rear view mirror in the bionic model, airflows was hindered and obvious dragging phenomena were formed. Therefore, flow fields in the side window regions could be improved greatly. In addition, the flow field scope under the rear view mirror in the bionic model was also decreased.
Fig. 7Airflow separation regions of the complete vehicle
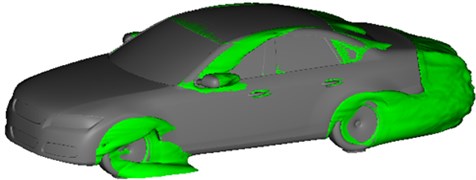
a) Original model
b) Bionic model
Fig. 8Air flow separation regions of side window regions
a) Original model
b) Bionic model
Fig. 9 shows two contour surfaces of the interval of 0.05 s and total flow field pressure of 0 Pa. It is shown in the figure that shape changes were obvious in the wake flow region of the rear view mirror at the 2 moments, while changes in the A pillar region were not obvious. This result could explain the reason why the aerodynamic noises caused by the rear view mirror wake flow regions were more obvious in low-frequency bands (below 750 Hz) compared with A pillar regions. Compared with the original model, it could be found that the separation phenomenon behind the rear view mirror was also improved in the bionic model. Especially at 0.20 s, airflows extended backwards along the rear view mirror. Only a few of airflows were attached on the lower edge of the side window. In addition, it could also be found that the bionic convex structures on rear view mirrors and A pillars could effectively block flowing of airflows, and obvious dragging phenomena appeared. Through the vortex contour surfaces, spatial changes of velocities could be expressed, and spatial unsteady vortex structures could be reflected. Fig. 10 showed 2 moments, which were the same as those in Fig. 9. The flow field vortex in side window regions had a contour surface shape of 1300 s-1, where different colors represented different sizes of airflow velocities. Ringed vortex structures appeared behind the rear view mirror in the bionic model. The ringed vortex structures were closely interlaced and then extended together backwards. Vortexes behind the rear view mirror in the original model were chaotic, wherein most of them were attached on the surface of side windows. In the original model, turbulent flows with certain strength were on the right upper corner of the side window region. In the bionic model, no turbulent flows were in the same regions. This result indicated that through using the bionic convex structures, airflows flowing through side windows could be combed and could move backwards towards upper and lower edges of the side windows. It could be predicted that pulsation pressures on the side window surface would surely decrease. Therefore, aerodynamic noises caused by pulsation pressures in side window regions would also be improved correspondingly.
Fig. 9Airflow separation status at different moments
a) Original model ( 0.20 s)
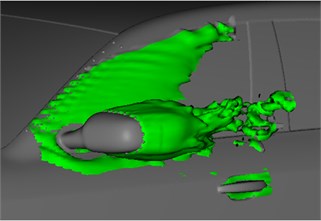
b) Bionic model ( 0.20 s)
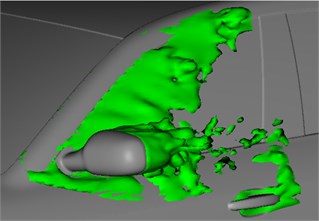
c) Original model ( 0.25 s)
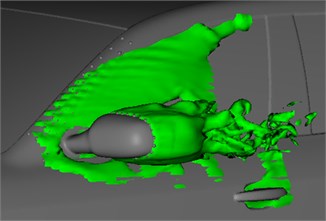
d) Bionic model ( 0.25 s)
Fig. 10Contour surfaces of vortexes of side window regions at different moments
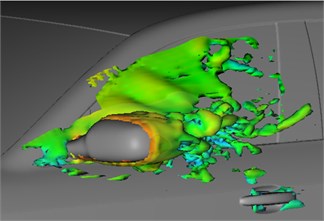
a) Original model ( 0.20 s)
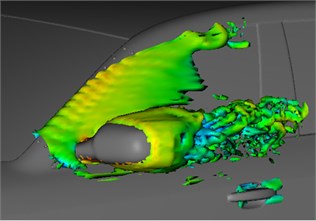
b) Bionic model ( 0.20s )
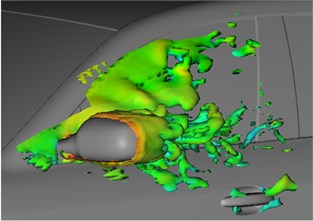
c) Original model ( 0.25 s)
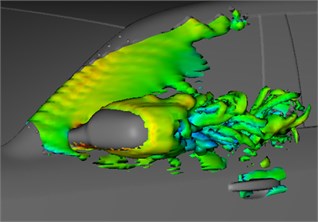
d) Bionic model ( 0.25 s)
4. Results and discussions of the numerical simulation of flow noises
Flow field is the reason for causing aerodynamic noises. Therefore, aerodynamic noises could be further computed based on surface pulsation pressures of side window regions. The acoustic finite element method in VIRTUAL.LAB has great superiority in solving internal sound fields and sound radiation. It is fair to say that it already develops very perfectly. However, as for some ultra-large problems, the boundary element method (BEM) is still the best choice [26-30]. Regarding large-scale models, acoustic computation amounts could hardly be achieved basically when the finite element method was used to divide solid meshes, where the boundary element method only conducts element division of boundaries of studied regions, so sound radiation could be solved in numerical computation through boundary discretization. Aiming at the model in the paper, the direct boundary element method was used to compute aerodynamic noises of the side window regions. Acoustic computation meshes on the surface of side window regions were triangular meshes, wherein the edge length was 1 mm, the element amount was 10786, and the node amount was 11989. The air density is 1.225 kg/m3, and the sound velocity is 340 m/s. Damping effects of air on sound propagation were not considered. The ground is assumed as a full reflection surface of sound waves. Surface dipole sound sources were considered in the computation, namely surface pulsation pressures were applied to the acoustic computation meshes and taken as boundary conditions of computation. 10 observation points were set on the boundary element model, as shown in Fig. 11(a). The final boundary element model is shown in Fig. 11(b).
Fig. 11Boundary element model and observation points of side window regions
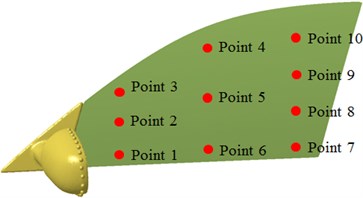
a) Observation points
b) Boundary element model
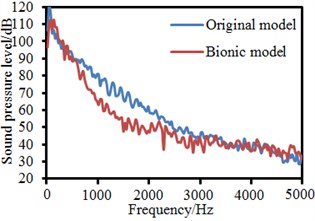
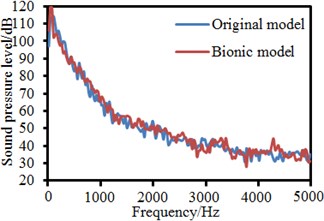
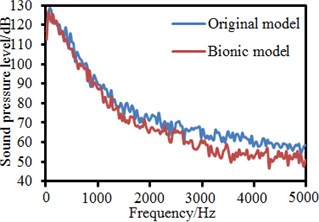
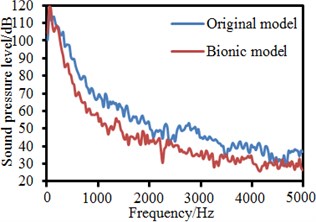
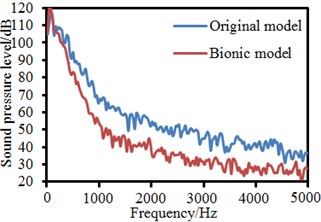
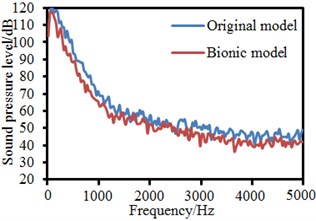
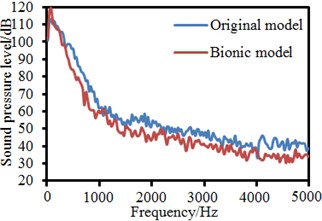
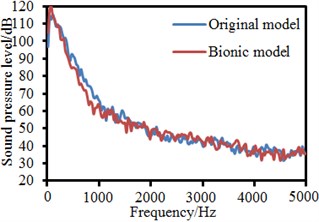
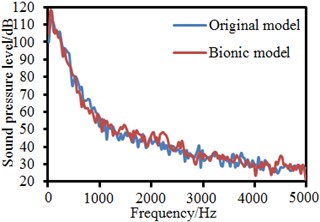
Sound pressure levels of the original model and the bionic model at 10 observation points were extracted, as shown in Fig. 12. It is shown in the figure that the bionic model had an obvious noise reduction effect at most observation points. Especially in regions behind A pillar-rear view mirrors, including observation points 1, 3, 4, 5, 6 and 7, the bionic model obtained good noise reduction effects, where the maximum noise reduction amplitude reached about 20 dB. Observation point 2 was located at the vortex center on the side window wall face, so noise reduction effects were not obvious. Noise reduction effects at observation points 8, 9 and 10 were not obvious as these points were located at the right upper corner of the side window regions and were only slightly affected by vortexes. These observation points were far from the A pillar-rear view mirror regions, so that improved effects of the bionic structures on the airflows were slowly weakened with the increased distance.
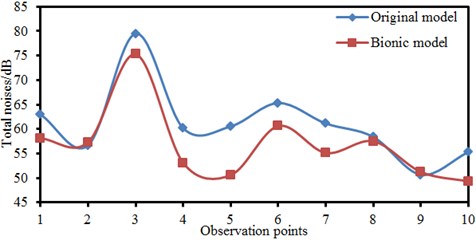
In order to analyze improved effects of the bionic model on aerodynamic noises more visually and clearly, total noises at observation points of the two models were compared, as shown in Fig. 13. It is shown in Fig. 13 that noise reduction effects of the bionic model were very obvious at observation points 1, 3, 4, 5, 6 and 7. Especially at the observation point 5, the total noise decreased by 12 dB. Total noises of the bionic model at observation points 2, 8 and 9 were not changed basically because flow fields of these observation points were not impacted by the bionic structure. Aerodynamic noises at the observation point 3 reached the maximum value in the two models as the observation point 3 was close to the lower edge of A pillars and seriously affected by vortexes separated from A pillars.
Fig. 12Sound pressure levels of different observation points
a) Observation point 1
b) Observation point 2
c) Observation point 3
d) Observation point 4
e) Observation point 5
f) Observation point 6
g) Observation point 7
h) Observation point 8
i) Observation point 9
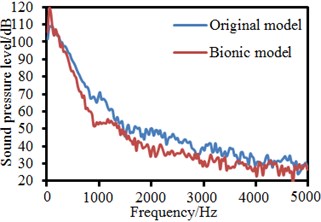
j) Observation point 10
Fig. 13Total noises of different observation points
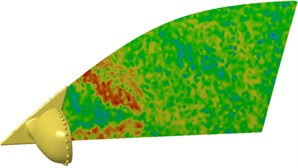
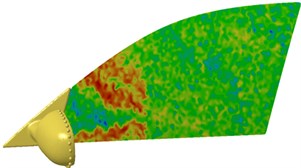
Sound pressure distributions of the two models were further extracted, as shown in Fig. 14 and Fig. 15. It is shown in Fig. 14 that with the increased frequency, aerodynamic noise distribution became more and more uniform. In high frequencies, the sound wave wavelength was short, and sound waves could bypass A pillars and rear view mirrors in the side window regions, so the distribution was more uniform.
Fig. 14Sound pressure contours of the original model at different frequencies
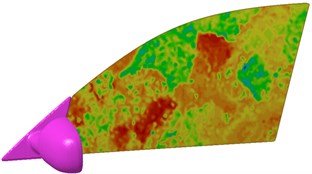
a) 100 Hz
b) 1000 Hz
d) 3000 Hz
d) 5000 Hz
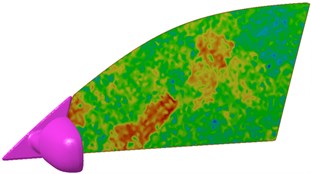
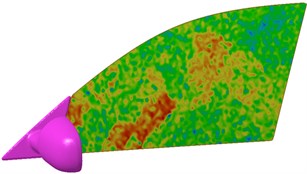
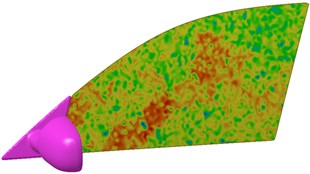
Fig. 15Sound pressure contours of the bionic model at different frequencies
a) 100 Hz
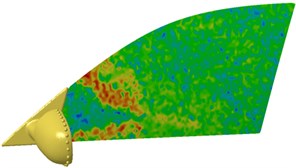
b) 1000 Hz
c) 3000 Hz
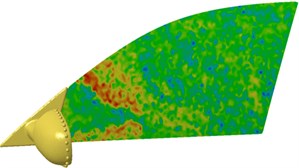
d) 5000 Hz
In addition, it is shown in the sound pressure contours of 4 frequency points that an inclined upward red region was on the side window, which was caused by turbulent flows attached on the side window. It is shown in Fig. 15 that sound pressure contours of 4 frequency points had a flaring red region near the rear view mirror. The phenomenon was generated from drag airflows caused by the bionic convex structure on the A pillar and rear view mirrors. It is shown in comparison between Fig. 14 and Fig. 15 that sound pressures of the bionic model were obviously lower than those of the original model, especially at the right upper corner of the side window.
5. Experimental verification of flow noises
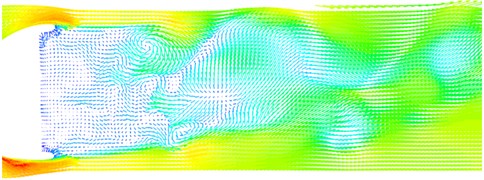
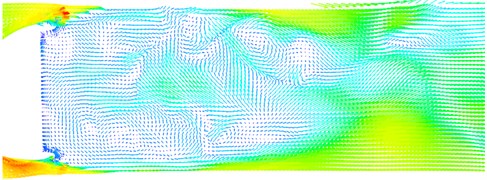
In addition, in order to observe airflow flowing in the wake flow region of rear view mirrors, the laser particle image velocimetry technology [31-35] was used in the vehicle wind tunnel to test velocity fields in the wake flow region of rear view mirrors, so correctness of the numerical simulation method in the paper could be verified. Velocity fields in the tail region of rear view mirrors obtained in experimental test were extracted and compared with numerical simulation results, as shown in Fig. 16. It is shown in Fig. 16 that velocity fields were similar between the experiment and numerical simulation. Regions near the mirror face of rear view mirrors were low-velocity regions, in which no vortex existed. Obvious vortexes were generated at places far from the mirror face region of rear view mirrors. During backward extending of vortexes, flowing directions were similar between the experiment and the numerical simulation, which further verified reliability of the computational model in the paper. During computing the flow field, Reynolds number effect was not considered enough, and the numerical simulation had errors. Therefore, the computational results were not completely consistent with those of the experimental test.
Fig. 16Comparisons of velocities between numerical simulation and experimental test

a) Numerical simulation
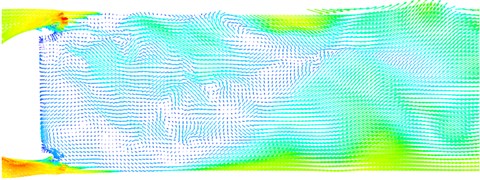
b) Experimental test
6. Conclusions
1) The aerodynamic lift force coefficient and drag force coefficient of the bionic model were obviously lower than those of the original model. The adhesive force between tires and ground during vehicle running was increased, and the danger degree of “waving” of high-speed vehicle running was weakened. In this way, stability of vehicle running could be improved. An obvious vortex was behind the original model. No vortexes were behind the bionic model. Therefore, convex structures of the bionic model had obvious impacts on flow fields behind the rear view mirror.
2) Compared with the original model, airflow separation situations were obvious improved at wheels, windshield and rear side windows of the bionic model. Due to blocking of convex structures of the A pillar and rear view mirror in the bionic model, airflows was hindered and obvious dragging phenomena were formed. Therefore, flow fields in the side window regions could be improved greatly. In addition, the flow field scope under the rear view mirror in the bionic model was also decreased.
3) Compared with the original model, it could be found that the separation phenomenon behind the rear view mirror was also improved in the bionic model. Ringed vortex structures appeared behind the rear view mirror in the bionic model. The ringed vortex structures were closely interlaced and then extended together backwards. Vortexes behind the rear view mirror in the original model were chaotic, where most of them were attached on the surface of side windows. In the original model, turbulent flows with certain strength were on the right upper corner of the side window region. In the bionic model, no turbulent flows were in the same regions. This result indicated that through using the bionic convex structures, airflows flowing through side windows could be combed and could move backwards towards upper and lower edges of the side windows. It could be predicted that pulsation pressures on the side window surface would surely decrease. Therefore, aerodynamic noises caused by pulsation pressures in side window regions would also be improved correspondingly. Especially in regions behind A pillar-rear view mirrors, the maximum noise reduction amplitude reached about 20 dB.
4) With the increased frequency, aerodynamic noise distribution became more and more uniform. In addition, sound pressure contours of 4 frequency points had an inclined upward red region on the side window in the original model. Sound pressure contours of 4 frequency points had a flaring red region near the rear view mirror in the bionic model.
References
-
Ma C., Chen C., Liu Q., et al. Sound quality evaluation of the interior noise of pure electric vehicle based on neural network model. IEEE Transactions on Industrial Electronics, 2017, https://doi.org/10.1109/TIE.2017.2711554.
-
Wei W., Song H., Li W., et al. Gradient-driven parking navigation using a continuous information potential field based on wireless sensor network. Information Sciences, Vol. 408, 2017, p. 100-114.
-
Sarafraz H., Sarafraz Z., Hodaei M., et al. Minimizing vehicle noise passing the street bumps using genetic algorithm. Applied Acoustics, Vol. 106, 2016, p. 87-92.
-
Kamiakito N., Shimura M., Iwabuki H., et al. Numerical simulation for low frequency noise from viaduct by the vehicle load. The Journal of the Acoustical Society of America, Vol. 140, Issue 4, 2016, p. 2958-2958.
-
Shangguan W. B., Liu X. A., Lv Z. P., et al. Design method of automotive powertrain mounting system based on vibration and noise limitations of vehicle level. Mechanical Systems and Signal Processing, Vol. 76, 2016, p. 677-695.
-
Chen X., Wang D., Ma Z. Simulation on a car interior aerodynamic noise control based on statistical energy analysis. Chinese Journal of Mechanical Engineering, Vol. 25, Issue 5, 2012, p. 1016-1021.
-
Yang K., Yang J., Wu J. S., et al. Performance analysis of DF cooperative diversity system with OSTBC over spatially correlated Nakagami-m fading channels. IEEE Transactions on Vehicular Technology, Vol. 63, Issue 3, 2014, p. 1270-1281.
-
Song X., Zhang G., Wang Y., et al. Use of bionic inspired surfaces for aerodynamic drag reduction on motor vehicle body panels. Journal of Zhejiang University – SCIENCE A, Vol. 12, Issue 7, 2011, p. 543-551.
-
Vanherpe F., Baresh D., Lafon P., et al. Wavenumber-frequency analysis of the wall pressure fluctuations in the wake of a car side mirror. 17th AIAA/CEAS Aeroacoustics Conference, 2011.
-
Li J., Huang L., Zhou Y., et al. Computation partitioning for mobile cloud computing in a big data environment. IEEE Transactions on Industrial Informatics, Vol. 13, Issue 4, 2017, p. 2009-2018.
-
Werner M. J., Würz W., Krämer E. Experimental investigation of an aeroacoustic feedback mechanism on a two-dimensional side mirror model. Journal of Sound and Vibration, Vol. 387, 2017, p. 79-95.
-
Xie C., Gu Z. Q., Zong Y. Q., Luo Z. M. Effects of fluid-structure interaction on aerodynamic noise of automobile’s side window. China Mechanical Engineering, Vol. 25, Issue 24, 2014, p. 3390-3396.
-
Shen Y. G., Lu S. L., Meng X. Simulation on aerodynamic noise of automobile’s side window at high speed. Machinery Design and Manufacture, Vol. 7, 2012, p. 125-127.
-
Gu Z. Q., Wang N., Wang Y. P., Zhang Y., Liu L. G. Control of wind buffeting noise in side-window of automobiles based on cavity flow characteristics. Journal of Vibration Engineering, Vol. 27, Issue 3, 2014, p. 408-415.
-
Naser J. Computational fluid dynamics study of vehicle A-pillar aero-acoustics. Applied Acoustics, Vol. 74, Issue 6, 2013, p. 882-896.
-
Levy B., Brancher P. Experimental investigation of the wall dynamics of the A-pillar vortex flow. Journal of Fluids and Structures, Vol. 55, 2015, p. 540-545.
-
Gu Z. Q., Zong Y. Q., Luo Z. M., et al. Numerical simulation of automobile side-window buffeting noise based on fluid-structure interaction. Applied Acoustics, Vol. 90, 2015, p. 126-137.
-
Mukkamala Y., Devabhaktuni S., Rajkumar V. G. Computational aero-acoustic modelling of external rear-view mirrors on a mid-sized Sedan. Noise and Vibration Worldwide, Vol. 47, Issues 1-2, 2016, p. 7-16.
-
Li J., Deng G., Luo C., et al. A Hybrid path planning method in unmanned air/ground vehicle (UAV/UGV) cooperative systems. IEEE Transactions on Vehicular Technology, Vol. 65, Issue 12, 2016, p. 9585-9596.
-
Wang J., Zhang C., Wu Z., et al. Numerical study on reduction of aerodynamic noise around an airfoil with biomimetic structures. Journal of Sound and Vibration, Vol. 394, 2017, p. 46-58.
-
Phan H. V., Truong Q. T., Au T. K. L., et al. Effect of wing kinematics modulation on aerodynamic force generation in hovering insect-mimicking flapping-wing micro air vehicle. Journal of Bionic Engineering, Vol. 12, Issue 4, 2015, p. 539-554.
-
Shi L., Zhang C., Wang J., et al. Numerical simulation of the effect of bionic serrated structures on the aerodynamic noise of a circular cylinder. Journal of Bionic Engineering, Vol. 9, Issue 1, 2012, p. 91-98.
-
Wei W., Fan X., Song H., et al. Imperfect information dynamic stackelberg game based resource allocation using hidden Markov for cloud computing. IEEE Transactions on Services Computing, 2016, https://doi.org/10.1109/TSC.2016.2528246.
-
Li J., He S., Ming Z., et al. An intelligent wireless sensor networks system with multiple servers communication. International Journal of Distributed Sensor Networks, Vol. 11, Issue 8, 2015, p. 960173.
-
Ding G. M., Tan Z. H., Wu J. S., et al. Efficient indoor fingerprinting localization technique using regional propagation model. IEICE Transactions on Communications, Vol. 97, Issue 8, 2014, p. 1728-1741.
-
Mallardo V., Aliabadi M. H., Brancati A., et al. An accelerated BEM for simulation of noise control in the aircraft cabin. Aerospace Science and Technology, Vol. 23, Issue 1, 2012, p. 418-428.
-
Larbi W., Deü J. F., Ohayon R., et al. Coupled FEM/BEM for control of noise radiation and sound transmission using piezoelectric shunt damping. Applied Acoustics, Vol. 86, 2014, p. 146-153.
-
Li Q., Song X., Wu D. A 2.5-dimensional method for the prediction of structure-borne low-frequency noise from concrete rail transit bridges. The Journal of the Acoustical Society of America, Vol. 135, Issue 5, 2014, p. 2718-2726.
-
Jiao Y. H., Xia K., Cai Y. L. Vibration noise calculation and testing analysis of large vertical planetary transmission gearbox based on FEM and BEM. Journal of Vibration and Shock, Vol. 31, Issue 4, 2012, p. 123-127.
-
Shi Q. J., Wu J. S., Chen Q. C., et al. Optimum linear block precoding for multi-point cooperative transmission with per-antenna power constraints. IEEE Transactions on Wireless Communications, Vol. 11, Issue 9, 2012, p. 3158-3169.
-
Du J., Xiao P., Wu J., et al. Design of isotropic orthogonal transform algorithm-based multicarrier systems with blind channel estimation. IET Communications, Vol. 6, Issue 16, 2012, p. 2695-2704.
-
Yang K., Martin S., Xing C. W., et al. Energy-efficient power control for device-to-device communications. IEEE Journal on Selected Areas in Communications, Vol. 34, Issue 12, 2016, p. 3208-3220.
-
Luo Q. L., Fang W. Reliable broadband wireless communication for high speed trains using baseband cloud. EURASIP Journal on Wireless Communications and Networking, 2012, https://doi.org/10.1186/1687-1499-2012-285.
-
Wei W., Sun Z., Song H., et al. Energy balance-based steerable arguments coverage method in WSNs. IEEE Access, 2017, https://doi.org/10.1109/ACCESS.2017.2682845.
-
Xiao P., Wu J. S., Cowan C. F. N. MIMO detection schemes with interference and noise estimation enhancement. IEEE Transactions on Communications, Vol. 59, Issue 1, 2011, p. 26-32.
About this article

