Abstract
The rectangular cavity structure was applied to edges of the rear view mirror, numerical computation was conducted for aerodynamic noises of the rear view mirror, and the results of optimized structure were compared with those of the original structure to verify optimized effects. Wind tunnel test was then conducted on the rear view mirror to verify correctness of the computational model. Sound pressure levels of each observation point between experimental test and numerical simulation were basically consistent, where only parts of the peak frequency points were different. The computational accuracy was very high. Two large-size vortexes were in this region behind the common rear view mirror. Vortexes above the rear part of the rear view mirror rotated anticlockwise, while vortexes under it rotated clockwise. There were two vortexes in the region behind the optimized rear view mirror, but the energy intensity of this vortex near the side window panel was very weak. Pressures on the front part of the optimized rear view mirror were also smaller than those of the original structure. In addition, it could be found that radiation noise distribution of the rear view mirror on the lateral window presented symmetry. When lateral window effects were considered, the aerodynamic noise was more than results without considering the lateral window effects. Total noises of each observation point without considering the lateral window effects were 56.7 dB, 59.2 dB, 58.6 dB, 58.9 dB, 62.3 dB and 63.1 dB, respectively. Total noises at each observation point with consideration of the lateral window effects were 65.3 dB, 66.5 dB, 68.7 dB, 69.2 dB, 70.1 dB and 70.8 dB, respectively. Therefore, when aerodynamic noises of the rear view mirror were computed, impacts of lateral window effects must be considered, otherwise the computation would be seriously deviated from actual situations. The frequency corresponding to maximum peaks of the aerodynamic noise after optimization approached the self-oscillation frequency of the rectangular cavity. The result indicates that aerodynamic noises in the rectangular cavity were fluid self-oscillation caused by the cavity structure. In addition, within the analyzed frequency band, the aerodynamic noises of the optimized rear view mirror were smaller than those of the original structure. The maximum decrease rate of total noises of the optimized rear view mirror was 15.62 %, and minimum decrease rate was 8.90 %. Optimized effects were very significant, especially in the low frequency bands.
1. Introduction
In recent years, with high-speed development of vehicles, aerodynamic noise problems of vehicles have drawn extensive attention. It is found in experimental and simulation researches: key parts which make large contributions to aerodynamic noises include rear view mirrors, A pillar, front windshield, lateral windows, wheels, chassis and door handles. When a vehicle runs at a speed lower than 80 km/h, aerodynamic noises only have small effects on comfort in the vehicle. When the vehicle runs at a speed over 80 km/h, especially when the vehicle runs at the high speed of 120 km/h on an expressway, aerodynamic noises transmitted into the vehicle would affect comfort level in the vehicle. With regard to the vehicle running at a high speed, a flow field formed outside the vehicle is composed of complicated turbulent flows. In particular, flow fields around rear view mirrors, A pillar, wheels and chassis are complicated, where pressure pulsation are violent and make large contributions to the total sound pressure level of near-field aerodynamic noises, and impacts of windscreen wipers and antenna are relatively small. As a convex object of the vehicle, the rear view mirror could cause strong aerodynamic noises due to the large pressure pulsation on the surface as well as strong vortexes on the tail part, becoming one of the main noise sources radiated to interior and exterior of the vehicle [1-5]. Aerodynamic noises caused by the rear view mirror is composed of a dipole sound source caused by unsteady pressures on the surface as well as a quadrupole sound source excited by vortexes at the tail part. The Mach number is far lower than 1, and sound production efficiency of the quadrupole sound source is far lower than that of the dipole sound source, so the aerodynamic noise is mainly generated from the dipole sound source. It is proved in many researches [6-11] that sound power of aerodynamic noises generated from the rear view mirror increases with the square increase of pressure pulsation. Therefore, learning about pressure pulsation on the rear view mirror, as well as size, distribution and frequency spectrum characteristics of velocity pulsation on the tail part, flow mechanisms of aerodynamic noises generated by the rear view mirror could be revealed easily, so that aerodynamic noise of the rear view mirror could be estimated and controlled.
At the stage of research and development of vehicles, rational matching between rear view mirrors and vehicle body could effectively reduce fluid dynamics and aerodynamic noises. Methods including wind tunnel test and numerical simulation could be used to study characteristics of pressure and velocity field of common rear view mirrors. Both methods could visualize the complicated turbulent flow fields of the rear view mirrors, re-present the flow characteristics of the rear view mirror and verify feasibility of simulation methods. Therefore, current researches on aerodynamic noises of the rear view mirror have obtained some achievements. In order to reduce aerodynamic noises of vehicles effectively, aerodynamic noise computation is divided into flow-field and sound field computation according to theory of acoustic analogy. Liu [12] combined two methods, wherein full-domain and sub-domain distribution was used for flow field computation, and ACTRAN was used to compute the sound field, so as to conduct numerical simulation of aerodynamic noises of the rear view mirror. Yang [13] established a geometric model which could express flow characteristics of a rear view mirror region and adopted fluid dynamic software to obtain flow field characteristics of the rear view mirror as well as basic information of the aerodynamic noise source item. Li [14] selected three shape parameters and two angle parameters which might affect aerodynamic noises of the rear view mirror, and used large eddy simulation and FW-H equations to predict aerodynamic noises of the rear view mirror. Chen [15] conducted three-dimensional digital modeling of two rear view mirrors, adopted the FLUENT to compute aerodynamic noises according to sound computation theories, and conducted comparative analysis. Wang [16] adopted large eddy simulation and FW-H equations to predict aerodynamic noises outside the vehicle, and conducted optimization and improvement for local noises of rear view mirrors. Lan [17] computed the flow field outside the vehicle and aerodynamic noises at an observation point, and also studied impacts of uniform-speed and accelerated motion on the flow field and aerodynamic noise at the observation point. Chen [18] conducted numerical simulation of external flow fields caused by different edge structures of a rear view mirror outside the vehicle as well as aerodynamic noises at observation points of the rear view mirror. Studied results show that different edge structures affected speeds and streamline directions of air flows. Regarding the aerodynamic noise caused by the rear view mirror, Chen [19] conducted experimental researches on 5 types of rear view mirrors in a wind tunnel. Bai [20] studied mechanisms of noises generated from the window vibration which was caused by rear view mirrors during high-speed running, wherein the sound pressure level at ears of a driver in the vehicle was taken as the index to evaluate the contribution level of the noise source. In order to investigate the wake structure around the external rear view mirror of a passenger car, Kim [21] has tested velocity vector fields and spectra of velocity fluctuations in the mirror wake by using hot wire anemometry and laser Doppler velocimetry in a blow down wind tunnel. Khalighi [22] investigated unsteady flow fields of two rear view mirrors and conducted wind tunnel test and numerical simulation. In the mentioned researches, they have not taken some measures to reduce the aerodynamic noise of the rear view mirror. Moreover, they did not study the impact of the side window on the computation.
Geng [23] analyzed radiation characteristics of noises in a rectangular cavity and pointed out that the rectangular cavity structure can effectively attenuate turbulent flow energy of fluids and reduce radiation noises. Therefore, the rectangular cavity structure is already widely applied in engineering fields. For example, Li and Yang [24, 25] used the rectangular cavity structure at connection of high-speed trains, and analyzed impacts of connection shapes and windshields on aerodynamic noises based on theory of acoustic analogy. Therefore, the rectangular cavity structure was applied to edges of the rear view mirror to optimize the aerodynamic noise, and the results of optimized structure were compared with those of the original structure. Within the analyzed frequency band, the aerodynamic noises of the optimized rear view mirror were smaller than those of the original structure. The maximum decrease rate of total noises of the optimized rear view mirror was 15.62 %, and minimum decrease rate was 8.90 %. Optimized effects were very significant, especially in the low frequency bands.
2. Numerical computation for flow field of rear view mirrors
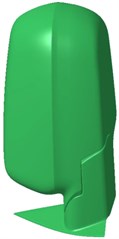
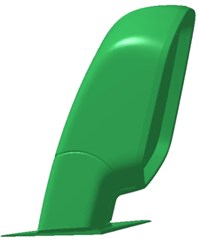
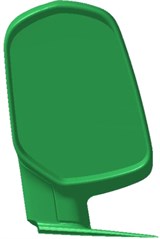
In order to learn about pressure pulsations of the real rear view mirror and the velocity pulsations more clearly, a real rear view mirror shape was taken as the studied model. The rear view mirror is 0.25 m long and 0.12 m wide, as shown in Fig. 1. Detailed characteristics of the rear view mirror were neglected as these structures only had very tiny impacts on flow field results, but would increase difficulty and computational time of mesh division.
Fig. 1Geometric model of the numerical computation of the rear view mirror
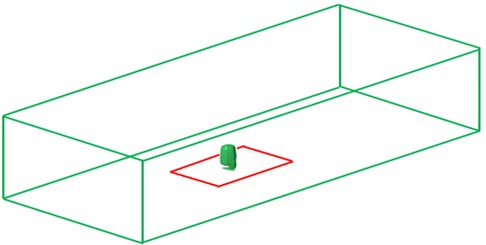
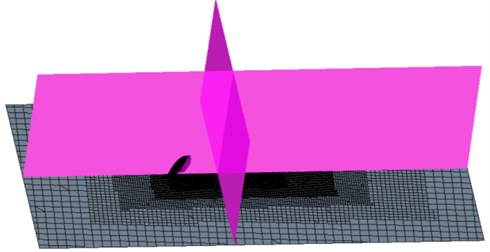
With the subsequent wind tunnel test method as the reference, a simulation model was established, as shown in Fig. 2. The rear view mirror was arranged on a panel with length of 1000 mm and width of 120 mm. The panel is used to simulate a lateral window of the rear view mirror. In order to observe flow field characteristics of the rear view mirror, an observation plane was set at the longitudinal direction and the tail part of the rear view mirror respectively. The computational domain of the simulation model is as follows: length is 10200 mm; width is 4000 mm; high dimension of 1200 mm; distance between the flow field inlet and the panel is 3.5 times the length of the panel; the distance between the outlet and the panel is 5.5 times the length of the panel; the whole panel is symmetric from left to right in the wind tunnel. In order to ensure mesh quality, tapered mesh division was adopted on the bottom face of the computational domain. The discretization error decreased with the increase of meshes; the round-off error increased with the increase of discrete nodes; computational accuracy increased linearly with the increase of mesh amount. In addition, increase of the mesh quantity would inevitably increase the iteration convergence time. As a result, the corresponding computation time was prolonged. Tt is not always better to have more meshes. Therefore, it is necessary to find a set of meshes with proper density. In general, when the computational error of two sets of meshes was within 2 %, the computation would be deemed to be unrelated with meshes. Three sets of meshes were used for trial computation. Results are shown in Table 1. Amounts of the computational meshes are 5.3 million, 6.5 million and 7.1 million, respectively. Results show that the computational error was less than 1.92 % when the total amount of meshes was more than 7.1 million. Therefore, the mesh amount of the computational model was 7.1 million, which could satisfy requirements for mesh independence testing. Therefore, the maximum size of meshes on the surface of rear view mirrors is 6 mm. A partial figure of meshes is shown in Fig. 3. In order to solve wall face boundary layers better, boundary layer meshes were established on the surface of the rear view mirror. In view of special requirements of LES for meshes, hybrid meshes were used in the simulation model. Face meshes were stretched by tools. As for the first layer of meshes: thickness is 0.01 mm; meshes conducted linear growth; slope is 0.2; 10 layers were stretched in total; total height is 9.1 mm. After generation of the boundary layers, tetrahedral mesh division was conducted on the whole fluid computation domain, so coupling between structural meshes and non-structural meshes was formed. Tapered mesh division was applied to the whole computation model, namely meshes around the rear view mirror should ensure enough density. Regions far from the rear view mirror should be sparse appropriately. Therefore, computational accuracy and efficiency could be balanced. Total amount of meshes in the whole computation domain was 7.1 million.
Table 1Comparison of the computation for three sets of mesh schemes
Schemes | Maximum mesh in flow field (mm) | Maximum mesh on surface (mm) | Total amount of meshes/10000 | Mesh increment | Pressure value (Pa) | Relative errors |
1 | 54 | 10 | 530 | –805.5 | ||
2 | 45 | 8 | 650 | 22.64 % | –843.1 | 4.66 % |
3 | 36 | 6 | 710 | 9.23 % | –859.3 | 1.92 % |
Fig. 2Computational domain of the flow field of the rear view mirror
a) Computational domain of the rear view mirror
b) Panel observation points
Fig. 3Meshes of the computational domain and rear view mirrors
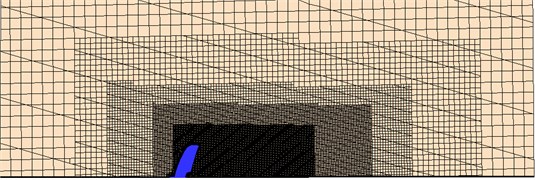
a) Meshes of the computational domain
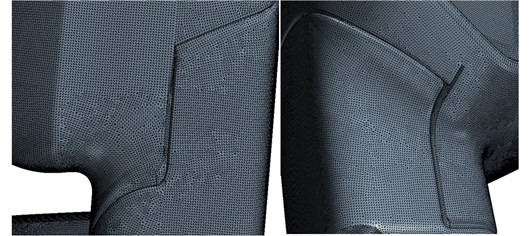
b) Local zoomed in meshes
Solution of a turbulent flow field was based on LES in the FLUENT frame. A Smagorinsky-Lilly model was selected. The non-viscous boundary condition was applied to two lateral faces and the top face; the no-slip wall boundary condition was applied to the ground and surfaces of the rear view mirror. Inlet of the computational domain was designated as the velocity inlet; the inlet velocity was set as 33.3 m/s; the velocity was corresponding to a Reynolds number of Re = 1.23×10⁷; the outlet was designated as the pressure outlet. During computation, Realizable - two-equation turbulence model in the RANS frame was used to obtain a steady solution of the flow field; then, based on the steady solution, LES was used for the unsteady computation of the flow field. In view of two factors including the computational accuracy and the computational efficiency, the unsteady time step length was determined to be 0.0005 s; and 25 sub-iterations were conducted within every time step. Through analysis on the residual error and detection of parameters such as pressure coefficient of the rear view mirror and the tail part velocity of the rear view mirror, computational convergence within each time step length was determined, and the set time step length could ensure the sufficiency of sampling points. Through analysis on changing process within 0-1 s, it was found that the flowing was dynamically steady when the computational time was more than 1 s. The whole computation lasted for 4000 time steps. Finally, the computation of 2000 time steps was used for non-steady data analysis. It is notable that the time step length adopted by computation should ensure sufficiency of points within the computational time. Meanwhile, analysis on data obtained in the last 1s could ensure that the maximum errors of the average pressure coefficient and the pressure pulsation standard deviation brought by computation were within 0.5 %.
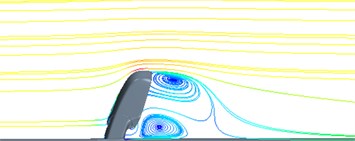
The velocity streamlines and pressure distribution of the rear view mirror are shown in Fig. 4 and Fig. 5, respectively. It was found that when airflows blew in the face the downstream fluid state of the rear view mirror was chaotic, the velocity direction changed violently, pressure pulsation could be generated easily, and the region was a very strong aerodynamic noise source. Two large-size vortexes were in this region behind the rear view mirror because of the different flow velocity of the fluid. When the high velocity fluid met the low velocity fluid, the vortex will be generated. A low-pressure region was at the tail part of the rear view mirror. Positions of the low-pressure region and the vortex center were basically consistent because static pressure at the low-pressure center was small, and force caused by the pressure provided centripetal force of vortex motion. Therefore, when a vehicle runs, a low-pressure region and a low-pressure center were at the rear part of the rear view mirror. As a result, violent turbulent flows appeared at the tail part of the rear view mirror, and the aerodynamic noise increased. It is shown in the figure that vortexes above the rear part of the rear view mirror rotated anticlockwise; vortexes under it rotated clockwise.
Fig. 4Velocity streamlines of the rear view mirror
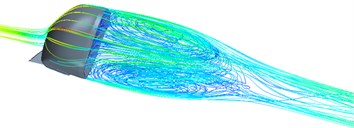
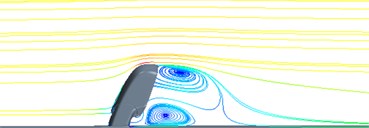
Fig. 5Pressure distribution contours of the rear view mirror
3. Numerical computation of flow noises with consideration of lateral window effects
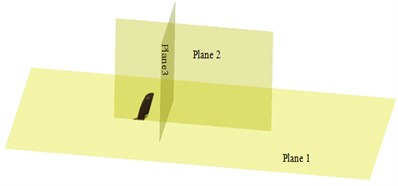
Pressure pulsation results were input into Virtual.lab software to compute the aerodynamic noise of rear view mirrors. Due to limit of the computer capacity, quadrilateral elements were used to divide the surface of the rear view mirror. Solid elements could not be used as boundary elements. Therefore, hollowing processing should be conducted on the finite element model, so the model could be converted into a corresponding acoustic boundary element model. Size of acoustic meshes was decided by both the overall structure size and the maximum computation frequency. Therefore, requirements could be satisfied only when the element characteristic size was not higher than 1/6 of the sound wave length decided by the maximum frequency. It was assumed that the propagation speed of sound in the fluid medium was , and the maximum required computation frequency was , so the required element length should satisfy the Eq. (1). With comprehensive consideration of computational accuracy, modeling complexity and solution success probability, the maximum element length adopted by the acoustic boundary element was 5 mm, and the maximum computation frequency was 5000 Hz. Mesh size of the finite element model was much smaller than the mesh size of the boundary element model, and they were different in mesh density and geometric shape, so a four-node interpolation method was used for the interpolation in Virtual.lab. Air density was 1.225 kg/m3. Sound speed was 340 m/s. Damping effects of air on sound propagation were not considered. In this way, pressure pulsation on the surface of rear view mirrors could be mapped onto the acoustic boundary element meshes, and thus aerodynamic noises of the rear view mirror could be computed. In addition, in order to observe aerodynamic noises of the rear view mirror, planar observation points were arranged in , and planes. 6 observation points were arranged on the lateral window wall face behind the rear view mirror, as shown in Fig. 6:
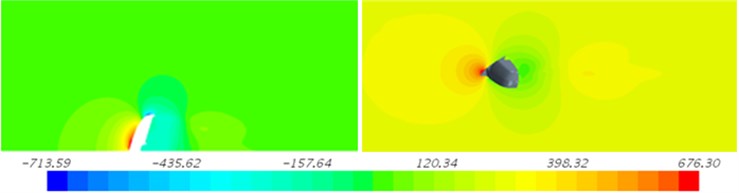
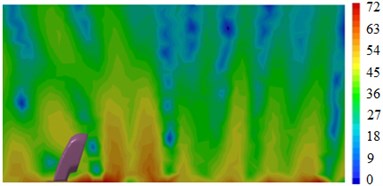
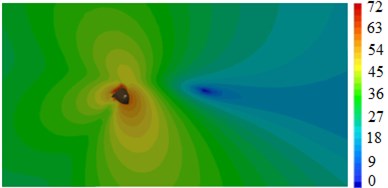
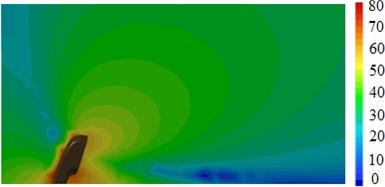
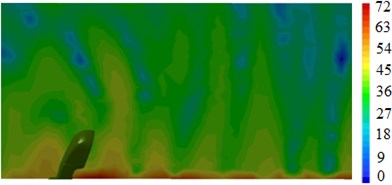
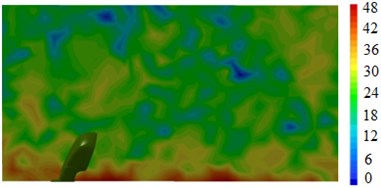
Sound pressure level curves of 6 observation points were extracted, as shown in Fig. 7. It is shown in the figure that sound pressure level curves at each observation point gradually decreased with the analyzed frequency. Sound pressure level curves at each observation point had obvious valley values. Observation points 1 and 2 were deviated from the center of rear view mirrors, so turbulent flows were not very violent here, and thus aerodynamic noises at the position was smaller than that at other observation points. Observation points 3, 4, 5 and 6 were located in turbulent flow regions at the tail part of the rear view mirror, and the aerodynamic noise was relatively large and basically consistent. Total noise levels of each observation point were computed respectively, namely 65.3 dB, 66.5 dB, 68.7 dB, 69.2 dB, 70.1 dB and 70.8 dB. Sound pressure contours of three observation planes were further extracted, as shown in Fig. 8. Distribution of the noise sources became gradually uniform with the analyzed frequency. In high frequencies, wavelengths of the noise source were very short. Sizes of uneven parts on the rear view mirror surface were much larger than the wavelength; noise source distribution was uniform; otherwise, the noise source distribution was non-uniform. In addition, it could be found in the contour that radiation noise distribution of the rear view mirror on the lateral window presented symmetry.
Fig. 6Boundary element model and observation points of the rear view mirror
a) Boundary element model
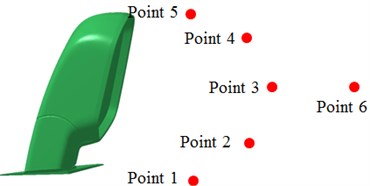
b) Observation points
Fig. 7Sound pressure levels of different observation points with consideration of lateral window
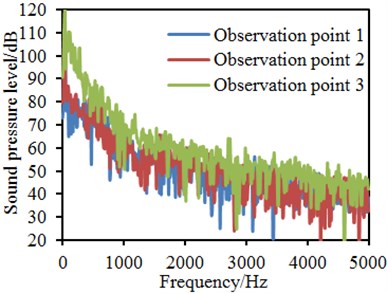
a) Observation points 1, 2, 3
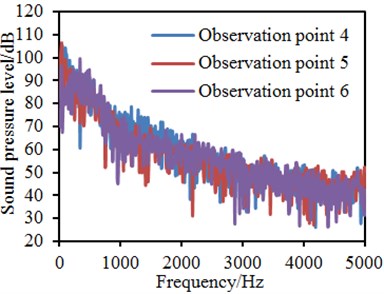
b) Observation points 4, 5, 6
4. Numerical computation of flow noises without considering lateral window effects
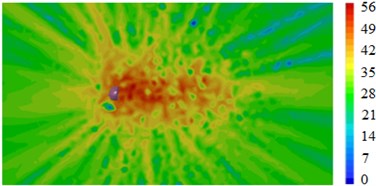
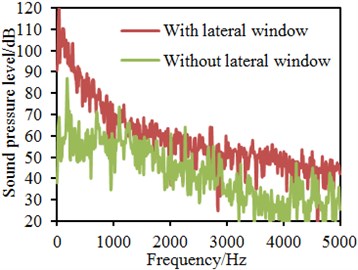
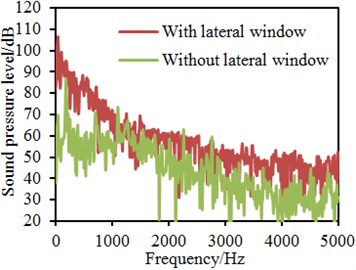
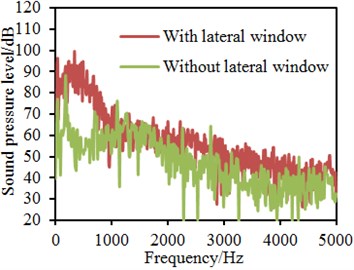
In Section 3, lateral window effects were considered when aerodynamic noises of the rear view mirror were computed. In order to study impacts of lateral window effects on aerodynamic noises of the rear view mirror, only the rear view mirror was taken as the noise source here for computing aerodynamic noises. The computation was compared with Section 3, as shown in Fig. 9. It is shown in the figure that, when lateral window effects were considered, the aerodynamic noise was more than results without considering the lateral window effects. Observation points were completely arranged on the lateral window, airflows would generate separated vortexes and turbulent flows on the lateral window. As noise sources, these separated vortexes and turbulent flows would cause aerodynamic noises. Therefore, results with consideration of the lateral window effects would be larger. Contours of aerodynamic noises of the rear view mirror in each plane were extracted, as shown in Fig. 10.
Fig. 8Sound pressure contours of different observation panels with consideration of lateral window
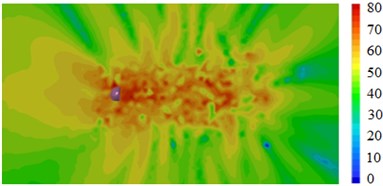
a) 1000 Hz (panel 1)
b) 5000 Hz (panel 1)
c) 1000 Hz (panel 2)
d) 5000 Hz (panel 2)
e) 1000 Hz (panel 3)
f) 5000 Hz (panel 3)
Fig. 9Comparisons of sound pressure levels with and without considering the lateral window
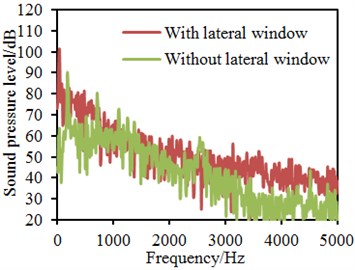
a) Observation point 1
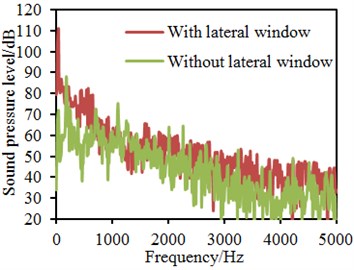
b) Observation point 2
c) Observation point 3
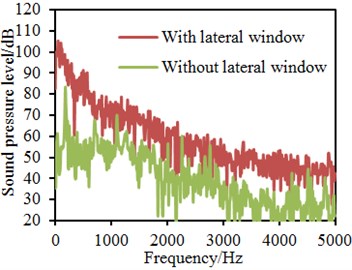
d) Observation point 4
e) Observation point 5
f) Observation point 6
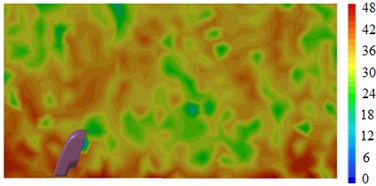
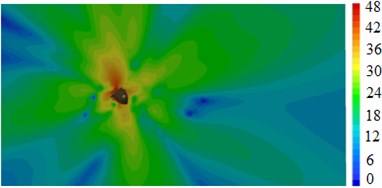
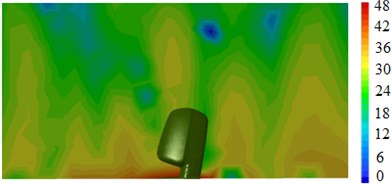
Compared with Fig. 8, it could be found that sound pressure contours with consideration of the lateral window effects were different from results without considering the lateral window. In addition, distribution of radiation noises in Fig. 10 had directivity; intensity of the noise source was weak; distribution regions were small. Total noises of each observation point without considering the lateral window effects were computed, wherein results were 56.7 dB, 59.2 dB, 58.6 dB, 58.9 dB, 62.3 dB and 63.1d B, respectively. Total noises at each observation point with consideration of the lateral window effects were 65.3 dB, 66.5 dB, 68.7 dB, 69.2 dB, 70.1 dB and 70.8 dB, respectively. Therefore, when aerodynamic noises of the rear view mirror were computed, impacts of lateral window effects must be considered, otherwise the computation would be seriously deviated from actual situations.
Fig. 10Sound pressure contours of observation panels without considering the lateral window
a) 1000 Hz (panel 1)
b) 5000 Hz (panel 1)
c) 1000 Hz (panel 2)
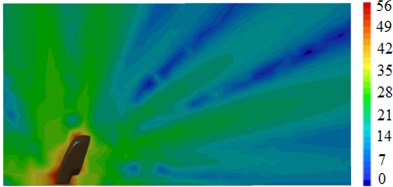
d) 5000 Hz (panel 2)
e) 1000 Hz (panel 3)

f) 5000 Hz (panel 3)
5. Experimental verification of flow noises of rear view mirrors
The computational model of flow noises of rear view mirrors was very complex, so its correctness should be validated by experiments. According to the boundary condition of the numerical simulation, the experimental microphones were installed in tail flow regions of the rear view mirror to collect sound pressure signals, wherein the end part of the microphone was as high as the plane [26-28] to eliminate the impacts of the experimental environment, as shown in Fig. 11. The experimental test was conducted in a wind tunnel. Sound pressure levels of each observation point were tested. Total noises of each observation point were computed and compared with the numerical simulation, as shown in Table 2. It is shown in the table that the maximum error between experiment and numerical simulation was 1.99 %, and the computational accuracy was relatively high.
Fig. 11Experimental test of sound pressure levels of the rear view mirror
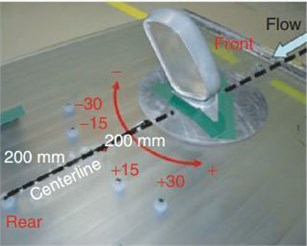
Table 2Comparisons of total noises between experiment and computation
Observation points | Total noises / dB | Relative error / % | |
Experiment | Computation | ||
1 | 64.1 | 65.3 | 1.87 |
2 | 65.2 | 66.5 | 1.99 |
3 | 68.2 | 68.7 | 0.73 |
4 | 70.1 | 69.2 | –1.28 |
5 | 70.9 | 70.1 | –1.13 |
6 | 71.3 | 70.8 | –0.70 |
6. Numerical optimization of flow noises of rear view mirrors
As has been pointed out in the introduction that the rectangular cavity structure could effectively reduce aerodynamic noises, therefore, a rectangular cavity was added on edges of the rear view mirror cover, as shown in Fig. 12. Unsteady shear layer flows would be formed in the rectangular cavity of the rear view mirror. The cavity contained vortex structures which would be separated from upstream edges. Unsteady shear flows containing the vortex structures flowed to downstream and then hit the downstream edges, so the vortex was crushed. Wherein, some of them were downward, and flowed to the cavity bottom along the rear view mirror located on the downstream under fluid effects till they got contact with the cavity bottom. Next, direction of flowing was changed, and the flows flowed back to upstream in clinging with the cavity bottom wall face till the unsteady flows reached the upstream rear view mirror wall face. After that, the flows moved upwards along the wall face. The flow phenomenon is similar to that the air flows encountered a sunken step at first in the motion direction and then encountered a rising step, so self-oscillation was formed [29-33]. Schematic diagram of oscillation is shown in Fig. 13.
Fig. 12Model of the rear view mirror with the rectangular cavity
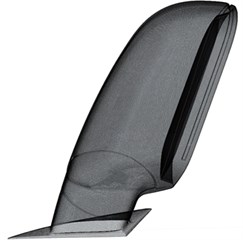
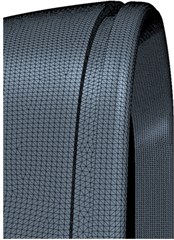
Fig. 13Schematic diagram of oscillation at rear view mirrors [34]
![Schematic diagram of oscillation at rear view mirrors [34]](https://static-01.extrica.com/articles/18740/18740-img36.jpg)
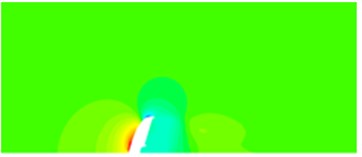
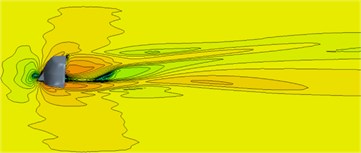
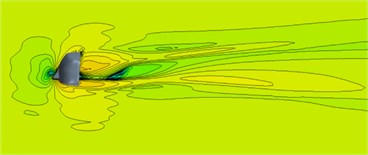
Velocity streamlines and pressure distribution of the rear view mirror are shown in Fig. 14 and Fig. 15. There were two vortexes in the region behind the optimized rear view mirror, but the energy intensity of this vortex near the side window panel was very weak. A low-pressure region was at the tail part of the rear view mirror. Positions of the low-pressure region and the vortex center were basically consistent because static pressure at the low-pressure center was small and force generated by the pressure provided centripetal force of vortex motion. Therefore, when the vehicle ran, the low-pressure region and the low-pressure center appeared at the rear part of the rear view mirror, violent turbulent flows appeared at the tail part of the rear view mirror, and the aerodynamic noise was presented. In addition, it can be found from the figure that pressures on the front part of the optimized rear view mirror were also smaller than those of the original structure. When air flows blew in the face, pressure fluctuations could be generated easily on the downstream of rear view mirrors. The region was a violent aerodynamic noise source, as shown in Fig. 16. However, intensity and scope of the noise source of the optimized rear view mirror were smaller than those of the original structure. The reason is that the rectangular cavity structure on the rear view mirror edges could attenuate velocity and intensity of air flow and reduce the distribution scope and intensity of the noise source.
Self-oscillation frequency in flow regions of the rectangular cavity could be described as follows:
where: is the rectangular activity length; is the flow Mach number of separated vortexes; is set as the air flow average speed. The self-oscillation frequency of the rectangular cavity under the analyzed speed was 120 Hz.
Fig. 14Comparison of velocity streamlines of rear view mirrors before and after optimization
a) Original structure
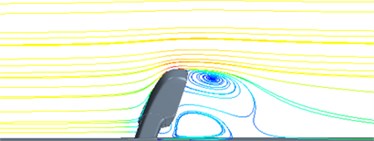
b) Optimized structure
Fig. 15Comparison of pressure contours of rear view mirrors before and after optimization

a) Original structure

b) Optimized structure
Fig. 16Comparison of noise sources of rear view mirrors before and after optimization
a) Original structure
b) Optimized structure
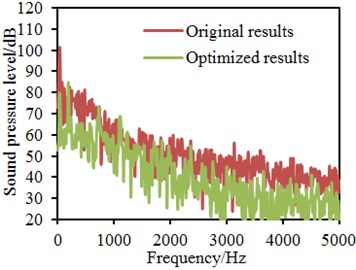
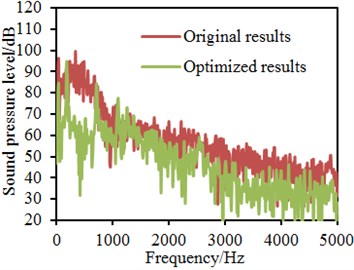
Fig. 17 shows comparison of aerodynamic noises at each observation point of the rear view mirror before and after optimization. It is shown in the figure that the frequency corresponding to maximum peaks of the aerodynamic noise after optimization approached the self-oscillation frequency of the rectangular cavity. The result indicates that aerodynamic noises in the rectangular cavity were fluid self-oscillation caused by the cavity structure. In addition, within the whole analysis frequency band, the aerodynamic noises of the optimized rear view mirror were smaller than those of the original structure. Optimized effects were very significant, especially in the low frequency bands. The reason is that, when air flows flowed to the rectangular cavity, the upstream vortex would hit downstream edges of the cavity; after crushing of the vortex, irregular flow could be caused and act on the rear view mirror surface connected to the downstream. When air flows flowed through the rectangular cavity, most air flowed to downstream directly along the surface of the rear view mirror, so airflows in the rectangular cavity were reduced, while air flow feedback effects and sound wave energy transmitted to the upstream were weakened. Therefore, the intensity and scope of noises of the optimized rear view mirror would be smaller. Total noises at each observation point of the optimized rear view mirror were computed and compared with original results, as shown in Table 3. It is shown in the figure that the maximum decrease rate of total noises of the optimized rear view mirror was 15.62 %, and minimum decrease rate was 8.90 %.
Fig. 17Comparisons of sound pressure levels before and after optimization
a) Observation point 1
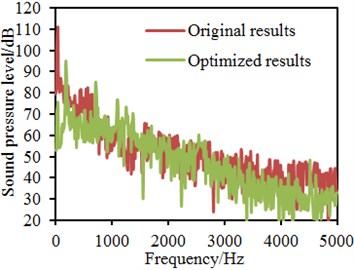
b) Observation point 2
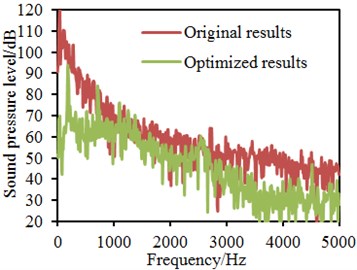
c) Observation point 3
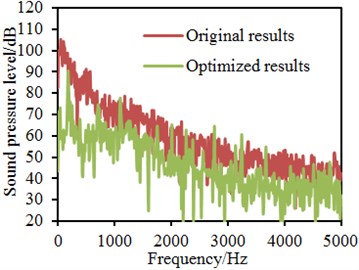
d) Observation point 4
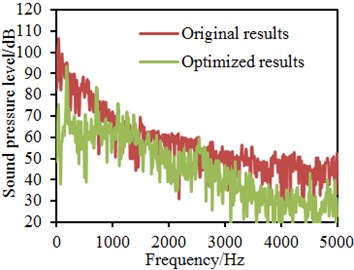
e) Observation point 5
f) Observation point 6
Table 3Comparisons of total noises before and after optimization
Observation points | Total noises / dB | Relative reduction / % | |
Original results | Optimized results | ||
1 | 65.3 | 55.1 | 15.62 |
2 | 66.5 | 59.3 | 10.83 |
3 | 68.7 | 58.4 | 14.99 |
4 | 69.2 | 60.1 | 13.15 |
5 | 70.1 | 63.2 | 9.84 |
6 | 70.8 | 64.5 | 8.90 |
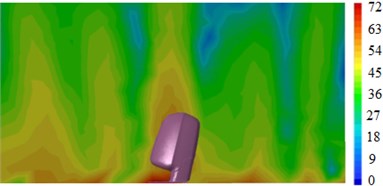
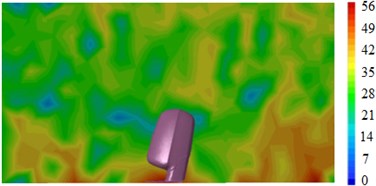
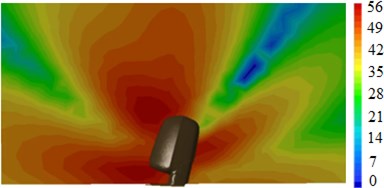
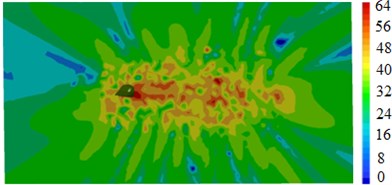
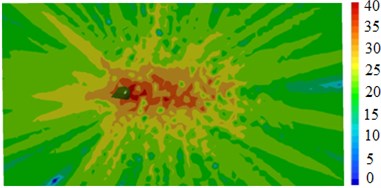
Sound pressure contours of the optimized rear view mirror on each observation plane were extracted, as shown in Fig. 18. It is shown in the figure that noise source distribution became gradually uniform with the increased frequency. In high frequencies, wave length of the noise source was very short, size of convex parts of the rear view mirror surface was much larger than the noise wavelength, and the noise source distribution was evener; on the contrary, the noise source distribution was more uneven. Compared with Fig. 8, it could be found that scope and intensity of the noise source of the optimized rear view mirror were reduced. The reason is that when air flows flowed through upstream edges of the rectangular cavity of the rear view mirror, vortexes would be separated from the upstream edges, and the separated vortexes moved towards downstream and hit downstream edges of the cavity. While hitting the downstream edges, the vortex could get deformed and crushed to a great extent. Vortexes with different scales and different spreading directions would be generated. Small-scale vortexes were small compared with size of the rear view mirror and would not cause aerodynamic noises. A part of large-scale vortexes flowed into the cavity, so the velocity was reduced. The other part of vortexes would move to downstream in clinging with the rear view mirror surface. They would be separated and once again adhere on the surface of the rear view mirror. As a result, pressures on the downstream rear view mirror would change continuously and generate different radiation noises.
Fig. 18Sound pressure contours of different observation panels after optimization
a) 1000 Hz (panel 1)
b) 5000 Hz (panel 1)
c) 1000 Hz (panel 2)
d) 5000 Hz (panel 2)
e) 1000 Hz (panel 3)
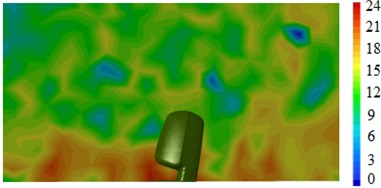
f) 5000 Hz (panel 3)
7. Conclusions
The rectangular cavity structure was applied to edges of the rear view mirror, numerical computation was conducted for aerodynamic noises of the rear view mirror, and the results of optimized structure were compared with those of the original structure to verify optimized effects. Therefore, the following conclusions can be achieved:
1) Two large-size vortexes were in this region behind the rear view mirror. A low-pressure region was at the tail part of the rear view mirror. Positions of the low-pressure region and the vortex center were basically consistent. Vortexes above the rear part of the rear view mirror rotated anticlockwise; vortexes under it rotated clockwise. There were two vortexes in the region behind the optimized rear view mirror, but the energy intensity of this vortex near the side window panel was very weak. Pressures on the front part of the optimized rear view mirror were also smaller than those of the original structure.
2) Sound pressure level curves at each observation point gradually decreased with the analyzed frequency. Sound pressure level curves at each observation point had valley values. Total noises of each observation point were 65.3 dB, 66.5 dB, 68.7 dB, 69.2 dB, 70.1 dB and 70.8 dB. Distribution of the noise sources became gradually uniform with the analyzed frequency. In addition, radiation noise distribution of the rear view mirror on the lateral window presented symmetry.
3) When lateral window effects were considered, the aerodynamic noise was more than results without considering the lateral window effects. Total noises of each observation point without considering the lateral window effects were 56.7 dB, 59.2 dB, 58.6 dB, 58.9 dB, 62.3 dB and 63.1 dB, respectively. Total noises at each observation point with consideration of the lateral window effects were 65.3 dB, 66.5 dB, 68.7 dB, 69.2 dB, 70.1 dB and 70.8 dB, respectively. Therefore, when aerodynamic noises of the rear view mirror were computed, impacts of lateral window effects must be considered, otherwise the computation would be seriously deviated from actual situations.
4) In order to verify correctness of the computational model of aerodynamic noises of the rear view mirror, wind tunnel test was conducted on the rear view mirror. Sound pressure levels of each observation point between experimental test and numerical simulation were basically consistent, where only parts of the peak frequency points were different. The computational accuracy was very high.
5) The frequency corresponding to maximum peaks of the aerodynamic noise after optimization approached the self-oscillation frequency of the rectangular cavity. The result indicates that aerodynamic noises in the rectangular cavity were fluid self-oscillation caused by the cavity structure. In addition, within the analyzed frequency band, the aerodynamic noises of the optimized rear view mirror were smaller than those of the original structure. The maximum decrease rate of total noises of the optimized rear view mirror was 15.62 %, and minimum decrease rate was 8.90 %. Optimized effects were very significant, especially in the low frequency bands.
References
-
Rinoshika A., Watanabe S. Orthogonal wavelet decomposition of turbulent structures behind a vehicle external mirror. Experimental Thermal and Fluid Science, Vol. 34, Issue 8, 2010, p. 1389-1397.
-
Yang Z., Gu Z., Tu J., et al. Numerical analysis and passive control of a car side window buffeting noise based on scale-adaptive simulation. Applied Acoustics, Vol. 79, 2014, p. 23-34.
-
Li Q., Yang Z., Wang Y., et al. Experimental and numerical studies on aerodynamic noise of automotive rear view mirror. Noise Control Engineering Journal, Vol. 59, Issue 6, 2011, p. 613-621.
-
Wei W., Song H., Wang H., et al. Research and simulation of queue management algorithms in ad hoc network under DDoS attack. IEEE Access, 2017, p. 2169-3536.
-
Kato Y. Numerical simulations of aeroacoustic fields around automobile rear-view mirrors. SAE International Journal of Passenger Cars-Mechanical Systems, Vol. 5, Issue 1, 2012, p. 567-579.
-
Xiao P., Wu J. S., Sellathurai M., et al. Iterative multiuser detection and decoding for DS-CDMA system with space-time linear dispersion. IEEE Transactions on Vehicular Technology, Vol. 58, Issue 5, 2009, p. 2343-2353.
-
Wang N., Gu Z. Q., Liu S. C., et al. Wind buffeting noise analysis and control for high-speed vehicle side-windows. Journal of Aerospace Power, Vol. 28, Issue 1, 2013, p. 112-119.
-
Frank H. M., Munz C. D. Direct aeroacoustic simulation of acoustic feedback phenomena on a side-view mirror. Journal of Sound and Vibration, Vol. 371, 2016, p. 132-149.
-
Miyoshi M., Hamamoto N., Nakamura Y. Direct numerical prediction of aerodynamic noise emitted from a generic automobile rear-view mirror. Journal of Fluid Science and Technology, Vol. 7, Issue 3, 2012, p. 290-303.
-
Murad N., Naser J., Alam F., et al. Computational fluid dynamics study of vehicle A-pillar aero-acoustics. Applied Acoustics, Vol. 74, Issue 6, 2013, p. 882-896.
-
Gu Z., Zong Y., Luo Z., et al. Numerical simulation of automobile side-window buffeting noise based on fluid–structure interaction. Applied Acoustics, Vol. 90, 2015, p. 126-137.
-
Liu H. J., Ren B. Y., Xu X., Zhao W. F., Liu E. B., Liang H., Peng X. Z. Numerical simulation of wind noise of a kind of SUV vehicle rear-view mirror. Journal of Harbin Institute of Technology, Vol. 48, Issue 1, 2016, p. 35-39.
-
Yang B., Hu X. J., Zhang Y. C. Study on unsteady flow field and aerodynamic noise of the automobile rear view mirror region. Journal of Mechanical Engineering, Vol. 46, Issue 22, 2010, p. 151-155.
-
Li Q. L., Yang Z. G., Wang Y. G. Influence parameters of aerodynamic noise for automotive rear view mirror. Journal of Tongji University (Natural Science), Vol. 39, Issue 8, 2011, p. 1204-1207.
-
Chen X., Liu L., Wang D. F. Research on aerodynamic noise of base styling of exterior rear view mirror. Automobile Technology, Vol. 4, 2011, p. 8-11.
-
Wang Y. P., Gu Z. Q., Yang X., Li W. P., Yuan Z. Q. Aerodynamic noise analysis and control for minivan car side view mirror. Journal of Aerospace Power, Vol. 24, Issue 7, 2009, p. 1577-1583.
-
Lan T., Kang N., Zheng H., Hu C. A. Study on the aerodynamic noise of a fastback car with rear view mirrors in uniform motion and accelerated motion. Journal of Aerospace Power, Vol. 24, Issue 1, 2009, p. 116-121.
-
Chen X., Wang H. Y., Gao C. F., Zhang W., Xie C. Effect of rearview mirror edge structure on flow field and aerodynamic noise. Journal of Aerospace Power, Vol. 29, Issue 5, 2014, p. 1099-1104.
-
Chen X., Feng X., Shen C. L., Wang S., Hu C. S., Li Y. Y., Yang C. M. An experimental study on the effects of exterior rearview mirrors styling on aerodynamic noise. Automotive Engineering, Vol. 39, Issue 2, 2017, p. 206-213.
-
Bai C. A., Sui H. T., Li Q. Calculation on wind noise of vehicle rear-view car based on Actran. Computer Aided Engineering, Vol. 22, Issue 1, 2013, p. 124-130.
-
Kim J. H., Han Y. O. Experimental investigation of wake structure around an external rear view mirror of a passenger car. Journal of Wind Engineering and Industrial Aerodynamics, Vol. 99, Issue 12, 2011, p. 1197-1206.
-
Khalighi B., Chen K. H., Johnson J. P., et al. Computational and experimental investigation of the unsteady flow structures around automotive outside rear-view mirrors. International Journal of Automotive Technology, Vol. 14, Issue 1, 2013, p. 143-150.
-
Geng D. H., Liu Z. X. Predicting cavity hydrodynamic noise using a hybrid large eddy simulation-Lighthill’s equivalent acoustic source method. Journal of Harbin Engineering University, Vol. 31, Issue 2, 2010, p. 182-186.
-
Li H., Xiao X. B., Zhu M. H., Jin X. S. Analysis on aerodynamic noise in inter-coach space of high-speed train. Journal of Vibration and Shock, Vol. 35, Issue 6, 2016, p. 109-114.
-
Yang J. S., Jiang C. W., Gao Z. X., Lv Y. C., Zhang J. B., Lee C. H. Influence of inter-car wind-shield schemes on aerodynamic performance of high-speed trains. Journal of the China Railway Society, Vol. 34, Issue 11, 2012, p. 29-35.
-
Wei W., Song H., Li W., et al. Gradient-driven parking navigation using a continuous information potential field based on wireless sensor network. Information Sciences, Vol. 408, 2017, p. 100-114.
-
Du J., Xiao P., Wu J., et al. Design of isotropic orthogonal transform algorithm-based multicarrier systems with blind channel estimation. IET Communications, Vol. 6, Issue 16, 2012, p. 2695-2704.
-
Xiao P., Wu J. S., Cowan C. F. N. MIMO detection schemes with interference and noise estimation enhancement. IEEE Transactions on Communications, Vol. 59, Issue 1, 2011, p. 26-32.
-
Seena A., Sung H. J. Dynamic mode decomposition of turbulent cavity flows for self-sustained oscillations. International Journal of Heat and Fluid Flow, Vol. 32, Issue 6, 2011, p. 1098-1110.
-
Lee S. B., Seena A., Sung H. J. Self-sustained oscillations of turbulent flow in an open cavity. Journal of Aircraft, Vol. 47, Issue 3, 2010, p. 820-834.
-
De Vicente J., Basley J., Meseguer Garrido F., et al. Three-dimensional instabilities over a rectangular open cavity: from linear stability analysis to experimentation. Journal of Fluid Mechanics, Vol. 748, 2014, p. 189-220.
-
Meseguer Garrido F., De Vicente J., Valero E., et al. On linear instability mechanisms in incompressible open cavity flow. Journal of Fluid Mechanics, Vol. 752, 2014, p. 219-236.
-
Wei W., Fan X., Song H., et al. Imperfect information dynamic stackelberg game based resource allocation using hidden Markov for cloud computing. IEEE Transactions on Services Computing, Vol. PP, Issue 99, 2016, p. 1939-1374.
-
Rowley C. W., Colonius T., Basu A. J. On self-sustained oscillations in two-dimensional compressible flow over rectangular cavities. Journal of Fluid Mechanics, Vol. 455, 2002, p. 315-346.
Cited by
About this article

